May 12, Dear Subscriber: We will be adding material to this shell letter after todays reports are released at 11:00 a.m.
|
|
|
- Horace Leslie Baker
- 5 years ago
- Views:
Transcription


1 May 12, 2015 Dear Subscriber: We will be adding material to this shell letter after todays reports are released at 11:00 a.m. Be sure to click back on the link often for the latest information. Whle today s reports establish the new benchmark for crops going forward in the U-S and world, trader attention for the next few weeks will continue to key on weather concerns as the planting season wraps us. Not a lot of planting progress is expected this week potentially setting up some weather preimium to reenter the 1
2 market place IF next week s forecast turns wetter than now advertised. Now on today s reports. Here are the U-S production numbers for wheat: USDA May 2015 Crop Production Report in billions of bushels (released May 12, 2015) Crop USDA May Estimate Average Guess All Wheat All Winter Range USDA Production Hard Red Winter Soft Red Winter White Winter From the May 2015 Crop Production Report: WHEAT: Winter wheat production is forecast at 1.47 billion bushels, up 7 percent from As of May 1, the United States yield is forecast at 43.5 bushels per acre, up 0.9 bushel from last year. Hard Red Winter production, at 853 million bushels, is up 16 percent from a year ago. Soft Red Winter, at 416 million bushels, is down 9 percent from White Winter, at 203 million bushels, is up 10 percent from last year. Of the White Winter production, 11.5 million bushels are Hard White and 191 million bushels are Soft White. To read the full May 2015 Crop Progress Report go to: Here are the numbers from the May 2015 WASDE report: documentid=1046 2
3 USDA May 2015 U-S Ending Stocks for in billions of bushels (released May 12, 2015) Crop USDA May Estimate Average Guess Range USDA April Estimate Corn Soybeans Wheat USDA May 2015 U-S Ending Stocks for in billions of bushels (released May 12, 2015) Crop USDA May Estimate Average Guess Range Corn Soybeans Wheat From the USDA April 2015 WASDE Report: CORN: U.S. feed grain supplies for 2015/16 are projected to slightly exceed the record level of 2014/15 as larger beginning stocks more than offset lower expected production. Corn production is projected at 13.6 billion bushels, down 586 million from the record 2014/15 crop with a 3
4 lower forecast area and yield. The U.S. corn yield is projected at bushels per acre, down 4.2 bushels from the 2014/15 record based on a weather adjusted yield trend that assumes normal summer weather. The 2015 yield outlook is not raised, despite the rapid pace of late-april and early May planting, as more than 90 percent of the variability in the corn yield is determined by July precipitation and temperatures in the Midwest, which are unknowable at this time. Corn supplies for 2015/16 are projected at a record 15.5 billion bushels, up just slightly from 2014/15. U.S. corn use for 2015/16 is projected at a record 13.8 billion bushels, 1 percent higher than this month s revised projection for 2014/15. Feed and residual use for 2015/16 is projected 50 million bushels higher with animal numbers up from 2014/15. Corn used to produce ethanol in 2015/16 is expected to be unchanged as projected gasoline consumption during the 2015/16 marketing year is nearly identical to 2014/15. Corn use in other food, seed, and industrial categories in 2015/16 is projected slightly higher than this month s lower forecast for 2014/15. Exports for 2015/16 are projected 75 million bushels higher on the year with the 2014/15 projection raised 25 million bushels this month. More competitive prices and growth in world demand support gains in U.S. exports for 2015/16, but large foreign supplies limit growth in the U.S. share of global trade. Corn ending stocks for 2015/16 are projected at 1.7 billion bushels, down 105 million from the 2014/15 projection. The season-average 2015/16 farm price is projected at $3.20 to $3.80 per bushel, down 15 cents at the midpoint from this month s lowered outlook for 2014/15. Forward pricing the 2015 crop have been at substantially lower levels than similar bids offered for the 2014 crop. SOYBEANS: U.S. oilseed production for 2015/16 is projected at million tons, down 2.6 percent from 2014/15 mainly on lower soybean production. Soybean production is projected at 3,850 million bushels, down 119 million from the 2014 crop with record harvested area more than offset by lower yields. Harvested area is projected at 83.7 million acres based on a 5-year average harvested-to planted ratio and planted area of 84.6 million acres. The soybean yield is projected at a trend level of 46.0 bushels per acre, down 1.8 bushels from last year s record. Supplies are projected at 4,230million bushels, up 3.4 percent from 2014/15 with increased beginning stocks more than offsetting lower production. The U.S. soybean crush for 2015/16 is projected at 1,825 billion bushels, up 20 million from 2014/15. U.S. soybean meal use is projected to increase 3.2 percent in line with expected gains in U.S. meat production. Despite lower prices, soybean meal exports are projected to decline with increased exports from South America and India accounting for most of the gains in global soybean meal trade. Soybean exports are projected at 1,775 million bushels, down 25 million from 2014/15 despite record supplies. Competition from 4
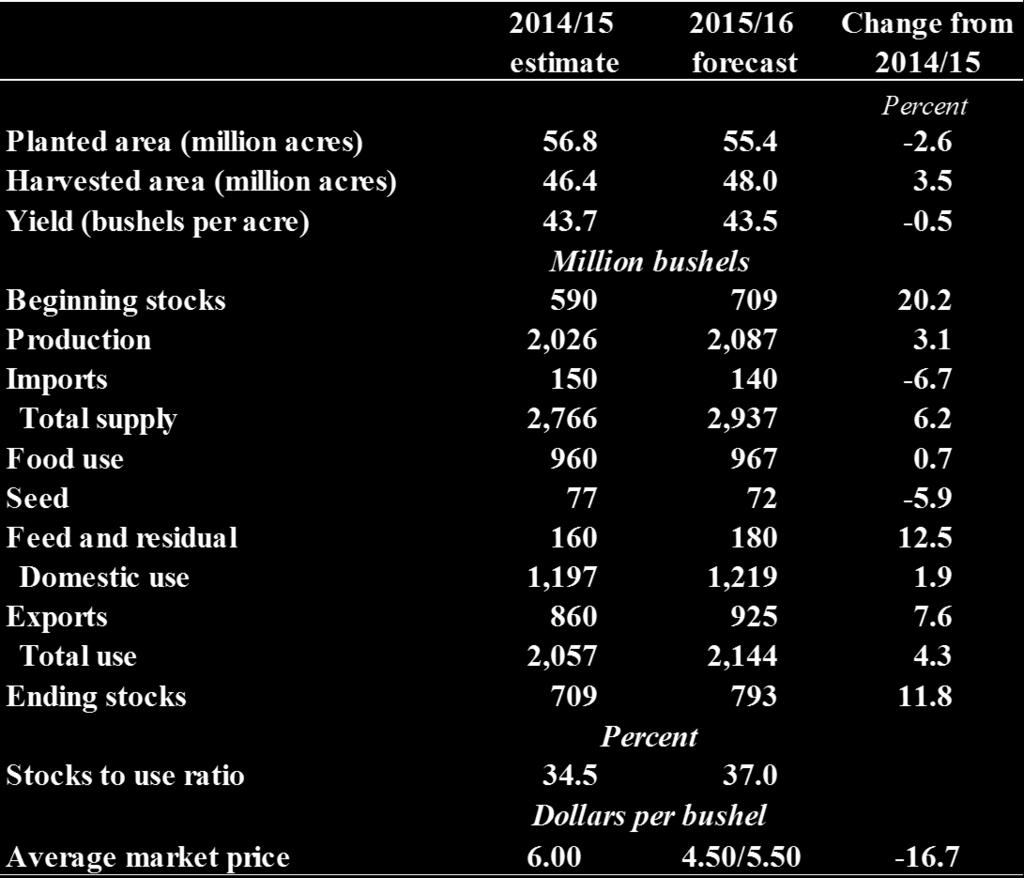
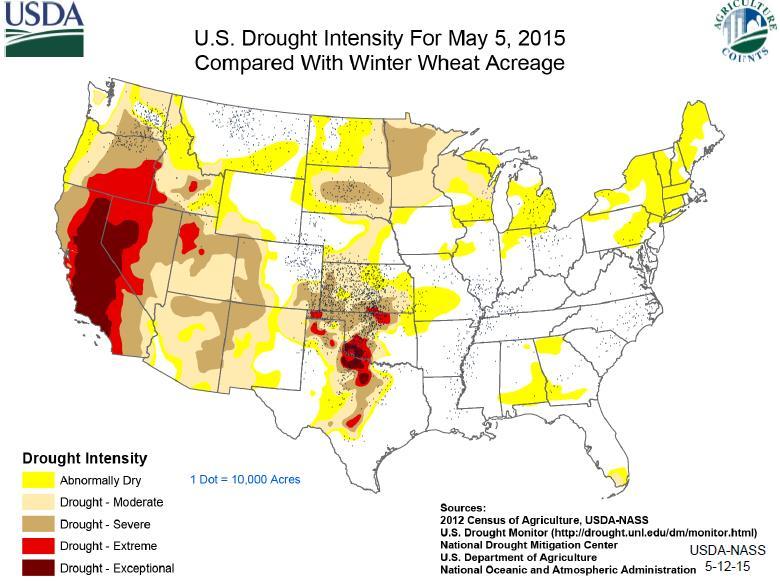
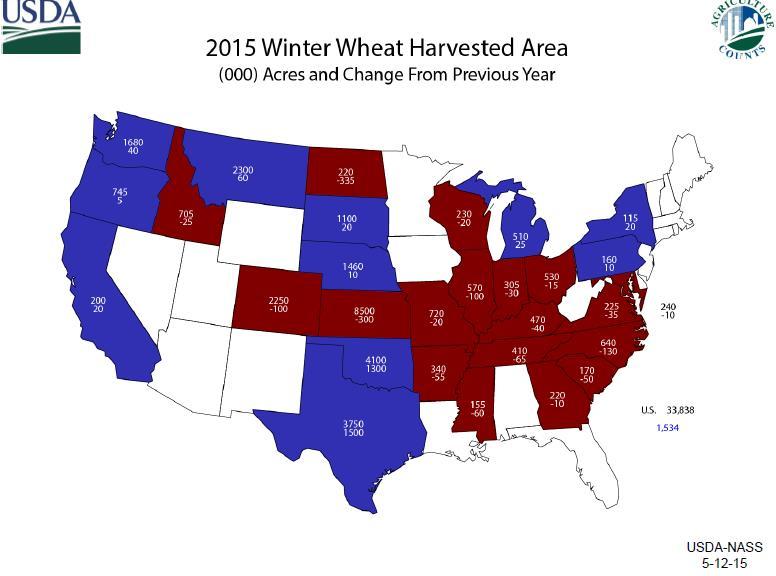
5 record supplies in South America is expected to limit U.S. exports during the first half of the 2015/16 marketing year. With larger supplies and lower use, U.S. ending stocks for 2015/16 are projected at 500 million bushels, up 150 million from 2014/15. The U.S. season-average soybean price for 2015/16 will decline to $8.25 to $9.75 per bushel compared with $10.05 in 2014/15. Soybean meal prices are forecast at $305 to $345 per short ton compared with $365 in 2014/15. Soybean oil prices are forecast at 29.5 to 32.5 cents per pound compared with 32.0 cents in 2014/15. WHEAT: U.S. wheat supplies for 2015/16 are projected up 6 percent from 2014/15 on higher beginning stocks and production. All wheat production is projected at 2,087 million bushels, up 3 percent. The all wheat yield is projected at 43.5 bushels per acre, down slightly from the previous year. The survey-based forecast for 2015/16 all winter wheat production is up 7 percent with both higher yields and harvested area. A decline in Soft Red Winter wheat harvested area is more than offset by increased Hard Red Winter (HRW) wheat harvested area. This year s HRW yield is above last year s low level, but drought and winterkill have adversely affected the crop again. White Winter wheat production is projected up 10 percent from last year mainly on higher yields. Spring wheat production for 2015/16 is projected to decline 5 percent on an assumed return to trend yields from last year s near record level, more than offsetting a slight increase in harvested area. Total U.S. wheat use for 2015/16 is projected up 4 percent from the previous year on higher exports, feed and residual use, and food use. The 2015/16 exports are projected at 925 million bushels, up 65 million bushels from the previous year s low level but still below the 5 yearaverage. Large supplies in several major competing countries will continue to limit U.S. exports. Feed and residual use is projected up 20 million bushels on increased supplies. U.S. ending stocks are projected to rise 84 million bushels to 793 million, the highest since the 2010/11 crop year. The all wheat season-average farm price is projected at $4.50 to $5.50 per bushel. 5
6 6
7 7
8 8
9 Here are the World Estimates from the May WASDE Report: USDA May 2015 World WASDE Production in millions of metric tons (released May 12, 2015) Crop USDA May Estimate USDA April Estimate USDA May Estimate Argentina Wheat Australia Wheat China Wheat India Wheat FSU Wheat E-U Wheat Argentina Corn Brazil Corn China Corn South Africa Corn Argentina Soybeans Brazil Soybeans CORN: Global coarse grain supplies for 2015/16 are projected at a record 1,505.1 million tons, up 9.6 million tons from 2014/15 with the increase mainly reflecting larger corn beginning stocks and production for China. Global corn production for 2015/16 is projected at million tons, down from the 2014/15 record, largely reflecting the smaller projected U.S. 9
10 crop. Declines in 2015/16 corn production are also expected for EU, Brazil, Ukraine, and Mexico. In addition to China, where corn production is projected up 12.3 million tons, corn production is expected higher for South Africa, India, Canada, Russia, and Argentina. Global corn consumption for 2015/16 is projected at a record million tons, 13.0 million tons higher than in 2014/15, with notable increases for China, Brazil, Saudi Arabia, Argentina, Egypt, Canada, India, Indonesia, Iran, and Mexico. Corn imports for 2015/16 are projected higher year-to-year for EU, Saudi Arabia, Egypt, South Korea, and Mexico. Corn exports are lowered for Ukraine, Brazil, and EU, but raised for South Africa, Argentina, and India compared with 2014/15. Global corn ending stocks for 2015/16 are projected at million tons, down 0.6 million from 2014/15. SOYBEANS: Global oilseed production for 2015/16 is projected at million tons, slightly below 2014/15. Global soybean production is projected at million tons, almost unchanged from 2014/15 with gains for Brazil, India, Paraguay, and Ukraine offset by reductions for the United States, Argentina, and China. The Argentina soybean crop is projected at 57.0 million tons, down 1.5 million from 2014/15 with higher area but lower yields. The Brazil soybean crop is projected at a record 97.0 million tons, up 2.5 million on higher area. China soybean production is projected at 11.5 million tons, down 0.85 million as producers shift to more profitable crops. Total oilseed supplies are up 2.8 percent from 2014/15. With crush projected to increase 2.3 percent, global oilseed ending stocks are projected at million tons, up 8.3 million from the revised 2014/15 stock estimate. Global protein meal consumption is projected to increase 3.4 percent in 2015/16. Protein meal consumption is projected to increase 3.0 percent in China, accounting for 24 percent of global protein consumption gains. Global soybean exports are projected at 122 million tons, up 3.8 percent from 2014/15. China soybean imports are projected at 77.5 million tons, up 4 million from the revised 2014/15 projection. Global vegetable oil consumption is projected to increase 3.6 percent in 2015/16 led by increases for China, India, and Indonesia. WHEAT: Global wheat supplies are projected to rise fractionally from 2014/15 as increased beginning stocks more than offset a slight decline in production from the previous year s record. Total wheat production is projected at million tons, the second highest total on record. Foreign production is down 9.2 million tons with reductions for EU, India, Russia, and Ukraine more than offsetting increases for China, 10
11 Turkey, Morocco, Australia, Iran, and Syria. Global wheat consumption for 2015/16 is projected slightly higher than in 2014/15 with higher food use more than offsetting a reduction in world wheat feeding. Global import demand for 2015/16 is lower with the largest reductions coming from Turkey, Iran, Morocco, and Syria all on greatly improved crop prospects. Exports are lower for Canada, India, EU, Russia, and Ukraine, but higher for Argentina and Australia. Global ending stocks for 2014/15 are projected at million tons, up 2.4 million from 2014/15. To see the full USDA March 2015 WASDE report go to: After the reports we spoke with Wayne Nelson of L and M Commodities in New Market Indiana about the numbers. (This link is now LIVE!) From the USDA Secretary lock up briefing begins on next page! 11
12 Area (Mha) and Output (MMT) Yield (T/Ha) Russia Wheat: Estimated Area, Yield, and Production Harvested area Output Yield 12

13 13
14 14
15 15
16 16
17 17
18 18
19 19
20 20
21 21
22 22
23 23
24 24
25 25

26 AM-580 Daily Agricultural Programming Schedule Monday Friday (all times central) 8:49 a.m. $*Opening Commodity Market Report 8:52 a.m. - $Drew Lerner Agricultural Weather 9:49 a.m. $*Mid-Morning Commodity Market Report 10:59 a.m. Commodity Market Price Update 11:59 a.m. Commodity Market Price Update 12:58:30 p.m. *Midday Market Analysis with Sue Martin 2:06-2:36 p.m. $*Closing Market Report o o 2:11 Futures Analysis 2:20 - Agricultural News 26
27 o o 2:25 - Cash Grain Analysis or Energy Analysis 2:32 Agricultural Weather Analysis Friday 2:36 p.m. 3:00 p.m. $*Commodity Week Saturday 6:30 a.m. - $* Commodity Week * Available on the website for on demand listening $ Available via podcast 27