Financial Characteristics of North Dakota Farms
|
|
|
- Emery Cannon
- 5 years ago
- Views:
Transcription
1 Agribusiness & Applied Economics Report No. 756 September 2016 Financial Characteristics of North Dakota Farms Andrew L. Swenson Department of Agribusiness and Applied Economics Agricultural Experiment Station North Dakota State University Fargo, ND
2 Contact Information The author extends appreciation to Tim Petry and Richard Taylor for their constructive comments and suggestions. North Dakota State University does not discriminate on the basis of age, color, disability, gender expression/identity, genetic information, marital status, national origin, public assistance status, race, religion, sex, sexual orientation, or status as a U.S. veteran. This publication is available electronically at this web site: Please address your inquiries regarding this publication to: Department of Agribusiness & Applied Economics, P.O. Box 6050, Fargo, ND , Phone: , Fax: , ndsu.agribusiness@ndsu.edu. NDSU is an equal opportunity institution. NOTICE: The analyses and views reported in this paper are those of the author(s). They are not necessarily endorsed by the Department of Agribusiness and Applied Economics or by North Dakota State University. Copyright 2016 by Swenson. All rights reserved. Readers may make verbatim copies of this document for non-commercial purposes by any means, provided that this copyright notice appears on all such copies.
3 Table of Contents List of Tables... ii List of Figures... iii Abstract... iv Introduction... 1 Source of Data... 1 Interpretation of Results... 2 Farm Classifications and Highlights... 4 All Farms... 4 Region... 6 Farm Enterprise... 7 Farm Sales... 9 Farm Size Cropland Tenure Net Farm Income Debt-to-Asset Ratio Farmer Age Appendix: Definition of Financial Measures References i
4 List of Tables Table 1. Table 2. Table 3. Table 4. Median farm size, farm operator age, and financial factors of farms participating in the North Dakota Farm Business Management Education Program, Farm classifications and percent distribution of farm types within regions, North Dakota Farm Business Management Education Program,... 5 Current assets and current liabilities, quartile values for, median values for 2014, and 5-year average, , of median values, North Dakota Farm Business Management Education Program participants Liquidity measures, quartile values for, median values for 2014, and 5-year average, , of median values, North Dakota Farm Business Management Education Program participants Table 5. Total assets and total liabilities, quartile values for, median values for 2014 and 5-year average, , of median values, North Dakota Farm Business Management Education Program participants Table 6. Table 7. Table 8. Solvency measures, quartile values for, median values for 2014, and 5-year average, , of median values, North Dakota Farm Business Management Education Program participants Rate of return on assets and rate of return on equity profitability measures, quartile values for, median values for 2014, and 5-year average, , of median values, North Dakota Farm Business Management Education Program participants Operating profit margin and net farm income profitability measures, quartile values for, median values for 2014, and 5-year average, , of median values, North Dakota Farm Business Management Education Program participants Table 9. Repayment capacity measures, quartile values for, median values for 2014, and 5-year average, , of median values, North Dakota Farm Business Management Education Program participants Table 10. Asset turnover, and operating expense and depreciation expense efficiency measures (as a percentage of gross farm income), quartile values for, median values for 2014, and 5-year average, , of median values, North Dakota Farm Business Management Education Program participants Table 11. Interest expense and farm income efficiency measures (as a percentage of gross farm income), quartile values for, median values for 2014, and 5-year average, , of median values, North Dakota Farm Business Management Education Program participants ii
5 List of Figures Figure 1. Median total farm assets and liabilities by farm type,, N.D. Farm Mgt. Program... 8 Figure 2. Median net farm income by farm type, 2006-, N.D. Farm Mgt. Program... 8 Figure 3. Median rate of return on assets by farm type, 2006-, N.D. Farm Mgt. Program... 8 Figure 4. Median asset turnover ratio by farm type, 2006-, N.D. Farm Mgt. Program... 8 Figure 5. Median total farm assets and liabilities by farm sales,, N.D. Farm Mgt. Program Figure 6. Median net farm income by farm sales, 2006-, N.D. Farm Mgt. Program Figure 7. Median term debt coverage ratio by farm sales, 2006-, N.D. Farm Mgt. Program Figure 8. Median interest expense as a percent of gross revenue, by farm sales, 2006-, N.D. Farm Mgt. Program Figure 9. Median net farm income by crop land tenure, 2006-, N.D. Farm Mgt. Program Figure 10. Median asset turnover ratio by crop land tenure, 2006-, N.D. Farm Mgt. Program Figure 11. Median net farm income by debt-to-asset group, 2006-, N.D. Farm Mgt. Program Figure 12. Median net farm income as a percent of gross revenue by debt-to-asset group, 2006-, N.D. Farm Mgt. Program Figure 13. Median total farm assets and liabilities by farmer age,, N.D. Farm Mgt. Program Figure 14. Median net farm income by farmer age, 2006-, N.D. Farm Mgt. Program Figure 15. Median term debt coverage ratio by farmer age, 2006-, N.D. Farm Mgt. Program Figure 16. Median net farm income as a percent of gross revenue, by farmer age, 2006-, N.D. Farm Mgt. Program iii
6 Abstract The performance of over 500 North Dakota farms, 2006-, is summarized using 16 financial measures. Farms are categorized by geographic region, farm type, farm size, gross cash sales, farm tenure, net farm income, debt-to-asset, and age of farmer to analyze relationships between financial performance and farm characteristics. Five-year averages, , are also presented. In, median and average acreage per farm was 1,847 and 2,371, respectively. Median and average cash farm revenue was $499,756 and $687,287, respectively. Over 70% of farms were crop farms and 50 percent of farms had gross sales exceeding $500,000. Median age of farm operators was 48. Median net farm income in declined to $18,982, the lowest since 1997, from $54,543 in The 10 year high was $238,054 in Financial measures for 2012, 2011, 2010, 2008 and 2007 were much superior to those in other years for the period. The Red River Valley and crop farms typically had stronger profitability, solvency, and repayment capacity than other regions and farm types, respectively, but not in 2013 and Median net farm income of livestock farms decreased to $18,999 in from a ten year high of $95,130 in Median term debt coverage ratio was 0.69 in compared to a average of Farms with sales less than $500,000 were nearly twice as likely to have debt-to-asset higher than 70 percent as farms with sales greater than $500,000. Farms that own some crop land, but less than 40 percent of the land they operate were more likely to be crop farms, farm more acreage, have larger sales, and be more profitable. As expected, solvency and percent of crop land owned increased with farmer age. Median net farm income as a percent of gross revenue was the lowest in the decade in, at 5.1%, and the highest in 2012, at 36.8%. Keywords: Farm financial management, farm management, farm income, liquidity, solvency, profitability, repayment capacity, financial efficiency, financial benchmarks, tenure, North Dakota. iv
7 Introduction Financial statements such as the balance sheet and income statement provide a structured format to summarize financial information so it is more manageable for decision making. It is helpful to further simplify or summarize information contained in financial statements into key measures of financial performance. However, the calculation of a financial measure can be fruitless unless there is a meaningful basis of comparison to evaluate the number. Two methods of comparison are: 1. Past performance. The progress of a business can be monitored by constructing financial measures on a periodic basis and comparing present to past performance. 2. Industry benchmarks. The average or median of a financial measure from several similar businesses provides a good point of reference. There are statewide farm record programs in some states, including North Dakota. Each farm has its own unique aspects, so the most appropriate comparison would be farms that have similar enterprises and resources. Whatever method of comparison is used, it is imperative that the procedures for construction of financial statements and performance measures are consistent over time and between farms to ensure an "apples-toapples" comparison. The Farm Financial Standards Task Force (FFSTF), which was formed by the American Bankers Association in 1989, has provided recommendations of standards for financial statement construction and the calculation measures of financial performance. Sixteen of these measures are the basis for the benchmarks presented in this publication. The Appendix has an explanation of the financial measures used in this study. The purpose of this study is to provide information to producers, lenders, educators, and others on the financial performance of a sample of North Dakota farms. Table 1 lists the median operator age, farm size and selected financial factors, The data are from financial summaries of farms participating in the North Dakota Farm Business Management Education program. In this study, the median and upper and lower quartiles of 16 financial performance measures are presented for all farms in the data set and for groupings of farms by characteristic such as farm type, farm size, and age of producer. The results can be used by producers and lenders to evaluate the financial performance of a farm. Also, trends can be identified and relationships between farm characteristics and financial measures can be analyzed. However because of the small number of farms in this study, the results should be used cautiously and only be considered guidelines. Source of Data About 700 farms are enrolled in the North Dakota Farm Business Management Education program. Instructors educate and assist producers in record keeping and review data for completeness and accuracy. Instructors use the Finpack farm financial management software program to generate financial summaries. From 2006-, the financial summaries of over 500 farms each year were considered usable for this study. About 85 percent of the total farms repeat from one year to the next. Annual turnover occurs from changes in farm management program enrollment and the level of farms completing their records by a cutoff date. The farms in this study are larger and the age of the farm operators younger than the state average. In, there were 30,000 farms in North Dakota with agricultural production of at least $1,000. Only 8,200, or 27%, had gross receipts greater than $500,000, whereas 50% of the 525 farms in for this study exceed that sales volume (median gross sales was $499,756). The farms in the study are more representative of operations that provide the primary source of net family income. The average age of farm operators in this study is 46 compared to 57 for the state average. 1
8 Interpretation of Results Each financial measure was calculated for each farm. Refer to the Appendix for definitions of the financial measures and an explanation of asset valuation and accrual adjustments. Farms were grouped by characteristics such as region, type of farm, and size and were sorted in order from strongest to weakest by each of the 16 financial measures. The median is the midpoint value of the financial measure: one-half of the farms in the category had a higher value and one-half had a lower value than the median. The upper quartile is the value that was exceeded by one-fourth of the farms, and the lower quartile is the value that was exceeded by three-fourths of the farms. (Another definition of lower quartile is the value for which one-quarter of the farms in the category had a weaker value.) Individual farm operators and lenders can use this study for benchmarks of comparison if their financial measures are calculated similarly. For example, a farm operator 30 years of age may compare his/her profitability and financial efficiency with those of other young operators. Or, a lender may compare the solvency and repayment capacity of producers who rent all their crop land. This study also can be used to look at relationships and trends. What is the relationship between age of farmer and rate of return on equity? How has operating profit margin of livestock farms changed over time? One ratio is not sufficient to make conclusions about the overall financial performance of a farm business. For example, a crop farm may have a debt-to-asset ratio of 50%, which is worse than the median value of 45.2% (shown on table 6) for the crop farm enterprise category. However, other factors such as profitability, total assets, and age of operator should also be considered. Also, a farm can be adversely affected by extraordinary circumstances. Profitability in the low quartile may not be reflective of management capability if the farm had localized bad weather that was not experienced by many other producers in the farm category. Caution must be used when analyzing the tables because a small number of farms increases the possibility that results may not be representative of a farm category. In this study for, there are only 49 farms with $200,000 or greater net farm income and 49 farms with net farm income of $100,000 to $200,000. There were 62 mixed livestock-crop enterprise farms, 79 farms in the west region, 79 farms with net farm income of $100,000 to $200,000, and 85 farms with operators 40 to 50 years of age. Performance of the Red River Valley region may not be representative of the central or northern areas of the Red River Valley because nearly all valley farms in the study are from the south. Also, there was a lack of farms in the northern portion of the west region. Lastly, the livestock farm type is dominated by the beef cow-calf enterprise. There are some strong correlations between two or more classifications, so it is difficult to associate a financial measure with an individual farm characteristic. For example, the profitability of livestock, in comparison to crop farming, is reflected in farm categories that had a disproportionate number of livestock farms, such as the west region, farms with less than $250,000 sales, and farms with greater than 70% debt-to-asset. Also, comparison of farms by enterprise type, farm size and gross sales can be affected by regional performance. The Red River Valley has the highest proportion, relative to other regions, of crop farms, farms of less than 2,000 acres, and farms with gross income greater than $500,000. Table 1 shows the 10-year trends in financial performance and farm characteristics. Table 2 lists the farm characteristics and percentage distribution for and the breakout of these characteristics by region of North Dakota. Tables 3 through 11 display the median and quartiles of 16 financial measures by farm characteristics. Figures 1 through 16 display relationships between selected farm characteristics and financial measures. A summary of highlights by farm characteristics is also presented. 2
9 TABLE 1. MEDIAN FARM SIZE, FARM OPERATOR AGE, AND FINANCIAL FACTORS OF FARMS PARTICIPATING IN THE NORTH DAKOTA FARM BUSINESS MANAGEMENT EDUCATION PROGRAM, Number of Farms Median Age of Operator Farm Size (acres) 1,847 1,847 1,865 1,932 1,968 2,010 1,995 2,001 2,000 1,966 Gross Cash Revenue 499, , , , , , , , , ,751 Total Farm Assets 1,482,932 1,614,430 1,497,426 1,463,890 1,171,781 1,124,263 1,019, , , ,802 Total Farm Liabilities 603, , , , , , , , , ,102 Current Ratio Working Capital 61, , , , , ,933 72, , ,063 20,660 Debt-to-Asset (%) Rate of Return on Farm Assets (%) Rate of Return on Farm Equity (%) Operating Profit Margin (%) Net Farm Income 18,982 54,543 90, , , ,010 47, , ,791 35,980 Term Debt Coverage Ratio Term Debt & Capital Repayment Margin ($) -16,382 3,556 25, ,291 90, ,428 6,360 67,276 86,825 5,378 Asset Turnover Ratio Operating Expense Ratio (%) Depreciation Expense Ratio (%) Interest Expense Ratio (%) Net Farm Income Ratio (%)
10 FARM CLASSIFICATION AND HIGHLIGHTS ALL FARMS Highlights Over the past ten years, 2006-, median acreage of farms enrolled in the North Dakota Farm Business Management Education Program has been relatively stable, but farms have become larger as measured by median gross revenue which has nearly doubled, and by median farm assets and liabilities, which increased 115% and 73%, to $1,482,932 and $603,538, respectively. There was a significant decline in financial performance the past three years, 2013-, despite record wheat yields and beef prices, because of sharply lower grain prices. North Dakota corn prices declined one-half, soybeans by 40% and wheat by 44% over this three year period. Median net farm income dropped to $18,982 in compared to $54,543, $92,629 and $238,054 in 2014, 2013 and 2012, respectively. During the 2006 to period, nearly all financial measures were the strongest in In 2012, record crop prices more than offset an increase of costs and there were surprisingly strong yields because stored soil moisture from a wet 2011 sustained crops over the dry summer. In 2011, below average yields and high costs were offset by high grain prices. Crop insurance indemnities were profitable on the nearly one-fourth of cropland prevented from planting because of strong prices used for insurance. In 2010, corn and sugar beets were record yields and barley, canola, and spring wheat were second highest in history. Grain prices increased to very high levels and costs were flat to down. Federal disaster payments for the 2008 crop year were paid in In 2009, lower crop prices, high costs and low livestock profit resulted in sharply lower financial performance despite record yields for spring wheat, durum, barley, canola, and field peas. Financial performance in 2007 and 2008 was outstanding because of high crop prices. In 2006 there was a severe drought in the west and portions of central North Dakota. Median current ratio dropped to 1.3 in, the lowest since 1.2 in It was highest, 2.3, in 2012, 2.0 in 2011, 1.9 in 2013 and 2010, 1.8 in 2008, 1.7 in 2007 and 1.6 in Median debtto-asset was 46.5% in, 44.7% in 2014 and 41.8% in 2013 compared to 40.6% in 2012, and 43.7% in It was 51.2% in 2009, 48.4% in 2008, 50% in 2007, and 57.5% in 2006 which was the worst during the past 10 years. In, median rates of return on assets and equity were the lowest in the past ten years at 0.4% and -1.6%, respectively, compared to 16.2% and 24.8%, respectively, in ROE was less than ROA, which indicated that debt capital was not employed profitably, in 2005, 2006, 2009, 2014, and. The median term debt coverage ratio, 0.69, and term debt and capital repayment margin, -$16,382, of were ten-year lows, down from the highs in 2012, of 4.6 and $185,291, respectively. Interest expense as a percent of gross revenue was 4.3% in compared to 3.5% in 2013 and It was 2.8% in 2012 after a general improvement since 2006 because of lower interest rates and stronger gross revenue. 4
11 Median net farm income as a percent of gross revenue was the lowest of the ten-year period, 5.1% in compared to the highest 36.8% in Also, the financial efficiency measures of asset turnover, operating expense as a percent of gross revenue, and depreciation expense as percent of gross revenue were the worst in ten years. Table 2. Farm Classifications and Percent Distribution of Farm Types within Regions, North Dakota Farm Business Management Education Program,. Farm Group Category Breakout by Region Farm Category Group Number of Farms (525) Percentage Red River Valley North Central South Central West Region Red River Valley North Central South Central West Farm Enterprise percentage Crop Livestock Mixed Farm Sales $249,999 or less $250,000 - $499, $500,000 - $999, $1,000,000 or more Farm Size 1,999 acres or less ,000 acres or more Cropland Tenure Full tenant percent owned percent owned percent or more owned Farm Income $49,999 or less $50,000 - $99, $100,000 - $199, $200,000 or more Debt-to-asset Ratio 0 40 percent percent percent or more Farmer Age 39 years or younger years years or older
12 Region Farms are classified in one of four geographic regions in North Dakota, based on the location of their Farm Business Management program. However, farms enrolled in the Bismarck program are classified as "west or "south central" according to which side of the Missouri River the farm is located. Also, some farms that are enrolled in the Fargo and Wahpeton programs are not in the Red River Valley and are classified as south-central. The southern area of the "west" region is better represented than the northern area. The northern area of the Red River Valley has little representation. Locations of North Dakota Farm Business Management programs that participated in the summaries are: Highlights Red River Valley: Wahpeton, Fargo, and Northwood North Central: Bottineau, Devils Lake, Langdon, Minot, and Rugby South Central: Bismarck, Carrington, Jamestown, and Oakes West: Bismarck, Dickinson, and Glen Ullin In the median farm size increased from the Red River Valley (1,280 acres, all crop land) to the west region (2,859 acres, including pasture). Median farm size was 2,136 acres (1,872 crop acres) in the north central region and 1,902 acres (1,351 crop acres) for the south central region. The average size was larger: the Red River Valley, north central, south central and west regions were, 1,435, 2,273, 2,769, and 3,159 acres per farm, respectively. Several farm characteristics are strongly related to region. Red River Valley farms are more likely to be crop farms and typically have smaller total acreage (crop land and pasture) but larger total farm sales, assets, and liabilities than farms in other regions. Typically the Red River Valley has the best financial performance, but not in 2013 or 2014 because profit of its dominant enterprises, soybeans, corn and sugarbeets suffered. In, the incidence of livestock and mixed enterprise farms ranged from only 4% in the Red River Valley to 66% in the west. The median net farm income in 2012 was the highest in the decade for all regions and 2014 was the only year it was higher in the west than other regions. From 2012 to it decreased 92% to $32,675 in the Red River Valley, 94% to $12,166 in the north central region, 92% to $18,228 in the south central region, and 84% to $17,154 in the west. In 2006, the west region had the lowest median net farm income, $689, of any region over the past 10 years. The west had drought in 2006 and 2008 and livestock profit was low in In the median current ratio was 1.5 in the Red River Valley, 1.3 in the south central and west regions and 1.2 in the north central region. The five year average, , median current ratio by region ranged from 1.7 in the west region to 2.4 in the Red River Valley. In 2012, median debt-to-asset for all regions were the best over the 2006 to period, ranging from 34.9% in the Red River Valley to 50.5% in the west. In it was 39.7% in the Red River Valley, 44.0% in the south central region, 50.9% in the north central region, and 58.6% in the west. In, the median term debt coverage ratio decreased in all regions except the Red River Valley, at It was 0.73 in the south central, 0.69 in the west and 0.55 in the north central region. 6
13 The only year in which all regions had median operating expense (all expenses except depreciation and interest) as a percent of gross revenue greater than 75% was, ranging from 76.4% in the west to 81% in the central regions. The only years any regions achieved less than 60% in the past 10 years were in 2012, 2010 and Farm Enterprise Farms were classified as crop if 70% or more of total sales were from crops, and livestock if livestock sales accounted for 70% or more of total sales. The remaining farms were classified as mixed. The livestock farm type is dominated by the beef cow-calf enterprise. Highlights From 2007 to, about 70 to 75% of all farms were classified as crop, compared to about 64% from 2002 to In, 66% of farms were classified as livestock or mixed enterprise in the west region compared to 4% in the Red River Valley, 25% in the north central and 37% in the south central regions. The best performance, by farm type, for nearly every financial measure over the period was achieved by crop farms in Livestock farms had their best financial performance relative to other farm types in Every year, 2006-, crop farms were larger than livestock and mixed enterprise farms in median total assets, total liabilities, and gross income. The only year in which median net farm income of both livestock and mixed enterprise farms exceeded that of crop farms was In, median net farm income decreased 80% to $18,999 for livestock farms, 36% to $20,748 for crop farms and 84% to $10,057 for mixed enterprise farms. In, the only farm type with a positive median rate of return on equity was livestock farms at 1.0%. It was historically high for livestock farms, 22.8% in In 2014, the median asset turnover ratio was 0.34 for all farm types. However, typically it is higher for crop farms. In it was 0.34 for crop farms, 0.27 for mixed enterprise farms, and 0.22 for livestock farms (predominantly beef cow-calf farms). In, crop farms had a median term debt coverage ratio of 0.65, compared to 5.60 in It was 1.09 for livestock farms, and 0.48 for mixed enterprise farms. The five year average, , was 2.95 for crop farms, 2.45 for livestock farms, and 2.15 for mixed enterprise farms. In, median interest expense as a percent of gross revenue was 3.8% for crop farms, 5.8% for livestock farms and 5.9% for mixed enterprise farms. Each farm type had its best measure in Typically, 2006-, crop farms had a lower interest expense ratio than other farm types. Over the past ten years, the best performance in converting gross income into net income was 39.5% by crop farms in 2012 and 38.4% by livestock farms in Crop farms had their ten year low, 4.7% in compared to 15.5% for livestock farms. 7
14 8
15 Farm Sales Farms were classified in one of four cash farm sales categories. Farm sales include cash receipts from crop and livestock sales, government payments, and other farm income. The categories were: less than $249,000 $250,000 to $499,999 $500,000 to 999,999 $1,000,000 or more Highlights Median and average cash farm sales in were $499,756 and $687,287, respectively, down from $531,374 and $734,233, respectively, in In, 50% of farms had sales greater than $500,000. Gross sales are correlated to region and farm type. In, 59% of Red River Valley farms had sales in excess of $500,000, compared to 35% in the west region. Also, 59% of crop farms had sales greater than $500,000 compared to 20% of livestock farms. Young farmers typically have lower sales than older farmers, but farmers between the ages of 40 and 49 have usually been more likely to have farm sales greater than $500,000 than farmers 50 years and older. In, farms with less than $500,000 sales were more likely to rent all cropland than farms with larger sales. The typical strong direct relationship between the level of gross sales and financial performance weakened in 2014 because crop farms were much less profitable than livestock farms despite being over twice as likely to have sales greater than $500,000. In, median net farm income decreased 71%, to $10,627 for farms with less than $250,000 sales. Livestock farms which are much more likely to have less than $250,000 sales than crop farms had a large drop from strong 2014 profit. Median net farm income was $20,537, down 60%, for farms with sales $250,000 to $499,999, and down about 50% for farms with sales $500,000 to $999,999, to $32,111, and for farms with sales greater than $1,000,000, to $58,329. Farms with low sales typically have worse solvency. The median debt-to-asset was 59.5%, 45.7%, 44.1%, and 40.9% for the lowest to highest farm sale groups, respectively, in. Typically, repayment capacity is directly related to amount of sales. However, in 2013, 2014 and the opposite occurred. In, the medium term debt coverage ratio was 1.0 for farms with less than $250,000 sales and 0.72 for farms with greater than $1,000,000 sales. Farms with greater sales typically use a smaller portion of gross revenue for interest expense. The five year average, median interest expense as a percent of gross revenue was 4.7%, 3.7%, 3.4%, and 2.7% for the lowest to highest farm sale categories, respectively. In it was 5.3%, 4.7%, 4.2%, and 3.6% for the lowest to highest farm sales categories, respectively. Typical median rates of return on equity and assets are directly related to sales, however, there was an indirect relation in 2014 and a weak relationship in. 9
16 10
17 Farm Size Both crop and pasture acres were included in determining farm size. Farm size categories were: 1,999 acres or less 2,000 acres or more Highlights Because of little pasture land and more productive and expensive crop land, only about one-fifth of the Red River Valley farms were larger than 2,000 acres, compared to two-thirds of west region farms and about one-half of farms in the central regions. From 2006 to, mixed enterprise farms have typically been more likely to be larger than 2,000 acres than were crop or livestock farms. In, 61% of mixed enterprise farms were larger than 2,000 acres compared to 46% of crop farms and 39% of livestock farms. In 2006 through, less than one-third of farmers under 40 years old operated more than 2,000 acres compared to about 60% of farmers between 40 and 49 years old and over one-half of farmers 50 years or older. As expected, farms with greater than 2,000 acres have greater assets, liabilities, sales and profitability than smaller farms. Larger farms also have better solvency. In, median debt-toasset was 50.2% for farms less than 2,000 acres and 45.6% for larger sized farms. In, median net farm income decreased 58%, to $17,246 for farms with less than 2,000 acres and 67%, to $31,278 for farms with more than 2,000 acres. Historically, farms with more than 2,000 acres have over twice the net farm income of the small farm group. The five-year average, , median net farm income was $93,449 for farms less than 2,000 acres and $226,307 for farms with greater than 2,000 acres. Median current ratio in was 1.4 for farms with less than 2,000 acres and 1.3 for larger farms. The five year average, , median current ratio was 2.0 for farms with less than 2000 acres and 1.9 for farms larger than 2000 acres. From 2006 to, median term debt coverage ratio was better for farms with less than 2,000 acres than for larger farms in only three years: 2012, 2013, and. In, median operating expense (excluding depreciation and interest) as a percent of gross revenue was 79.2% for farms with less than 2,000 acres and 81.6% for farms with greater than 2,000 acres. Financial efficiency measures of farm size groups are typically similar. This indicates that greater profitability of farms larger than 2,000 acres is due to larger sales volume and/or greater operator-labor efficiencies, not lower operating expenses per dollar of sales. 11
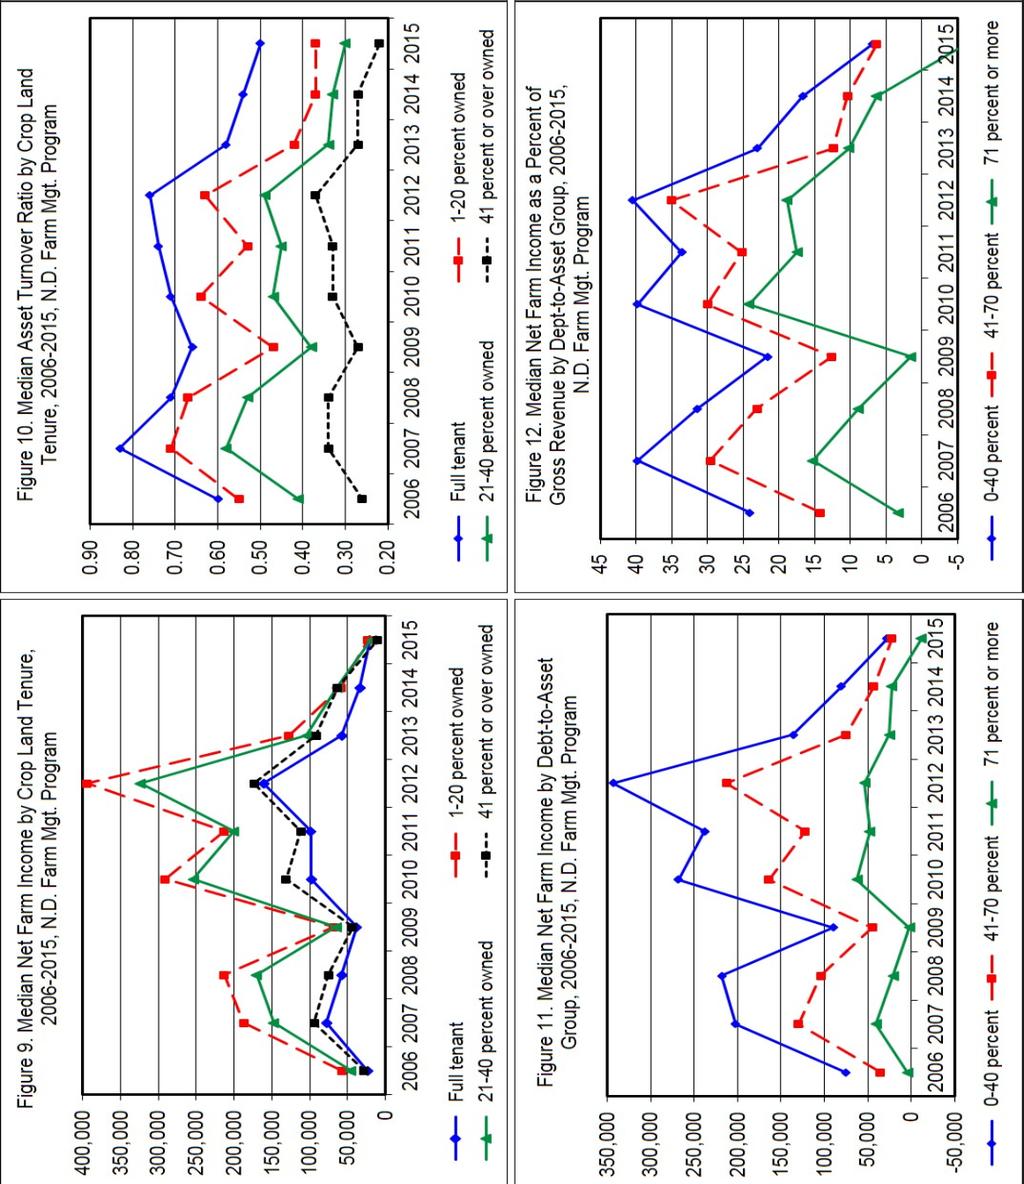
18 Cropland Tenure This is a classification of the portion of crop land that is rented. Four categories were used. Full tenant 1-20 percent owned percent owned 41 percent or over owned Highlights Substantial ownership of crop land is less likely in the Red River Valley. About one out of five Red River Valley farms owned more than 40% of the crop land they operated, compared to onethird of farms in other regions. Crop land ownership increases with age. Farmers 50 years or older were over three times more likely to own more than 40% of their crop land than young farmers. Four of ten young farmers rented all of their crop land, compared to one of ten farmers 50 years or older. Operators of livestock and mixed enterprise farms own a greater portion of their crop land than crop farms. Nearly one-half of livestock and mixed enterprise farms owned more than 40% of the crop land that they operate, compared to one-fourth of crop farms. In, small farms (less than 2,000 acres) were much more likely than large farms (more than 2,000 acres) to own no crop land. However, both farm size groups were as likely to own over 40% of their crop land. Large farms were twice as likely to own between 1 and 40% of crop land as smaller farms. Typically, farms that own some land, but less than 40%, are the most profitable, and are more likely to be crop farms, farm more acreage, and have larger sales. Farms with greater than 40% crop land ownership are typically lower profit than farms with 1 to 40% crop land ownership probably because these farms are more likely to be in the livestock and low sales farm categories and are less likely to be in the Red River Valley Region. However, in 2014 profit was high for livestock farms and low for crop and Red River Valley farms. Last year,, was the only year in the period when farms that rented all cropland had greater median net farm income, $20,739, than farms that owned more than 40% of cropland, $10,847. In the past ten years farms that owned greater than 40% of their crop land typically have a slightly higher current ratio. In, farms with greater than 40% crop land ownership had a median current ratio of 1.4 compared to 1.2 to 1.3 for the other tenure groups. Farms with greater crop land ownership typically have better solvency. In, median debt-toasset ratio was 56.2% for farms with no crop land ownership, 46.2% for farms with 1-20% crop land ownership, 44.0% for farms with 21-40% crop land ownership, and 41.3% for farms with crop land ownership greater than 40%. One reason could be that older, more established farmers own a greater portion of their crop land. Farms with a smaller proportion of crop land ownership have fewer land assets and land interest costs and therefore have substantially higher asset turnover ratios and lower interest expense as a percent of gross revenue. 12
19 13
20 Net Farm Income Four levels of net farm income were used to group farms. $49,999 or less $50,000 - $99,999 $100,000 - $199,999 $200,000 or more Highlights Farm profit is volatile. Year-to-year changes in median net farm income within regions and farm types averaged over 80% the past 10 years, except for mixed enterprise farms which averaged 68%. The largest change occurred in Statewide, median net farm income decreased 65% in, 40% in 2014, and 62% in It increased 65% in 2012, decreased 17% in 2011, increased 266% in 2010, and decreased 58% in 2009 and 10% in 2008, after increasing 255% in Median net farm income was $18,982 in down from $54,543 in 2014, and $90,529 in The five highest median net farm income years in the period were $238,054 in 2012, $174,010 in 2010, $144,414 in 2011, $127,791 in 2007, and $114,520 in It was $47,547 in 2009 and $35,980 in The Red River Valley had the highest median net farm income six out of ten years from 2006 to and the north central region was the highest in three years. The west region farms had the lowest median net farm income seven of the ten years, but the highest in Typically, crop farms have been more profitable than livestock farms. An exception was In and 2014, median net farm income was $18,999 and $95,130 for livestock farms and $20,748 and $32,347 for crop farms, respectively. The five year average, , median net farm income was $177,604 for crop farms and $57,075 for livestock farms. As expected, net farm income is strongly associated with farm sales and farm size. In, 16% of farms with sales greater than $500,000 had net farm income greater than $200,000, compared to 2% of farms with less than $500,000 sales. Farms larger than 2,000 acres were over five times more likely to have net farm income greater than $200,000 than were smaller farms. In all but five years from 2006 to, farmers 40 to 49 years old had higher median net farm income than farmers that were younger or older. The exceptions were older farmers in 2006, 2009, 2011, and 2013, and younger farmers in. Solvency, liquidity, repayment capacity, and financial efficiency were strongly correlated with net farm income. Low-debt farms (less than 40% debt-to-asset) are typically three to four times more likely to have net farm income in excess of $100,000 than high-debt farms (greater than 70% debt). 14
21 Debt-to-asset Ratio Three ranges of debt-to-asset ratio were used to group farms percent percent 71 percent or more Highlights The median debt-to-asset of all farms increased from 53.3% to 57.5% between the years 2002 to 2006 and then generally improved until 2012, to 40.6%. It has increased each year since 2012 and was 46.5% in. The median debt-to-asset of farms in the north central region was the best in 2013 and 2007 through 2009 compared to other regions. However, the Red River Valley had the best solvency in all other years during the period. Crop farms had the best solvency (lowest debt-to-asset) among farm types during the past ten years, Large farms (greater than 2,000 acres) and farms with sales greater than $500,000 always had lower median debt-to-asset than other farm size and farm sales groups, respectively, during the period. There is a strong inverse relationship between level of debt and liquidity, repayment capacity, profitability and financial efficiency measures. As debt-to-asset increases, these measures deteriorate. In, farms in the low, medium and high debt-to-asset categories had median current ratios of 2.9, 1.2 and 0.8; term debt coverage ratios of 0.98, 0.73, and 0.00; interest expense as a percent of gross revenue of 2.3, 5.7, and 7.7; and net farm income as percent of gross revenue of 6.9, 6.3, and -6.1, respectively. In, farms with sales less than $250,000 were three times more likely to be in the high debt group than farms with sales greater than $1,000,000. As expected, percent debt-to-asset tended to decrease as age of farmer increased. In, median debt-to-asset was 60.8% for farmers younger than 40 years, 51.7% for farmers years and 36.2% for farmers 50 years or older. In, median net farm income decreased to $27,883 for the low debt-to-asset category, and to $22,400 and -$11,381 for the medium and high debt-to-asset categories, respectively. In, 10% of farms with low debt had net farm income greater than $200,000, compared to 4% of high-debt farms. 15
22 Farmer Age Three groups were used to classify farms by age of operator: 39 years or less years 50 years or older Highlights In, 37% of farm operators were under 40 years old, 16% were 40 to 49 years old, and 46% were 50 and older. The age distribution of farm operators has been similar across regions during the period. In 2014 and, farmers in the west were slightly more likely to be younger than 40 years old than in other regions. Farms in the middle age group typically have more liabilities, higher gross sales, larger farms and been more profitable than the younger or older age groups. However, median net farm income was highest for farmers older than 50 years in 2006, 2009, 2011, and 2013, and for farmers less than 40 years old in. For each age group, the years 2012, 2011, 2010, 2008 and 2007 had much higher median net farm income than other years during the period. In median net farm income was the highest, $22,357, for farmers under 40 years old, and the lowest, $7,587, for farmers years old. It was $15,386 for farmers 50 years and older. Median total assets are lowest for farm operators less than 40 years old. Median total assets of farmers between 40 and 49 years old and the older age group of farmers (50 years and older) were similar in , but greater for older farmers since As expected, there is a higher percent of crop land owned, and the percent of farm debt tends to decrease as the age of the farm operator increases. In, median debt-to-asset was 60.8% for farmers less than 40 years old, 51.7% for farmers in the 40 to 49 age group and 36.2% for farmers 50 or older. From 2007 through, median current ratio improved with farmer age. However, prior to 2007 there was not a clear relationship between median current ratio and age groups. The only years in the period that farmers older than 50 years had term debt coverage ratio less than 1.0, and a ratio which was lower than the other age groups were in 2014, at 0.86, and in, at In each year, 2006-, the young age group of farmers employed assets more efficiently than farmers 50 and older. The young group had much fewer total assets and higher debt-to-asset, but achieved better median rates of return on assets and equity, and asset turnover. 16
23 17
24 18 Table 3. Current Assets and Current Liabilities, Quartile Values for, Median Values for 2014, and 5-Year Average, , of Median Values, North Dakota Farm Business Management Education Program Participants. Upper Lower Upper Lower Farm Group Quartile Quartile Median Median Medians Quartile Quartile Median Median Medians Current Farm Assets ($) Current Farm Liabilities ($) All Farms 712, , , , ,618 74, , , , ,395 Region Red River Valley 828, , , , ,644 73, , , , ,624 North Central 637, , , , ,299 72, , , , ,669 South Central 721, , , , ,964 80, , , , ,549 West 620, , , , ,602 88, , , , ,657 Farm Enterprise Crop 797, , , , ,245 97, , , , ,598 Livestock 373,458 76, , , ,845 28, ,677 86,677 72,653 63,299 Mixed 524, , , , , , , , , ,847 Farm Sales $249,999 or less 165,736 32,122 80, , ,941 23, ,136 51,494 55,739 46,816 $250,000-$499, , , , , ,715 89, , , , ,270 $500,000-$999, , , , , , , , , , ,482 $1,000,000 or more 1,751, ,146 1,167,804 1,197,413 1,162, ,018 1,163, , , ,563 Farm Size 1,999 acres or less 418,434 88, , , ,811 36, , , ,334 96,109 2,000 acres or more 1,075, , , , , , , , , ,943 Cropland Tenure Full tenant 457,046 72, , , ,535 32, , , ,792 90, percent owned 996, , , , , , , , , , percent owned 890, , , , , , , , , , percent or more owned 620, , , , ,092 75, , , , ,454 Net Farm Income $49,999 or less 548, , , , ,079 60, , , , ,092 $50,000-$99, , , , , ,108 97, , , , ,109 $100,000-$199, , , , , , , , , , ,532 $200,000 or more 1,566, ,447 1,034, , , , , , , ,037 Debt-to-Asset Ratio 0-40 percent 890, , , , ,507 43, , , , , percent 711, , , , , , , , , , percent or more 432,838 94, , , , , , , , ,050 Farmer Age 39 years or younger 400,457 82, , , ,679 50, , , , , years 726, , , , , , , , , , years or older 965, , , , , , , , , ,189
25 19 Table 4. Liquidity Measures, Quartile Values for, Median Values for 2014, and 5-Year Average, , of Median Values, North Dakota Farm Business Management Education Program Participants. Upper Lower Upper Lower Farm Group Quartile Quartile Median Median Medians Quartile Quartile Median Median Medians Current Ratio Working Capital ($) All Farms ,844-11,286 61, , ,605 Region Red River Valley ,486 20, , , ,669 North Central ,441-45,453 46, , ,212 South Central ,141-4,208 54, , ,055 West ,433-6,466 56, , ,486 Farm Enterprise Crop ,778-20,098 80, , ,514 Livestock ,515 4,764 51, ,983 64,863 Mixed ,387-8,016 39, ,964 97,455 Farm Sales $249,999 or less ,968-7,220 18,858 45,043 42,417 $250,000-$499, ,050-20,450 75, , ,837 $500,000-$999, ,111-15, , , ,016 $1,000,000 or more ,344 10, , , ,389 Farm Size 1,999 acres or less ,077-5,004 49,628 70,742 98,362 2,000 acres or more ,173-41, , , ,714 Cropland Tenure Full tenant ,553-7,439 36,030 42,953 82, percent owned ,819-40, , , , percent owned ,221-58,356 70, , , percent or more owned ,635 6,840 85, , ,461 Net Farm Income $49,999 or less ,790-30,409 29,381 28,783 27,860 $50,000-$99, ,962 55, , ,509 89,458 $100,000-$199, ,696 59, , , ,718 $200,000 or more ,046,693 63, , , ,420 Debt-to-Asset Ratio 0-40 percent ,620 90, , , , percent ,349-19,936 38,099 50, , percent or more , ,918-28,041-21,862 4,431 Farmer Age 39 years or younger ,439-8,886 32,493 52,753 74, years ,463-76,757 59, , , years or older ,029 9, , , ,464
26 20 Table 5. Total Assets and Total Liabilities, Quartile Values for, Median Values for 2014, and 5-year Average, , of Median Values, North Dakota Farm Business Management Education Program Participants. Upper Lower Upper Lower Farm Group Quartile Quartile Median Median Medians Quartile Quartile Median Median Medians Total Farm Assets ($) Total Farm Liabilities ($) All Farms 2,766, ,989 1,482,932 1,614,430 1,374, ,428 1,138, , , ,168 Region Red River Valley 3,402, ,064 1,878,818 1,808,948 1,657, ,743 1,209, , , ,271 North Central 2,369, ,910 1,391,138 1,616,725 1,308, ,763 1,058, , , ,241 South Central 3,089, ,420 1,716,992 1,652,804 1,427, ,582 1,233, , , ,304 West 2,113, ,009 1,034,238 1,439,926 1,135, ,651 1,028, , , ,794 Farm Enterprise Crop 3,050, ,368 1,837,635 1,934,268 1,661, ,957 1,243, , , ,304 Livestock 1,494, , , , , , , , , ,345 Mixed 2,059, ,710 1,405,653 1,418,200 1,134, ,659 1,005, , , ,969 Farm Sales $249,999 or less 627, , , , ,835 64, , , , ,088 $250,000-$499,999 1,451, ,082 1,111,922 1,051, , , , , , ,708 $500,000-$999,999 2,775,825 1,582,159 2,130,177 2,168,539 1,771, ,921 1,265, , , ,031 $1,000,000 or more 5,978,643 3,427,330 4,351,455 4,361,448 3,509, ,117 2,405,105 1,502,225 1,517,736 1,178,827 Farm Size 1,999 acres or less 1,609, , , , , , , , , ,228 2,000 acres or more 3,868,338 1,519,669 2,449,411 2,605,436 2,244, ,609 1,505,618 1,001,815 1,006, ,996 Cropland Tenure Full tenant 1,321, , , , , , , , , , percent owned 3,053,300 1,156,218 1,919,352 1,940,680 1,769, ,878 1,381, , , , percent owned 3,547,004 1,310,839 2,066,771 2,097,986 1,858, ,904 1,386, , , , percent or more owned 2,790, ,653 1,823,540 1,818,359 1,524, ,494 1,093, , , ,933 Net Farm Income $49,999 or less 2,252, ,515 1,199,080 1,339, , ,989 1,013, , , ,749 $50,000-$99,999 2,699, ,397 1,666,410 1,116, , ,059 1,052, , , ,593 $100,000-$199,999 3,885,300 1,324,468 2,233,882 1,833,379 1,274, ,126 1,362, , , ,941 $200,000 or more 5,107,754 2,394,232 3,402,047 3,253,610 2,732, ,227 1,671,735 1,203, , ,609 Debt-to-Asset Ratio 0-40 percent 3,409,519 1,065,322 1,967,013 2,080,400 1,848, , , , , , percent 2,641, ,842 1,374,989 1,456,786 1,258, ,523 1,375, , , , percent or more 1,664, , ,103 1,027, , ,319 1,421, , , ,152 Farmer Age 39 years or younger 1,439, , , , , , , , , , years 2,673,671 1,172,448 1,756,675 1,819,690 1,606, ,627 1,352, , , , years or older 3,575,908 1,247,985 2,237,987 2,221,479 1,914, ,105 1,244, , , ,412