Copyright Marc Vanacht - September GIS, Key contributor to Precision Agriculture.
|
|
|
- Osborn McDowell
- 5 years ago
- Views:
Transcription
1 GIS, Key contributor to Precision Agriculture.

2 Copyright Marc Vanacht - September 2015 Precision Agriculture

3 Information Cycle in 3 D Data Deployment Decision Too Simple?
4 Information Cycle in 3 D Measure Outcomes Deployment Data Action Plan Analysis Decision Better?
5 Management Cycle in 4 D Measure Outcomes Deployment Dashboard: Data Action Plan Real time status Triggers Analysis Decision Now we re talking!
6 Long Cycles Measure Outcomes Soil structure Measuring Cycle Action Cycle 3-5 years Never? Deployment Dashboard: Real time status Triggers Action Plan Data Analysis Soil drainage Zero grade levelling Irrigation system Yearly Yearly Frequently per crop Long term investment Long term investment Long term investment Decision P and K fertlity 3-5 years Yearly Acidity 3-5 years Yearly 6
7 Yearly Cycles Measure Outcomes Measuring Cycle Action Cycle Deployment Dashboard: Real time status Triggers Action Plan Data Analysis Seeding / Planting / Pruning Crop Yield Fertility Yearly Soil prep. Crop Yield Yearly Decision Basic N fertility Soil analysis Models Yearly Pre plant 7
8 Day(s)/week(s) Cycles Measure Outcomes Measuring Cycle Action Cycle Irrigation Days < week Deployment Dashboard: Real time status Triggers Action Plan Data Analysis Disease control Insect control < week Days < week Days Decision N post em. Growth stages Days Maturity / Harvest weeks days 8
9 24 hour Cycles Measure Outcomes Measuring Cycle Action Cycle Deployment Dashboard: Real time status Triggers Action Plan Data Analysis Spider mites in citrus Daily scouting Daily Decision Weather disasters Daily weather Depends 9
10 Decision cycles: N Example Deployment Dashboard: Real time status Triggers Action Plan Measure Outcomes Decision Data Analysis A sensor on a drone sees variability of greenness. That leads to a variable rate N recommendation and application We send out the drone again after the application to measure the immediate (2 days) and delayed (10 days) reaction of the plants to the treatment At harvest we measure the ultimate outcome in bushels. We compare the 4 maps/images. They may teach us something.
11 Ongoing & Future Innovations Measuring & Data Maps Soil / fertlity maps Scouting maps Insect / disease maps Deployment Tools Autosteer tracks Seeding maps Spraying maps Irrigation maps Spreaders maps Telematics (Eqt.) maps Telematics (Agronomy) Measure Outcomes Deployment Dashboard: Real time status Triggers Action Plan Decision Data Analysis Analysis & Decision Maps Weather maps Digital Soil Maps Prescription maps Crop growth maps Field Boundary maps Satellite Images Analysis
12 In practice
13 Vegetable Co, CA, US: Water Board decision to save 30% of irrigation water 3 years agronomic tests of drip irrigation. Outcome to-date: 16 % water savings Concurrently, technology tests: RTK GPS, autosteer (2-3 cm accurate), longevity of tubes. Fertigation became part of the program, saving additionally on fertilizers In current CA drought, this became the lifesaver
14 Vegetable Co, CA, US: Water Other sustainability projects: hydroponic cultivation in greenhouse grows 50x outdoor production / ha! food waste reduction through managed supply chain. Integrated pest management Soil Vitality program (crop rotation, cover crops, soil tests, fertilizer placement, laser leveling, controlled traffic ) Energy efficiency throught the entire operation (field, packing, cooling/storage, transport )
 Issues: miticide residues, unsatisfactory levels of control, employees")
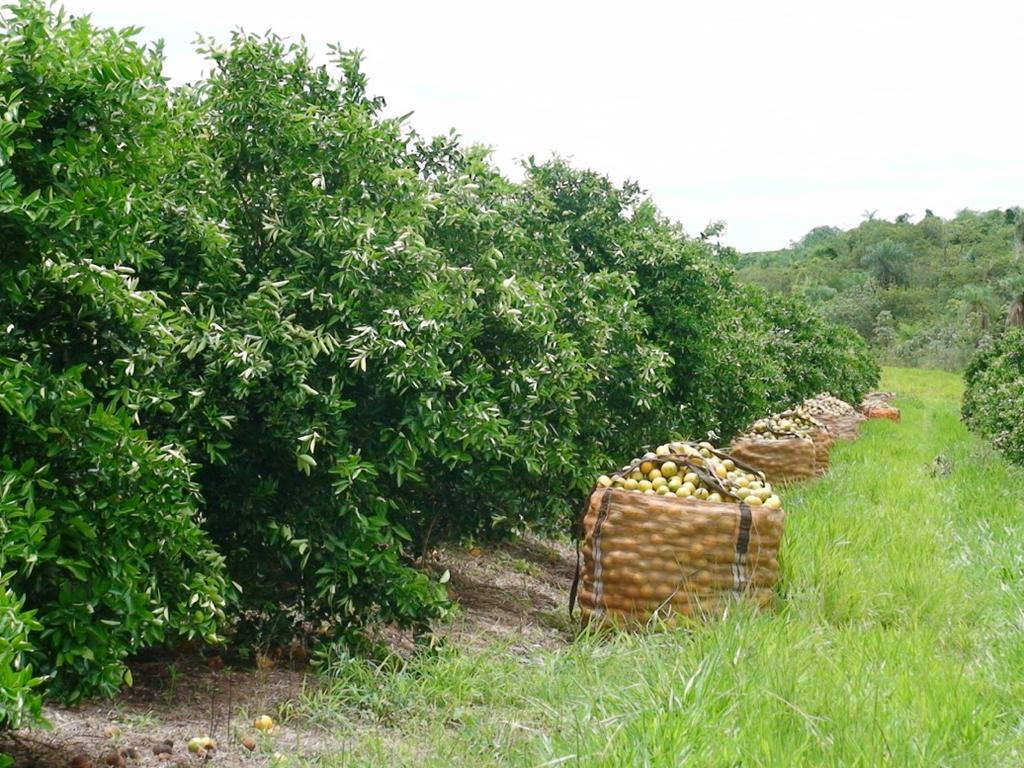
15 Brazilian Citrus Co: Miticide use Spider mites do heavy damage in citrus Notorious resistance builders, Old system: Very complex product mixtures Intense control programs (frequent, full block sprays) Issues: miticide residues, unsatisfactory levels of control, employees health

16 Brazilian Citrus Co: Miticide use New System: intense scouting: > 2000 samples points / day > 100 scouts (mostly female!) dataloggers in the field
17 New System: Brazilian Citrus Co: Miticide use Overnight data processing (using GIS) > incidence maps, > recommended treatment maps Orders & plans passed on to SAP management system Within 24 hours: targeted spraying on identified pockets, NOT on entire blocks Outcome: 70 % savings on miticide product, better fruit, healthier workers!
18
19 Brazilian Sugarcane Co: controlled vehicle traffic Planting lines of the crop ratoon have effect on operations during the full 7 years of the crop. The company developed a GIS based planting pattern planning software to optimize planting, fertilizing, harvesting to minimize erosion (contouring ) to harvest with autosteer (machine knows where the lines are) to sequence harvest operations (24 hours, mimimal sap loss, no waiting lines at the sugar plant )
20 Maoming, Guangdong, PRC: In the past: agronomic integration Semi-arid, hilly landscape. Rice paddies in the bottom of the valleys. Scrub on the hills Low productivity, barely enough to feed subsistance farmers. Today: integrated, high productivity production of meat, fish and fruit. How?
 Liquid fraction of manure: part of fertigation on fruit plantation Slurry fraction of manure: piped to valley floor to feed methane converter, and grass")
21 Maoming, Guangdong, PRC: agronomic integration Valley floor: tilapia ponds Hill sides: high value fruit, planted following contour lines Hill top: CAFO (Confined Animal Feeding Operation) Liquid fraction of manure: part of fertigation on fruit plantation Slurry fraction of manure: piped to valley floor to feed methane converter, and grass for fish.
 Liquid fraction of manure: part of fertigation on fruit plantation Slurry fraction of manure: piped to valley floor to feed methane converter, and grass")
22 Maoming, Guangdong, PRC: agronomic integration Valley floor: tilapia ponds Hill sides: high value fruit, planted following contour lines Hill top: CAFO (Confined Animal Feeding Operation) Liquid fraction of manure: part of fertigation on fruit plantation Slurry fraction of manure: piped to valley floor to feed methane converter, and grass for fish.
 Liquid fraction of manure: part of fertigation on fruit plantation Slurry fraction of manure: piped to valley floor to feed methane converter, and grass")
23 Maoming, Guangdong, PRC: agronomic integration Valley floor: tilapia ponds Hill sides: high value fruit, planted following contour lines Hill top: CAFO (Confined Animal Feeding Operation) Liquid fraction of manure: part of fertigation on fruit plantation Slurry fraction of manure: piped to valley floor to feed methane converter, and grass for fish.
 Liquid fraction of manure: part of fertigation on fruit plantation Slurry fraction of manure: piped to valley floor to feed methane converter, and grass")
24 Maoming, Guangdong, PRC: agronomic integration Valley floor: tilapia ponds Hill sides: high value fruit, planted following contour lines Hill top: CAFO (Confined Animal Feeding Operation) Liquid fraction of manure: part of fertigation on fruit plantation Slurry fraction of manure: piped to valley floor to feed methane converter, and grass for fish.


25 Maoming, Guangdong, PRC: agronomic integration Valley floor: tilapia ponds Hill sides: high value fruit, planted following contour lines Hill top: CAFO (Confined Animal Feeding Operation) Liquid fraction of manure: part of fertigation on fruit plantation Slurry fraction of manure: piped to valley floor to feed methane converter, and grass for fish.
 Liquid fraction of manure: part of fertigation on fruit plantation Slurry fraction of manure: piped to valley floor to feed methane converter, and grass")
26 Maoming, Guangdong, PRC: agronomic integration Valley floor: tilapia ponds Hill sides: high value fruit, planted following contour lines Hill top: CAFO (Confined Animal Feeding Operation) Liquid fraction of manure: part of fertigation on fruit plantation Slurry fraction of manure: piped to valley floor to feed methane converter, and grass for fish.
27 Big Data System Integration


28 Example Developed over 5 years (since 2009) At some point in time involved 180 developers Operationally & field tested on 75,000 acre (2 years) To be Field Hardened on 800,000 acre in Crops: corn, soy, rice, milo, organic vegetables
29 Fully Integrated GIS Libraries based Software menus Services list (i.e. each equipment & function is a service) Registered weed / pest disease control products Fertilizer formulations Micro nutrient formulations
30 Fully Integrated GIS Easy & intuitive (map navigation, GIS data) access to: Soil maps Field boundaries Hydrology Digital Elevation Maps Weather: archives, ongoing, predictions
31 Fully Integrated GIS Integrate / map / plot local agronomy data: Remote images (satelite, airplane, drone ) Soil sampling data and on-the-go soil measurements Soil Fertility maps: base, prescription, as-applied Crop Nitrogen maps (NDVI: remote, machine based, backpack) Maps of aerial applications: prescription and as-applied Weed, pest & disease maps: scouting, prescription & as-applied Sensor networks for real time monitoring of crops Yield maps
32 Fully Integrated GIS Management: Multimedia connection (including video) to each piece of field equipment Equipment telemetry: operating status & location (RTK + laser) Real time, cloud ready, but also off-cloud capabilities Central control room and tablet based
33 Fully Integrated GIS Industrial strength / scalable database (Oracle) Industrial strength / scalable GIS (ESRI) Multiplatform programnming language: Java Data access control: functional, geographic hierarchies < 1 second response lag time for standard queries


, Beijing,")
 State Farm")


34 Who? What? Where? NERCITA (National Engineering Research Center for Information Technology in Agriculture), Beijing, China Tested: Hong Xing (Red Star) State Farm Rolled out in 2015 in Heilongjiang Province, Bei An District Presented to a panel of international experts in Sept 2014, at the occasion of CIGR 2015 (Worldwide version of ASABE)
35 Thank you