Fragmented. Lands. Changing Land Ownership in Texas
|
|
|
- Allyson Bell
- 5 years ago
- Views:
Transcription
1 Fragmented Lands Changing Land Ownership in Texas
2 Fragmented Lands: Changing Land Ownership in Texas Neal Wilkins, Assistant Professor and Extension Wildlife Specialist Department of Wildlife and Fisheries Sciences Robert D. Brown, Professor and Department Head Department of Wildlife and Fisheries Sciences Richard J. Conner, Professor Department of Rangeland Ecology and Management Jason Engle, Extension Graduate Assistant Department of Wildlife and Fisheries Sciences Charles Gilliland, Research Economist Texas A&M Real Estate Center Amy Hays, Extension Associate Department of Wildlife and Fisheries Sciences R. Douglas Slack, Professor Department of Wildlife and Fisheries Sciences Don W. Steinbach, Professor and Extension Wildlife and Fisheries Specialist (retired) Department of Wildlife and Fisheries Sciences Editor Lynette James Texas A&M Agricultural Communications Designer Jim Ward Texas A&M Agricultural Communications
3 Land is Texas legacy. Our economic foundation has always been based on things produced from our state s vast acreage. But one issue could greatly impact this precious resource land ownership fragmentation. Ownership fragmentation is the division of rural lands into smaller parcels that remain in rural use. Ownership fragmentation may result in rural parcel sizes generally too small to maintain the economy-ofscale for traditional farming, ranching, and forestry uses. Potential impacts of ownership fragmentation include loss of open space; a localized loss of farm, ranch, and forest production; higher demand for public services from rural areas; and a reduction in effective wildlife habitats. This brochure provides information to help you make crucial decisions that address the ownership fragmentation issue and its potential impact on Texas rural communities and the natural resources upon which our waters, wildlife habitats, and agricultural economies are ultimately based. 1
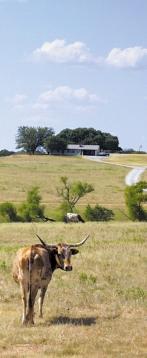
4 Rural Land Loss and Fragmentation The fragmentation of rural lands in Texas is accelerating. This trend is mainly due to the combined influence of weakened agricultural economies and the increasing demands of a large, urban population. Texas leads all other states in the loss of rural farming and ranching lands. According to the U.S. Department of Agriculture, the conversion of rural land to urban uses in Texas from 1982 to 1997 exceeded 2.6 million acres. The annual rate of conversion from 1992 to 1997 nearly doubled from the previous 1 years. While these lands are directly converted to development, millions of additional acres including many large properties that have been family-owned and operated for generations are beginning to feel the squeeze of a larger demand for rural lands for nontraditional uses. Rural Land Ownership in Texas Exceeds 144 Million Acres Rural lands represent 86 percent of the state, providing the primary land base for agriculture, forestry, wildlife, and outdoor recreation. Source: Comptroller s Office Land Fragmentation Influences Changing Demographics Urban population growth Ethnicity changes Ex-Urban Development More rural landowners Smaller rural property sizes Rural Land Values Increasing market values Decreasing agricultural values Operational Challenges Absentee ownership Economies of scale Other 3% Timberland 5% Irrigated Crop 4% Native Rangeland 65% With land fragmentation, we have to address its effects on agricultural production and land management efficiency, on our natural resources, and on rural communities that are changing from agricultural centers to those that reflect urban lifestyles. Dryland Crop 15% Improved Pasture 8% 2
5 Changing Sizes in Land Ownerships About 8 percent of Texas farms and ranches are less than 5 acres. These small ownerships are harder to operate due to economies of scale; are frequently owned by absentee landowners; and are more likely to be subdivided, resulting in loss of wildlife habitat. Texas is losing its farms and ranches, those between 5 and 2, acres in size. These mid-sized farms and ranches are Texas bread and butter for significant agricultural production. Change in Ownership Numbers Change in Ownership Numbers Change in Ownership Numbers 2, 1,5 1, Loss of Mid-Sized Farms and Ranches ( ) Virtually all Texas counties have experienced an increase in small ownership classes (<5 acres). 55% have lost some mid-sized ownerships (5-2, acres). 48% gained some larger ownerships (2,+ acres) Size (acres) Fragmentation Top 1% of Texas counties according to gains in 5-5 acre ownerships , 5-1, 5-1, 1,-2, 1,-2, 1,-2, 2,+ Consolidation Top 1% of Texas counties according to gains in 2,+ acre ownerships 2,+ 2,+ -3 Size (acres) Source: USDA Agricultural Statistics Service 3

6 A Statewide Perspective Rural land ownership sizes vary across Texas, according to the proximity to population centers and historical land uses. For example, people own smaller tracts of land in the eastern half of Texas because these lands are adjacent to three of the largest cities in the United States Dallas/Fort Worth, Houston, and San Antonio and more lands are devoted to forestry and smaller agricultural enterprises than in the High Plains, where large ranches and farms dominate. Overall, landowner numbers are increasing while property size is decreasing. Discounting forestlands, Texas had around 181, farms in In the succeeding five years, that figure increased by 7 percent to 194, farms, while average ownership size decreased from 725 acres to 676 acres. Average rural ownership size has declined in 74 percent of Texas counties since Percent Approximately 81% of the state s rural land is owned by 23% of the rural landowners. Ownership Acres , 1,-2, 2,+ Size (acres) Source: USDA Agricultural Statistics Service Smaller Ownership Sizes in East Texas Average Size (acres) 2, - 5, 1, - 2, 5, - 1, 3, - 5, 2, - 3, 1, - 2, 75-1, Fragmentation Rates Vary Across Texas Number of Rural Landowners (% change ) >5% decline 25-5% decline 1-25% decline 3-1% decline no change 3-1% increase 1-25% increase 25-5% increase >5% increase Fragmentation Consolidation Small Percentage of Landowners Still Own Most of Texas Land Land ownership sizes vary across Texas, according to proximity to population centers and historical land uses. Smaller ownerships are concentrated in the eastern half of the state. Source: USDA Agricultural Statistics Service Source: USDA Agricultural Statistics Service 4

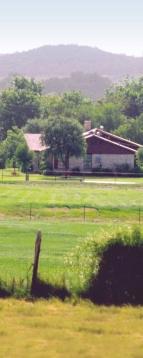
7 Influences on Fragmentation Rates While average ownership size seems to be closely related to the distribution of the state s population, the most recent fragmentation trends seem to be influenced more by ecological region. More people are buying land for its beauty and recreation value, including proximity to trees, water, rolling hills, and wildlife. Population Ownership Size = One dot = 3, people Trans Pecos High Plains Ecological Regions Rolling Plains Black- land Prair airieie Llano Uplift Edwards Plateau S. Texas Brush Country Coastal Sand Plain Oak Woods & Prairies Piney Woods Gulf Coast Prairies & Marshes = Fragmentation Rate 5
8 Land Productivity Value a Small Percentage of Market Value The median price of rural lands in Texas increased by nearly 35 percent from 1992 to1997. Prices tended to be higher in the eastern half of the state and peaked in those areas closest to major metropolitan areas. During this same period, most traditional agricultural ventures have become less profitable. As a result, there is a growing disparity between market values and agricultural productivity values. Appraisals of agricultural productivity value are based on a property s ability to produce agricultural or timber products, while market 1 value is based on the fairmarket price of a property 8 on the open real estate market. 6 As the agricultural productivity value of land decreases in relation to the market value, larger farm and ranch lands tend to be subdivided into smaller parcels to gain a higher per acre market value. The average appraised market value of the 144 million Texas acres considered agricultural lands in 1998 was about $519 per acre, while the appraised productivity value on that same land was about $83 per acre. Land Prices Reflect Demand for Rural Land Median Price Per Acre 4 2 Source: Texas A&M Real Estate Center Agricultural Productivity vs. Market Values Market Value Ag Productivity Category Total Acres (per acre) Value (per acre) Irrigated crop 5,551,413 $ 772 $ 299 Dryland crop 21,558, Barren/wasteland 2,31, Orchards 15,12 2, Improved pasture 1,81,93 1,6 95 Native pasture 94,85, Wildlife management 14,173 1, Other ag lands 2,3, Timberland 7,462, ,27,157 $ 519 $ 83 Average appraisals of agricultural productivity values are approximately 16% of appraised market values. For those lands in areas of high demand, those differences are even greater. 6 Source: Comptroller s Office, unpublished 1998 data
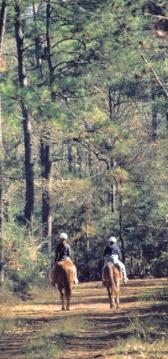
9 Rural Land Buyer and Seller Motives Since 1994, consumers have dominated the market for rural lands in Texas. These people, who live primarily in urban areas, want to own land for recreational purposes (such as fishing, hunting, or horseback riding), for the peace of mind they associate with rural living, or for the aesthetic appeal of the land. Fewer people are buying land for farming, ranching, or forestry. In fact, producers are motivated to sell their land because of financial stress or for retirement and health reasons when no one in the family wants to continue in the farm/ranch business. Recreation Is Top Land-Buying Motive Percent Recreation Investment Rural Homesites Ag Production Source: Texas A&M Real Estate Center Percent Percent of Market Fall 93 Spring 94 Fall 94 Spring 95 Fall 95 Spring 96 Fall 96 Spring 97 Fall 97 Spring 98 Fall 98 Spring 99 Fall 99 Estate Settlement, Retirement Are Top Land-Selling Motives Source: Texas A&M Real Estate Center Financial Stress Estate Settlement Retirement, Age or Health Fear of Market Decline Fall 93 Spring 94 Fall 94 Spring 95 Fall 95 Spring 96 Fall 96 Spring 97 Fall 97 Spring 98 Fall 98 Spring 99 Fall 99 Consumers Dominate Market for Land Farmers & Ranchers Dominate Source: Texas A&M Real Estate Center Median Price Per Acre Median Price Per Acre Median Price Per Acre Trends in Land Prices Vary According to Regional Characteristics $2, $1, $ Year $2, $1, $ Year $2, $1, Rural Recreational Area Highland Lakes Rural Adjacent to Urban Area Fort Worth Prairie Farming Area South Plains Consumers Dominate Producers Investors Consumers $ Year Source: Texas A&M Real Estate Center 7
10 Where Do We Go From Here? Even though 82 percent of Texas population resides on 6 percent of the state s land (urban areas), the quality of life for many urban people depends on their ability to access and enjoy our state s natural resources. Ownership fragmentation, and how we manage it, will impact all of our natural resources as well as our economy. The fragmentation of Texas rural lands combined with long-term decreases in agricultural income may affect the quality of urban life as well as people living in rural communities. Land fragmentation may also impact our ability to manage ecologically sensitive areas important for wildlife. Research is needed to monitor land fragmentation over time and understand the: Influence of fragmentation on wildlife habitats. Motivations for land ownership consolidation and fragmentation. Economic constraints on better management of natural resources. We need to expand our Extension and outreach programs to landowners of small acreages so they can manage their land to maintain and enhance wildlife, soil, water, trees, and vegetation. They need tools such as geographic information systems (GIS) to help them make the best decisions in caring for the land they own. Land is Texas legacy. Our economic foundation has always been based on things produced from our state s vast acreage. We hope the information presented in this brochure will help you make decisions that will help Texans conserve and appreciate this legacy for many years to come. 8

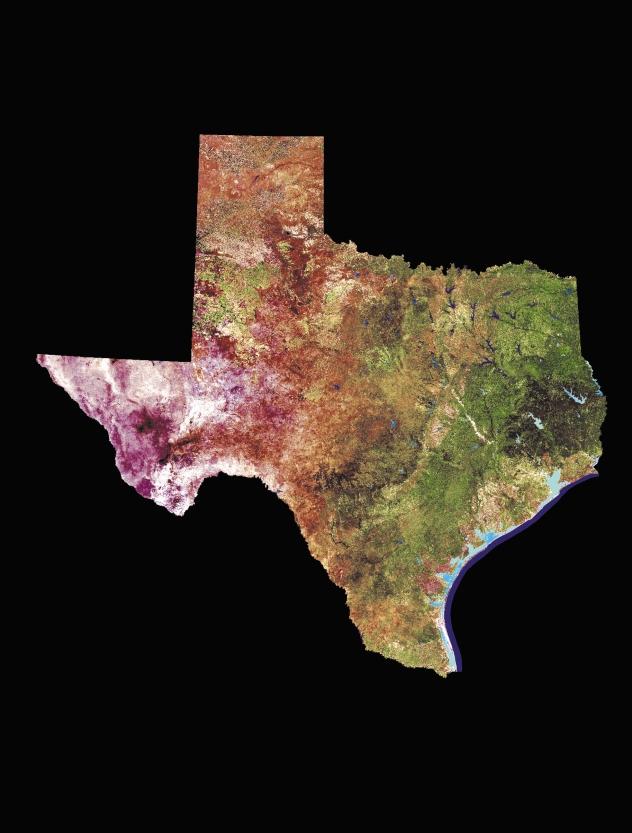
11 Sources of Information For more detailed information on land fragmentation, refer to the following sources: Texas A&M Land Information Systems Laboratory -- An informational resource on land management in Texas. It contains interactive mapping and geographic information systems (GIS) to provide landowners with site-specific natural resources information. Texas A&M Real Estate Center -- Contains historical land prices for Texas as well as information on all aspects of the Texas real estate industry. Texas Natural Resources Information System -- A comprehensive resource for obtaining maps and spatial data for managing natural resources in Texas. Agriculture Property Tax Conversion for Wildlife Management -- A planning resource for private landowners wishing to apply for Wildlife Tax Valuation on rural lands in Texas. USDA Agricultural Statistics Service -- Contains the most recent agricultural and land use statistics. A 1996 aerial view of a fragmented landscape in the Chappell Hill area of Washington County, Texas. Colors in red indicate active plant growth. This data is part of the public data sets provided by the Texas Natural Resources Information System (TNRIS) StratMap program. MKT M, 9/ Prepared by Agricultural Communications Back Cover: Winter 1998 satellite image from the IRS-4 Wide-Field Sensor. Image courtesy of Dr. Gordon Wells, Texas Natural Resources Information System.
12