Josef Eitzinger, COST 734 Team Inst. of Meteorology, BOKU, Vienna
|
|
|
- Augustus Farmer
- 5 years ago
- Views:
Transcription


1 International Conference on current knowledge of Climate Change Impacts on Agriculture and Forestry in Europe 3-6 May 2011, Topolcianky, Slovakia Josef Eitzinger, COST 734 Team Inst. of Meteorology, BOKU, Vienna
2 Application of process oriented models in Europe
3 Models and their related spatial and time scale Point (Plant) Field hour day month Physiological models Mikroclimatic models Agrometeorological crop models Tree growthmodels year Region Global Problems: spatial Input data Support tools : GIS, remote sensing methods Ecosystem models, Hydrological models Regional climate models Land surface models (SVAT) Global climate models (incl. SVAT)


4 Use of process oriented crop models in European countries Models Crops

5 Reported research applications of crop models
6 Problems and uncertainties in crop model applications: A) Caused by crop model inputs

7 Crop model inputs /outputs
 - Accuracity of measured data (technical) - Representativity of measured data Factors : Soil characteristics Topography (!) Soil surface.")
8 Problems of input data quality (Soil, weather data, plant data) Quality of weather input data : - Homogeinity of time series (climate data!) - Accuracity of measured data (technical) - Representativity of measured data Factors : Soil characteristics Topography (!) Soil surface... Model results are as accurate as their input data!!
9 Reported limitations of crop model applications in European countries
10 Problems and uncertainties in crop model applications: B) Caused by the representation of the simulated processes
11 Stufe 2 : Wasserhaushalt als limitierender Faktor LEVEL 2
12 Testing and comparing crop models: Checking the sensitivity of simulated processes and related outputs on input parameters
 Sensitivity of winter wheat yield to temperature and precipitation in Austria CERES-Wheat model (Alexandrov et al.")
13 Precipitation changes (%) Grain yield changes (%) b) Available soil water capacity 100mm Air temperature changes (oc) Sensitivity of winter wheat yield to temperature and precipitation in Austria CERES-Wheat model (Alexandrov et al., 2002) -24
14 Deviations in simulated soil water contents Simulated and measured soil water in lysimeter (Eitzinger, Trnka, Zalud et al., 2003)
15 Measured (Lysimeter) and simulated ETP
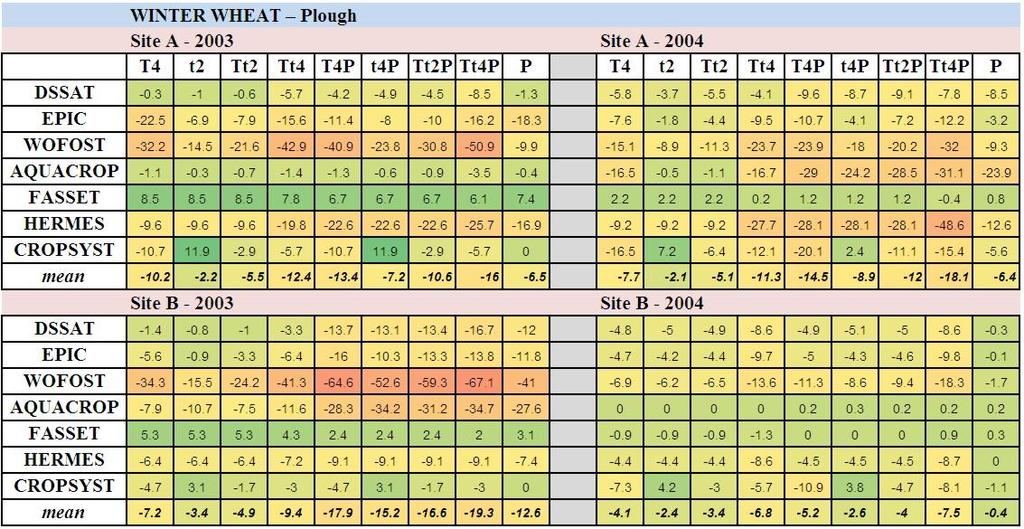
16 COST 734 case study Crop model comparison (7 models: DSSAT, EPIC, WOFOST, AQUACROP, FASSET, HERMES, CROPSYST) on drought and heat stress effects on winter wheat and maize yields
17 Study contributers (modellers) Josef Eitzinger(1), Sabina Thaler(1).DSSAT Erwin Schmid(2), Franziska Strauss(2).EPIC Roberto Ferrise(3), Marco Moriondo(3), Marco Bindi(4).CROPSYST Taru Palosuo(5), Reimund Rötter(5) WOFOST Christian Kersebaum(6) HERMES Jørgen E. Olesen(7), Ravi H. Patil(7)...FASSET Levent Saylan(8), Baris Caldag(8), Osman Caylak(8)...AQUACROP 1) Institute of Meteorology, University of Natural Resources and Applied Life Sciences (BOKU), Peter-Jordan Str. 82, A-1190 Vienna, Austria 2) Institute for Sustainable Economic Development, University of Natural Resources and Applied Life Sciences (BOKU), Feistmantelstr. 4, A-1180 Vienna, Austria 3) CNR-IBIMET, Via G. Caproni Florence, Italy 4) Department of Plant, Soil and Environmental Science, University of Florence, Piazzale delle Cascine Florence, Italy 5) Plant Production Research, MTT Agrifood Research Finland, Lönnrotinkatu 5, FI Mikkeli, Finland 6) Inst. of Landscape Systems Analysis, Leibniz-Center for Agricultural Landscape Research (ZALF), Muencheberg, Germany 7) Department of Agroecology and Environment, Faculty of Agricultural Sciences, Aarhus University, Blichers Alle 20, P. O. Box 50, DK-8830 Tjele, Foulum, Denmark 8) Department of Meteorology, Faculty of Aeronautics and Astronautics, Istanbul Technical University, Maslak, Istanbul, Turkey
18 Study design: 2 years, 2 crops, 2 locations, 2 soil cultivation types Years : 2003 (dry) and 2004 (wet) Crops: Maize and Winter Wheat Locations: Marchfeld (semi-arid, sandy loam), Styria (humid, loam) Soil cultivation: Plough and minimum cultivation (harrow)
19 Baseline conditions during flowering periods in 2003 and 2004 (real weather conditions)
20 Weather scenarios applied on baseline (change of a 14-day period during flowering of maize and winter wheat)

21 Simulated yields for the baseline (real weather conditions)

22

23

24
25
26 Potential reasons for deviations between the models Differences in simulated basic water balance parameters (Eto, interception, etc.) Differences in simulated root growth and water uptake Differences in simulated N-balance (if simulated) Differences in simulated biomass accumulation and LAI Differences on model parameterization of cultivar temperature response and water stress impacts. Differences in yield estimation details (Final harvest index vs. Biomass distribution processes etc.) more
27 (General) CONCLUSIONS The crop models agree with few exceptions in general yield trends in the baseline scenarios (in respect of the influence to the year and location). All models show for winter wheat higher relative yield response to temperature increase than for maize. All models show for maize higher (negative) yield response to skipped precipitation (water stress) than for winter wheat. The models show mixed yield reponse to increased temperatures for both crops (positive and negative ones). Under water stress the models show mixed yield reponse for winter wheat (positive and negative ones) and mostly significant negative yield response for maize. All models respond to soil cultivation, but in different way and range. Huge differences occurred between the relative yield responses to water stress between the models.
28 Thank you for your attention!