Farms and Land in Farms
|
|
|
- Calvin Jennings
- 5 years ago
- Views:
Transcription
1 United States Department of Agriculture National Agricultural Statistics Service Farms and Land in Farms February 2003 Sp Sy 3 (03)
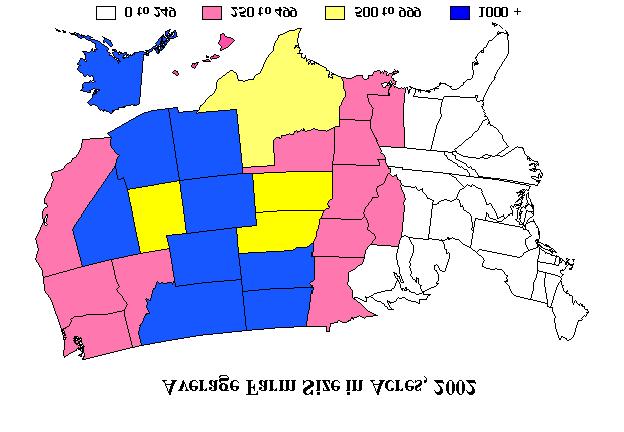
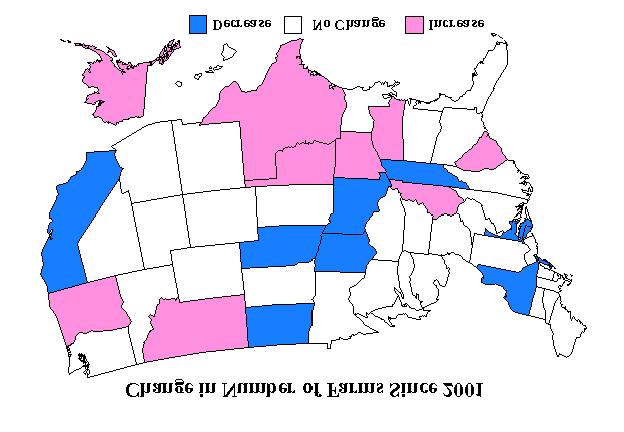
2 Up Slightly in 2002 The number of farms in the United States in 2002 is estimated at 2.16 million, up 0.1 percent from The increase in farms occurred primarily in agricultural operations with $-$9,999 in sales. land in farms, at million acres, increased 170,000 acres from last year. The average size of farm at 436 acres, decreased one acre from The increase in the number of farms and land in farms primarily resulted from the inclusion of pasture only farms in The U.S. number of agricultural operations in the economic sales class $-$9,999 increased 1.0 percent to 1,172,770 in Farms with sales in the $10,000-$99,999 economic class decreased 0.9% from 2001 to 637,160 operations. The number of farms with sales over $100,000 at 348,160 decreased 1.1 percent. Dry weather, below normal yields, and lower commodity prices contributed to the shifting of farms among the economic sales classes. The number of farms in the South Region increased by 5,700, 0.6 percent, and the number of farms in the West Region increased by 510, 0.2 percent. The North Central Region lost 3,300 farms, 0.4 percent. The number of farms declined 500, or 0.4 percent in the Northeast Region. The number of farms in 2002 increased in nine States, remained unchanged in 32 States, and decreased in nine States. Texas gained farms while Kentucky, Mississippi, Oklahoma, and Oregon added farms during the year. Arkansas, Montana, and South Carolina farms increased by 500. California, Iowa, Missouri, Nebraska, and Tennessee farms declined by. New York lost 500 farms and North Dakota lost 300. Texas, which leads the Nation in acres in farms with 131 million acres, increased agricultural acreage during 2002 adding 1.0 million acres. States with decreases in land in farms were; Wisconsin, down 200,000 acres, and Arizona, Iowa, Minnesota, Missouri, Ohio, and Tennessee which declined 100,000 acres. Other states losing agricultural acreage were Delaware, New Hampshire, and New Jersey, each down 10,000 acres Year Number of Farms, Land in Farms, and Average Size Farm: United States, Number of Farms Land in Farms Average Farm Size Number Acres Acres 2,107,840 2,201,590 2,197,690 2,196,400 2,190,500 2,190,510 2,191,360 2,192,070 2,172,280 2,155,680 2,158, , , , , , , , , , ,480 1 A farm is any establishment from which $ or more of agricultural products were sold or would normally be sold during the year February NASS, USDA


3 February NASS, USDA
4 Percent of for Places With Less Than $ of Reported Sales, but with Sufficient Crops and Livestock to Normally Have Sales of at least $, United States, Year Farms Percent of Land February NASS, USDA
5 AL AK AZ AR CA CO CT DE FL GA HI ID IL IN IA KS KY LA ME MD MA MI MN MS MO MT NE NV NH NJ NM NY NC ND OH OK OR PA RI SC SD TN TX UT VT VA WA WV WI WY Number of Farms: By State and United States, State Number Number Number 47, , ,500 2,600 50,000 5, , , ,000 29, , , ,600 15,200 38,000 57,000 30,300 80,000 85,000 40, , , ,000 20,500 77,000 9,200 47, ,300 48,000 85,000 50,000 5, , , , , , ,000 30,300 78,000 86,000 40, ,000 6, ,500 77,000 9,200 47, ,300 48, ,000 5, , , ,000 28, ,600 37,000 56,000 78,000 87, , , ,500 77,000 9,200 US 2,172,280 2,155,680 2,158,090 February NASS, USDA
6 AL AK AZ AR CA CO CT DE FL GA HI ID IL IN IA KS KY LA ME MD MA MI MN MS MO MT NE NV NH NJ NM NY NC ND OH OK OR PA RI SC SD TN TX UT VT VA WA WV WI WY Land in Farms: By State and United States, State Acres Acres Acres ,600 27, , ,440 11,900 15, ,600 8,100 1, , , ,700 9,200 39,400 14, ,200 7, , ,340 8,700 15,700 3,600 16,200 34,600 8, ,600 14, ,200 1,440 11,900 15,400 32,700 47,400 13,600 8,050 1, ,500 29, , ,600 9,100 39,400 14, ,200 7, , ,340 8,700 15,700 3,600 16,100 34,600 8, ,500 14, ,200 1,440 11,900 15,400 32,600 47,400 13,600 8,050 1, ,400 29, , ,600 9,100 39,400 14, ,200 7, , ,340 8,700 15,700 3,600 15,900 34,600 US 943, , ,480 February NASS, USDA
7 Northeast CT 2 ME 2 MA 2 NH 2 NJ 2 NY PA RI 2 VT 2 Oth Sts 1 State and Region $- $9,999 Number of Farms: Economic Sales Class by State, Region, and United States, 2002 $10,000- $99,999 Economic Sales Class $100,000- $249,999 $250,000- $499,999 $500,000 & Over Number Number Number Number Number Number 2,450 4,200 3,200 6, , , ,880 34,780 6,900 3,240 14,140 1,070 5, ,210 3,810 6,000 9,600 37, , ,600 North Central IL IN IA KS MI MN MO NE ND OH SD WI 29,500 28, , ,400 40,000 7,000 37, , ,500 28,000 35,400 20, , , ,000 13,300 6,300 17,000 8,500 4, ,500 10,700 5,800 6,400 6, ,600 7,600 2,900 5,000 5,000 4,600 47,600 1, ,400 76, , , , South AL AR DE 2 FL GA KY LA MD 2 MS NC OK SC TN TX VA WV 2 Other States , ,300 5, ,000 18, ,000 31,900 17, ,410 8, , , ,000 57,000 13,800 9, ,330 3,700 2,600 4,300 10,000 1, ,900 3,300 1, ,524 1, , ,936 47,000 48,500 50, ,000 87, , , West AK 2 AZ 2 CA CO HI 2 ID MT NV 2 NM OR UT WA WY 2 Other States ,400 40,000 14, ,300 24,600 3, ,960 25,000 10,000 6,600 9,900 4,400 5,000 8,650 86,050 7, , ,130 24, ,250 8, , , , , , ,390 US 1 CT, ME, MA, NH, NJ, RI, and VT. 2 Estimates not available for all sales classes. 3 DE, MD, and WV. 4 AK, AZ, HI, NV, and WY. 1,172, , ,870 89,244 69,046 2,158,090 February NASS, USDA
8 Northeast CT 2 ME 2 MA 2 NH 2 NJ 2 NY PA RI 2 VT 2 Oth Sts 1 State and Region $- $9,999 Land in Farms: Economic Sales Class by State, Region, and United States, 2002 $10,000- $99,999 Economic Sales Class $100,000- $249,999 $250,000- $499,999 $500,000 & Over Acres Acres Acres Acres Acres Acres ,340 1,150 5, , , , , ,600 7, ,340 20,110 North Central IL IN IA KS MI MN MO NE ND OH SD WI 1,400 7,100 2, ,400 9,300 8, ,800 12,600 4, , ,300 7,600 5, , ,300 5,900 3,200 8,000 5,300 9,900 8,000 2,700 63,600 3,200 7,000 4,200 9, ,400 32,600 47,400 28,400 29,800 46,400 39,400 14,700 15, South AL AR DE 2 FL GA KY LA MD 2 MS NC OK SC TN TX VA WV 2 Other States 3 3, ,300 6, ,280 3,300 2,600 5,800 1,900 2,600 13,400 1,150 45,700 3,800 2,135 92,585 1,850 1,400 1,900 1, , , , 1,200 1, 4, , ,155 4,900 4, , ,275 8,900 14, ,200 13,600 8,050 9, , ,700 3, ,910 West AK 2 AZ 2 CA CO HI 2 ID MT NV 2 NM OR UT WA WY 2 Other States ,815 6,900 9,500 3,200 15, ,700 17,465 74,265 2,900 10, ,400 11,435 66, ,000 16,205 52,105 12,700 7,000 3,800 18,940 66, , ,440 11, , ,700 34, ,360 US 1 CT, ME, MA, NH, NJ, RI, and VT. 2 Estimates not available for all sales classes. 3 DE, MD, and WV. 4 AK, AZ, HI, NV, and WY. 124, , , , , ,480 February NASS, USDA
9 Number of Farms: Economic Sales Class by State, Region, and United States, 2001 State and Region $- $9,999 Economic Sales Class $10,000- $99,999 $100,000 & Over Number Number Number Number Northeast CT 2 ME 2 MA 2 NH 2 NJ 2 NY PA RI 2 VT 2 Oth Sts 1 2,450 4,200 3,200 6,400 17, ,500 10,600 38,100 8,700 9,700 3, ,000 9, , North Central IL IN IA KS MI MN MO NE ND OH SD WI ,500 30, , ,000 35, ,200 25, ,000 28,500 15,500 28,500 36, , , ,200 25, ,000 20,000 10, , ,900 76, , ,300 78, , ,300 South AL AR DE 2 FL GA KY LA MD 2 MS NC OK SC TN TX VA WV 2 Other States ,000 5, , ,900 17, , , ,100 18,000 56, , ,580 5,000 10,000 6,000 6,500 4,300 6,000 17,000 4,480 89,580 47,000 48,000 50,000 88, ,000 86, , , ,400 West AK 2 AZ 2 CA CO HI 2 ID MT NV 2 NM OR UT WA WY 2 Other States 4 4,400 40,000 14, ,300 26,500 8,500 24,600 3, ,750 10,500 6,600 10,000 4,100 5,000 8,130 86, ,900 4,900 6,500 6,900 54, ,300 85,000 5, , , ,880 US 1 CT, ME, MA, NH, NJ, RI, and VT. 2 Estimates not available for all sales classes. 3 DE, MD, and WV. 4 AK, AZ, HI, NV, and WY. 1,160, , ,980 2,155,680 February NASS, USDA
10 Northeast CT 2 ME 2 MA 2 NH 2 NJ 2 NY PA RI 2 VT 2 Oth Sts 1 State and Region Land in Farms: Economic Sales Class by State, Region, and United States, 2001 $- $9,999 Economic Sales Class $10,000- $99,999 $100,000 & Over Acres Acres Acres Acres ,150 1,150 5,850 3,800 3,200 2,130 9, , ,600 7, ,340 20,130 North Central IL IN IA KS MI MN MO NE ND OH SD WI 1,200 7,100 2,700 2, ,200 3,800 9,400 15,900 2,700 8, ,900 13, , , ,900 17, ,800 22,600 7,600 28,500 8, ,800 15,400 32,700 47,400 28,500 29,900 46,400 39,400 14,800 16, ,700 South AL AR DE 2 FL GA KY LA MD 2 MS NC OK SC TN TX VA WV 2 Other States ,600 3,600 1, ,400 6, ,580 3,400 2,700 5,700 1,900 13,700 1,200 45,000 1,585 92,085 2,900 9,100 7,000 5,700 4,300 5,100 5,300 13,700 3, , ,355 8,900 14, ,200 13,600 8,050 9, , ,700 3, ,020 West AK 2 AZ 2 CA CO HI 2 ID MT NV 2 NM OR UT WA WY 2 Other States ,700 27,615 9,400 3,200 15, ,700 18,145 74,645 18,400 18,000 7,200 37,100 28,000 8,000 10,500 46, , , ,440 11, , ,700 34, ,460 US 1 CT, ME, MA, NH, NJ, RI, and VT. 2 Estimates not available for all sales classes. 3 DE, MD, and WV. 4 AK, AZ, HI, NV, and WY. 124, , , ,310 February NASS, USDA
11 Number of Farms: Economic Sales Class by State, Region, and United States, 2000 State and Region $- $9,999 Economic Sales Class $10,000- $99,999 $100,000 & Over Number Number Number Number Northeast CT 2 ME 2 MA 2 NH 2 NJ 2 NY PA RI 2 VT 2 Oth Sts 1 2,450 4,300 3,300 6,400 18, , ,200 16,500 10,300 38,000 8,400 9,500 4, ,100 9,600 38, North Central IL IN IA KS MI MN MO NE ND OH SD WI 28,000 29,700 27, , , , ,000 27,200 16, , ,000 15, , ,700 8,000 20,000 18,500 8,700 10,000 10,200 18, ,800 78, , ,300 80, , ,800 South AL AR DE 2 FL GA KY LA MD 2 MS NC OK SC TN TX VA WV 2 Other States ,500 32, ,500 5, ,700 68, , ,500 9, ,600 7, ,500 18,000 56, , ,220 5,000 10,000 5,000 6,000 4,400 4,600 10,000 6,000 17,000 4,480 89,280 47,000 48,000 2,600 50,000 90,000 29, ,000 85, , , ,000 West AK 2 AZ 2 CA CO HI 2 ID MT NV 2 NM OR UT WA WY 2 Other States ,200 3, ,500 26,500 25,700 3, , 25,000 10,300 7,200 10,800 4,100 5,000 8,230 87, ,000 4,800 6,400 54, ,500 5, ,600 15,200 40,000 15,500 40,000 9, ,580 US 1 CT, ME, MA, NH, NJ, RI, and VT. 2 Estimates not available for all sales classes. 3 DE, MD, and WV. 4 AK, AZ, HI, NV, and WY. 1,173, , ,180 2,172,280 February NASS, USDA
12 Northeast CT 2 ME 2 MA 2 NH 2 NJ 2 NY PA RI 2 VT 2 Oth Sts 1 State and Region Land in Farms: Economic Sales Class by State, Region, and United States, 2000 $- $9,999 Economic Sales Class $10,000- $99,999 $100,000 & Over Acres Acres Acres Acres ,470 5,900 3,700 3,200 1,980 8, , ,700 7, ,340 20,250 North Central IL IN IA KS MI MN MO NE ND OH SD WI 1,900 7,200 3,400 2, ,600 9,400 15,500 8, ,800 4,800 14,400 4, ,400 10, ,200 5,700 17, ,200 27,600 8, ,200 15, ,600 46,400 39,400 14,900 16, ,400 South AL AR DE 2 FL GA KY LA MD 2 MS NC OK SC TN TX VA WV 2 Other States ,900 3, , ,898 3,400 5,800 1,900 14,800 1,200 48,000 1,607 96,707 2,700 9,100 6,000 5,700 4,100 5,100 5, , , ,875 14, , ,600 8, , , ,700 3, ,480 West AK 2 AZ 2 CA CO HI 2 ID MT NV 2 NM OR UT WA WY 2 Other States ,900 3, ,300 4,700 2,600 28,815 7,000 10,200 3,300 16, ,800 2,700 17,985 76,885 18,000 17,600 7,100 36,000 27,600 10,700 7,700 46, , , ,440 11, , ,700 34, ,960 US 1 CT, ME, MA, NH, NJ, RI, and VT. 2 Estimates not available for all sales classes. 3 DE, MD, and WV. 4 AK, AZ, HI, NV, and WY. 127, , , ,090 February NASS, USDA
13 Economic Sales Class $ - $2,499 $ - $4,999 $5,000 - $9,999 $10,000 - $19,999 $20,000 - $39,999 $40,000 - $99,999 $100,000 - $249,999 $250,000 - $499,999 $500,000 + Percent of Farms, Land in Farms, and Average Size Farm: By Economic Sales Class, United States, Farms Percent of Land in Farms Average Size Farm (Acres) ,064 1,588 2, $ - $2,499 $ - $4,999 $5,000 - $9,999 $10,000 - $24,999 $25,000 - $49,999 $50,000 - $99,999 $100,000 - $249,999 $250,000 - $499,999 $500,000 - $999,999 $, ,158 1,564 2,205 3, $ - $2,499 $ - $4,999 $5,000 - $9,999 $10,000 - $24,999 $25,000 - $49,999 $50,000 - $99,999 $100,000 - $249,999 $250,000 - $499,999 $500,000 - $999,999 $, ,161 1,708 1,872 3, Economic Sales Classes changed for 2001 to standard government groupings. 436 February NASS, USDA
14 AL AK AZ AR CA CO CT DE FL GA HI ID IL IN IA KS KY LA ME MD MA MI MN MS MO MT NE NV NH NJ NM NY NC ND OH OK OR PA RI SC SD TN TX UT VT VA WA WV WI WY Average Size Farm: By State and United States, State Acres Acres Acres 191 1,586 3, , , , , , , ,586 3, , , , , , , ,559 3, , , , , , , ,761 US February NASS, USDA
15 Reliability of Data in this Report Survey Procedures: Data are collected by the National Agricultural Statistics Service (NASS) during the June Agricultural Survey using sampling procedures to ensure every farm and ranch has a chance of being selected. NASS uses a multiple frame approach to measuring farms and land in farms. An area sampling frame is built for every state that divides all land into segments. A sample of segments, designed for the state, is selected and enumerated in early June. Highly trained interviewers locate each sampled segment and identify every farm and ranch operating land in the segment and the number of acres in each operation. These data are used to compute estimates of farm numbers and land in farms. Additionally, all farms found in the segments are checked against a list of farms and ranches maintained by NASS to determine if the farm is on the list. Operations not on the list provide a measure of incompleteness of the list. These data are combined with data collected from a sample selected from the list to calculate estimates of farms and land in farms. Estimation Procedures: Data are checked for reasonableness and consistency and summarized for each state. State estimates are aggregated to regional and national totals for Headquarters review. State Statistical Offices perform a thorough review of their survey results and historical data relationships and recommend official estimates. Headquarters establishes regional and national estimates and ensures that state estimates are in balance with the Regional and National numbers. Revision Policy: Estimates are subject to revision the following year and following review of the five-year Census of Agriculture. The basis for revision must be supported by additional data which directly affects the level of the estimate. A historical publication with revisions for was published January 19, Reliability: Two types of errors, sampling and nonsampling, are possible in an estimate based on a sample survey. Both types affect the "precision" of the estimates. Sampling error occurs because a complete census is not taken. The sampling error measures the variation in estimates from the average of all possible samples. An estimate of 100 with a sampling error of 1 would mean that chances are 19 out of 20 that the estimates from all possible samples averaged together would be between 98 and 102; which is the survey estimate, plus or minus two times the sampling error. The sampling error expressed as a percent of the estimate is called the relative sampling error. The relative sampling error for the U.S. number of farms and land in farms is just above 1.5 percent. The sampling error for total number of farms and total land in farms is less than the sampling error for each component of the total, such as number of farms by economic sales class. Relative sampling errors by economic sales class generally ranged from 1.2 to 4.7 percent for number of farms and 2.6 to 9.8 percent for land in farms at the U.S. level. Nonsampling errors can occur in complete censuses as well as sample surveys. They are caused by the inability to obtain correct information from each person surveyed, differences in interpreting questions or definitions, and mistakes in coding or processing the data. Special efforts are taken at each step of the survey to minimize nonsampling errors. February NASS, USDA
16 Terms and Definitions A farm is any place from which $ or more of agricultural products were produced and sold, or normally would have been sold, during the year. Government payments are included in sales. Ranches, institutional farms, experimental and research farms, and Indian Reservations are included as farms. Places with the entire acreage enrolled in the Conservation Reserve Program (CRP), Wetlands Reserve Program (WRP), or other government programs are counted as farms. The definition of a farm was first established in 1850 and has changed nine times since. The current definition was first used for the 1974 census. Land in farms consists of agricultural land used for crops, pasture, or grazing. Also included is woodland and wasteland not actually under cultivation or used for pasture or grazing, provided it was part of the farm operator s total operation. Land in farms includes acres in the Conservation Reserve, Wetlands Reserve Programs, or other government programs. Land in farms includes land owned and operated as well as land rented from others. Land used rent free is included as land rented from others. All grazing land, except land used under government permits on a perhead basis, is included as land in farms provided it was part of a farm or ranch. Land under the exclusive use of a grazing association is reported by the grazing association and included as land in farms. All land in American Indian reservations used for growing crops or grazing livestock is included as land in farms. Land in reservations not reported by individual American Indians or non-native Americans is reported in the name of the cooperative group that used the land. In many instances, the entire American Indian reservation is reported as one farm. Economic sales classes are based on the gross value of agricultural products sold. Government program payments from the previous year are also included. February NASS, USDA
17 Farm Definition History The definition of a farm has remained the same since Activities included as agriculture, however, have undergone modification in recent years. Beginning in 1995, operations having 5 or more horses or ponies and no other agricultural sales were counted as horse farms. An operation with 1 or more horses with agricultural sales of at least $, qualified as a farm. Two industries, maple syrup and short rotation woody crop farms, were added beginning in 1997 as a result of the new North American Industry Classification System (NAICS). These changes were made to achieve comparability with the Census of Agriculture farm definition. All the changes in the farm definition beginning in 1995 were carried back to 1993 and included in the estimates. These changes bring comparability between the Census of Agriculture data and the annually published NASS estimates. Because of these changes in the farm definition, the official estimates show a level difference in the number of farms between 1992 and 1993 in some states. To further align the counting of farms with the Census of Agriculture, places with 100 acres or more of pasture only in 2002 were included in farm and land in farm numbers. Year Minimum Criteria for FARM Definition, Present and Enumeration of Apiaries and Fur Farms Acres in Place Value of Agricultural Products (Produced) Value of Sales of Agricultural Products Required some Agricultural Operations Apiaries and Fur Farms Enumerated Present $ or more 1959 Less than or more 1954 Less than 3 3 or more 1950 Less than 3 3 or more Less than 3 3 or more 1930 Less than 3 3 or more 1925 Less than 3 3 or more Less than 3 3 or more Less than 3 3 or more $150 or more $150 or more $250 or more $250 or more $250 or more $250 or more $250 or more $50 or more $150 or more $150 or more $500 or more X X X X X X Apiaries Fur Farms Apiaries Fur Farms Apiaries Apiaries Apiaries Apiaries $100 or more Apiaries 1840 February NASS, USDA
18 Released February 28, 2003, by the National Agricultural Statistics Service (NASS), Agricultural Statistics Board, U.S. Department of Agriculture. For information on "" call Daryl Brinkman at , office hours 7:30 a.m. to 4:00 p.m. ET. The next "" report will be released February, The United States Department of Agriculture (USDA) prohibits discrimination in all its programs on the basis of race, color, national origin, gender, religion, age, disability, political beliefs, sexual orientation, and marital or family status. (Not all prohibited bases apply to all programs.) Persons with disabilities who require alternative means for communication of program information (braille, large print, audiotape, etc.) should contact the USDA s TARGET Center at (voice and TDD). To file a complaint of discrimination, write USDA, Director, Office of Civil Rights, Room 326-W, Whitten Building, 1400 Independence Avenue, SW, Washington, D.C., , or call (voice or TDD). USDA is an equal opportunity provider and employer. ACCESS TO REPORTS!! For your convenience, there are several ways to obtain NASS reports, data products, and services: INTERNET ACCESS All NASS reports are available free of charge on the worldwide Internet. For access, connect to the Internet and go to the NASS Home Page at: Select Today s Reports or Publications and then Reports Calendar or Publications and then Search, by Title or Subject. SUBSCRIPTION All NASS reports are available by subscription free of charge direct to your address. Starting with the NASS Home Page at click on Publications, then click on the Subscribe by button which takes you to the page describing delivery of reports. Finally, click on Go to the Subscription Page and follow the instructions. AUTOFAX ACCESS NASSFax service is available for some reports from your fax machine. Please call , using the handset attached to your fax. Respond to the voice prompts. Document 0411 is a list of available reports. - PRINTED REPORTS OR DATA PRODUCTS CALL OUR TOLL-FREE ORDER DESK: (U.S. and Canada) Other areas, please call FAX: (Visa, MasterCard, check, or money order acceptable for payment.) ASSISTANCE For assistance with general agricultural statistics or further information about NASS or its products or services, contact the Agricultural Statistics Hotline at , 7:30 a.m. to 4:00 p.m. ET, or nass@nass.usda.gov.