Southern Africa. Monthly Food Price Update. November Highlights:
|
|
|
- Rosamund Stanley
- 5 years ago
- Views:
Transcription
 Agbiz, www.agbiz.co.za.")

1 Southern Africa Monthly Food Price Update November 2016 Highlights: The National Crop Estimate Committee s data showed that RSA 2016/17 total maize plantings could increase by 27% from the previous season to 2.46 million hectares (more specifically, white and yellow maize plantings could increase by 43% y/y and 8% y/y to 1.46 million and 1.01 million hectares, respectively) Agbiz, RSA maize imports for the week ending 21 October 2016 came in at tons (31% share was white maize from Mexico and 69% share was yellow maize from Argentina and Romania). Therefore, RSA 2016/17 yellow maize imports reached tons, which is 46% of the seasonal import forecast. At the same time, RSA 2016/17 white maize imports reached tons - 41% of the seasonal import forecast Agbiz, September s month-on-month (m-o-m) maize retail prices saw mixed maize price trends. Increases were experienced in Tanzania of 12.9 per cent, Zambia (6.1 per cent), Mozambique (4.3 per cent) South Africa (1 per cent), Swaziland (0.4 per cent) and Malawi (0.1 per cent). Only Lesotho and Zimbabwe saw decreases in the national average maize retail price (-0.4 and -6.7 per cent respectively). DRC recorded an increase in its national average price of cassava flour by 10.8 per cent while RoC saw a decrease of -5.1 per cent between its national average September and October prices. Average national maize prices remain above their five-year-average levels for October (between 13 per cent in Zimbabwe to 163 per cent in Mozambique), highlighting shortage of maize on markets across southern Africa. WFP Alert on Price Spikes (ALPS): 78 per cent (101 out of 130) of ALPS monitored markets in southern Africa were either in Stress, Alert or Crisis in October 2016; up from 77 per cent of markets in September The countries with the highest reported number of ALPS monitored markets in Alert and Crisis across southern Africa In October were Malawi (95 per cent) and Mozambique (100 per cent). Current International Food Staple Price Trend FAO Food Price Index (FPPI) averaged in October 2016, up 1.2 points (0.7 per cent) from September and 9.1 per cent above October 2015 (Figure 1). The October FPPI value was slightly above its September 2016 value due to the sharp rises of sugar and dairy values, the modest increase in the cereal index and the declines in oils and meat indices. Fig 1: FAO Food Price Index and Food Commodity Price Index The FAO Cereal Price Index for October averaged points, up 1.4 points (1 per cent) from September and 9.6 per cent below its October 2015 value. This marked the first increase in three months and has been driven by the tightening of high quality wheat supplies and the accelerated pace of sales by USA of its maize quotations. Source: FAO 1 P a g e
2 Wholesale white maize prices for October 2016 in South Africa were at Rand/MT, falling by 9.6 per cent compared to September 2016 and 27 per cent since May 2016 (Figure 2). The fall in the price of maize is heavily influenced by South Africa s ability to import large volumes of maize and the good rains in October which have indicated the likelihood of a possible good harvest for the season. Nevertheless, the price of maize remains 47 per cent above five-year average levels. South Africa s high maize prices have been primarily driven by the region s deficit in cereals harvest for (5.1 million tonnes for maize and 9.3 million tonnes for cereals) and the high demand for maize in the region. Currency devaluations across the region are making imports more expensive and high transportation costs, especially for land-locked countries, are affecting maize sales prices. The anticipated increase in oil prices will fuel the increases further. Figure 2: Wholesale trend price of white maize in South Africa compared to the FAO Food Price Index (October 2016) Source: WFP Current Regional Food Staple Price Trend: October saw mixed m-o-m maize retail price trends. The following countries saw national average maize price increases: Tanzania (12.9 per cent), Zambia (6.1 per cent), Mozambique (4.3 per cent) South Africa (1 per cent), Swaziland (0.4 per cent) and Malawi (0.1 per cent). While only Lesotho and Zimbabwe experienced national average maize retail price decreases of -0.4 and -6.7 per cent, respectively. DRC saw an m-o-m increase in its national average price of cassava flour by 10.8 per cent while RoC saw a decrease of -5.1 per cent between its national average September and October prices (Table 1). Across southern Africa even though following a decreasing trend, the price of maize in October continued to remain above five-year-average levels for the time of year: Mozambique per cent, Malawi per cent (four year average), Zambia 56.1 per cent (four year average), Swaziland 55.4 per cent, South Africa 46.8 per cent, Lesotho 37.3 per cent, Tanzania 21.1 per cent, and Zimbabwe 13 per cent (Table 1). National average cassava flour prices in DRC and RoC were per cent and per cent lower than the five and three year averages respectively. Table 1: RBJ retail staple food price trends for white maize grain October 2016 Current retail price compared to 5 year Oct Nominal retail price in % change retail price Country average price (%) Oct 2016 (USD/KG) since Sept 2016 Nominal Real Congo (RoC)*** Cassava Flour NA Congo (DRC)** Cassava Flour NA Lesotho (Maize Meal) Madagascar*** (Local Rice) NA NA NA NA Malawi*** Mozambique Swaziland (Maize Meal) NA Tanzania* Zambia*** Zimbabwe NA South Africa* (Durban) Source: WFP VAM Portal 1 and FAO Food Price Monitoring Analysis 2 * Wholesale ** 3 year average *** 4 year average 1 This is WFP s centralized system for reporting of national and regional food security and vulnerability analysis monitoring information related to chronic and acute food insecurity. 2 FAO s Food Price Monitoring and Analysis Tool is FAO s online food price monitoring, analysis and reporting system. 2 P a g e
3 Expected Regional Staple Food Price Trend: South Africa, the region s largest maize producer, has seen a continuous drop in maize prices since February 2016, falling by 29 per cent over this period. With favourable rains for the planting season as well as continued maize imports from oversea markets and a strengthening Rand versus other currencies, this downward trend is likely to continue. DRC* Malawi Mozambique Tanzania Zambia Zimbabwe The situation in other markets across southern Africa is however very different. Mozambique s national average maize price continues increasing unabatedly by around 5 per cent per month while Swaziland, Lesotho and Malawi are experiencing flat maize prices. However, prices remain above the five-year average for the time of year. Zimbabwe, on the other hand has experienced a significant fall (-6.7 per cent) in its national average maize grain retail price, possibly led by the weakening US Dollar versus the Rand and Zambia restricting exportation of only old maize stock. The country s current average national retail price of maize grain is now only 13 per cent above its five-year average for the time of year, from 22.8 per cent in September Tanzania and Zambia have over the past couple of months started experiencing significant increases in their national average retail price of maize highlighting increasing stress on markets caused by higher demand and lower supply levels. Tanzania saw its national average wholesale price for maize grain increase by 13 per cent between September and October 2016 while Zambia saw its national average retail price for maize grain increase by 6 per cent over the same period. Zambia s price level now stands at 56 per cent above its five-year average levels for the time of year and Tanzania stands at 21 per cent. It is very likely that maize prices will continue to rise in both Tanzania and Zambia as both formal and informal demand for maize will increase from southern Africa s maize deficit countries as the lean season takes hold. Alert on Price Spikes (ALPS): ALPS 3 is an indicator that monitors local food commodity prices and measures the extent to which food commodities found on local markets experience unusually high food price levels for the time of year. In September 2016, 17 ALPS markets across southern Africa were found to be in Alert. This is down 26 per cent since September. Out of the 17 markets in Alert, 14 were in Zambia, 2 were in Tanzania and 1 was in Malawi. The number of markets in stress remained unchanged since August at 26. Furthermore, 58 monitored markets across 3 countries in southern Africa were found to be in Crisis, up from 55 in September (5 per cent) and 53 in August (9 per cent). Out of the markets in Crisis, 39 were in Malawi (up 5 per cent since September), 12 were in Zambia (up 20 per cent since September), and 7 were in Mozambique (unchanged since August). The number of markets reporting normal price levels of maize fell from 31 in September to 29 in October (-6.5 per cent). In general 78 per cent (101 out of 130) of ALPS monitored markets in southern Africa were either in Stress, Alert or Crisis in October (Table 2), up by 1 per cent compared to September, confirming low availability of maize in the region. Maize prices in the region will remain above their average trend for the time of year at least until the next harvest (April-June 2017). The two countries in the region with the most monitored maize markets in Crisis were Malawi (95 per cent) and Mozambique (100 per cent). Table 2: Status of Monitored Food Markets in Southern Africa in October 2016 ALPS Price Mode Total markets for Southern Africa % of total ALPS monitored markets in Southern Africa Normal NA % Stress NA % Alert NA % Crisis NA % Total monitored markets per country NA 130 NA Source: WFP *Cassava flour 3 ALPS classifies food price levels through four categories: Normal, Stress, Alert and Crisis. Under Normal the price is less than 0.25 standard deviations away from the mean for the time of year; under Stress the price is between 0.25 and 1 standard deviation from the mean for the time of year; under Alert the price is between 1 and 2 standard deviations from the mean for the time of year; and under Crisis the price is above 2 standard deviations from the mean for the time of year. More information can be found on the ALPS website: 3 P a g e


4 The above map visualizes the data from Table 2. The map highlights that most districts in Malawi are in ALPS crisis status with regard to maize retail prices. The map also highlights districts in Mozambique as well as significant number of districts in Zambia to be in ALPS crisis or alert status. Compared to the previous month there are four more districts in Zambia which have markets in Crisis. The districts in white are not covered by ALPS analysis. Focus on Mozambique: October saw a continued increase in the retail price level of white maize across Mozambique as prices rose by a national average of 4.3 per cent compared to September Prices have also continued to increase in Gorongoza, a prime maize market in Mozambique. In this market, prices rose by 16.6 per cent, nearly four times more than the national average. In October, white maize grain retail prices in Gorongoza stood at 251 per cent above its five-yearaverage price for the time of year, highlighting the crisis level of this prime maize market and outlining a desperate food access situation for the country (Figure 3). Maize prices have increased by 41 per cent since May 2016 compared to a fiveyear average of 37 per cent for the same period. To note Mozambique generally experiences high fluctuations in the price of maize throughout the year. On average prices in Mozambique fluctuate by 60 per cent between June and February. It is therefore very likely that prices will continue to rise over the next months, hereby remaining above five year average levels. Moreover, a high and increasing inflation rate (25.5 per cent in October 2016) and a free-falling national currency (The Metical has depreciated in value by 28 per cent in one year, Nov 2015 Nov 2016) is making food imports more expensive. Figure 3: ALPS Maize Grain Market Price Trend in Gorongoza (Mozambique) compared to Month Average Price Levels Source: WFP ALPS 4 P a g e
 in October 2016 compared to September 2016.")
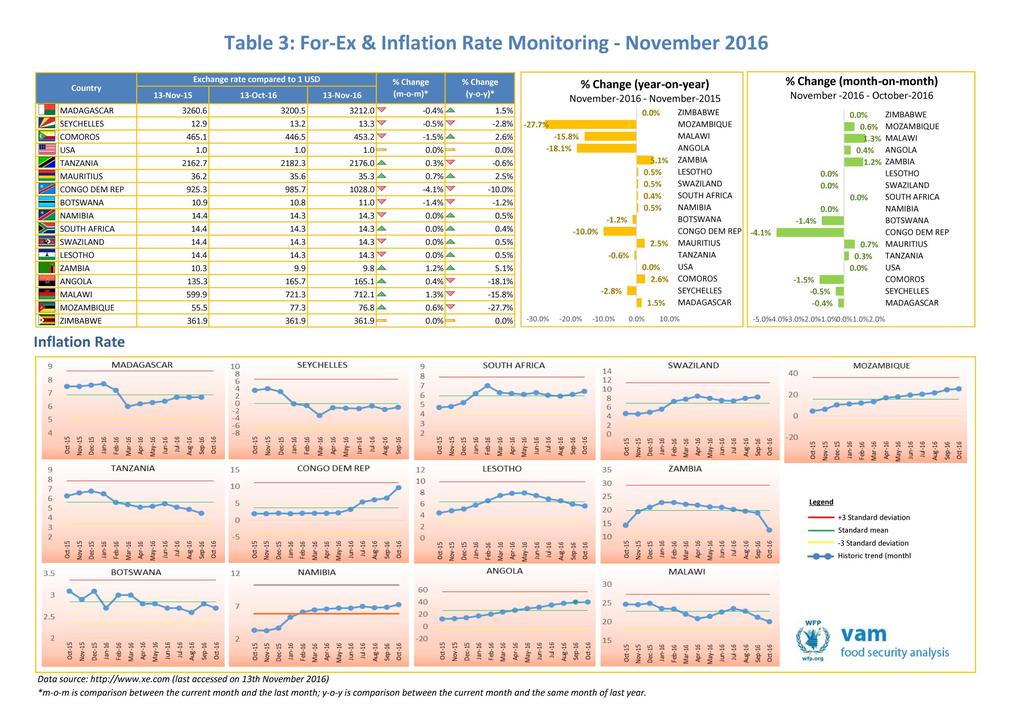
5 Focus on Malawi: Figure 4 illustrates the retail price trend of white maize over time for Lunzu market, a prime maize grain market in Malawi. The national average retail maize grain price in Malawi has increased slightly (0.1 per cent) in October 2016 compared to September The maize price increase was also moderate in Lunzu market, increasing by 0.9 per cent over the same time period. The price of maize grain seems to have plateaued since August 2016, increasing by only 1.3 per cent. However, Lunzu market usually (four year average) experiences a retail maize price decrease of about 5 per cent during the same period, indicating that the market is currently behaving abnormally. Lunzu market s maize grain price remains well above its four-year average for the time of year (160 per cent above October average). With the lean season taking hold, prices are expected to remain above their four-year-average levels for the time of year. Figure 4: ALPS maize grain retail market price trend in Lunzu (Malawi) compared to average price levels for the time of year Source: WFP ALPS Plans/Upcoming Assessments in 2016: Chronic IPC training and analysis in Swaziland in November. Madagascar, Swaziland and Zimbabwe are planning market assessments in October and November. Regional Exchange rate patterns compared to the US Dollar: Year-on-year foreign exchange rates vis-à-vis the US Dollar have continued to fall across southern Africa. Only South Africa (includes Lesotho, Namibia and Swaziland), Madagascar, Mauritius, Comoros and Zambia saw their national currency appreciate compared to the US Dollar between November 2015 and November 2016 (from 0.4 per cent in South Africa to 5.1 per cent in Zambia). All other countries in the region saw their currency devalue against the US Dollar (from -0.6 per cent in Tanzania to per cent in Mozambique) between November 2015 and November 2016 (Table 3). M-o-m exchange rate changes instead showed different trends with improvements in the Angolan (0.4 per cent), Malawian (1.3 per cent), Mozambican (0.6 per cent) and Tanzanian (0.3 per cent) currencies vis-à-vis the US Dollar. Botswana, Comoros and DRC were the currencies seeing the worst m-o-m devaluations with -1.4 per cent, -1.5 per cent and -4.1 per cent respectively (Table 3). Inflation rates: Countries across southern Africa registered the following inflation rates in November 2016: Angola (40 per cent), Mozambique (25.5 per cent), Malawi 20.1 (per cent), Zambia (8.8 per cent), Namibia (7.3 per cent), Tanzania (4.8 per cent), and Botswana (3.3 per cent). Southern Africa inflation rate trends can be viewed in Table 3 below. 5 P a g e
6 6 P a g e