Agricultural Weather Assessments World Agricultural Outlook Board. World Agricultural Outlook Board Washington D.C., U.S.A.
|
|
|
- Dustin Fox
- 5 years ago
- Views:
Transcription
1 Agricultural Weather Assessments World Agricultural Outlook Board Harlan Shannon Agricultural Meteorologist U.S. Department of Agriculture World Agricultural Outlook Board Washington D.C., U.S.A.

 soil moisture measurements/models reservoir/river levels crop progress/condition reports")

2 Historically, USDA has relied on many products to help identify drought areas rainfall & temperature observations drought indices (e.g., PDSI, CMI, SPI) soil moisture measurements/models reservoir/river levels crop progress/condition reports No one product alone was adequate, but decision makers needed the bottom line! TRILLION GALLONS CALIFORNIA RESERVOIR STORAGE J F M A M J J A S O N D AVG In 1999, government and university scientists began working together to produce the U.S. Drought Monitor (USDM), a single product that provides a snapshot of the spatial extent & intensity of drought in the U.S. each week


3 Drought experts from five agencies are responsible for coordinating Drought Monitor production each week On a rotating basis, an individual from one of these agencies will serve as Drought Monitor author for the week, and typically authors the product for 2 consecutive weeks


4 Each Monday, author consults data from numerous sources observational networks model output satellite and radar imagery subjective reports Author uses these data to prepare a first draft of the USDM for that week Draft distributed via to fellow authors and climate and water experts from around the country


5 Local feedback is critically important to the success of the Drought Monitor provide ground truth report on impacts comes in many forms USDM Listserve has approx. 350 participants local NWS & USDA offices state climate offices state drought task forces regional climate centers I'm a little concerned that the eastern sections of the Appomattox Basin in Virginia have slipped out of D1. Precip departures, especially over 90 days, are not horrible, but there is still a deficit. And with streamflows running quite low, groundwater running low, and a drought watch in effect, I think that the D1 should be expanded eastward to include all of Buckingham, all of Campbell, Cumberland, southwest Powhatan

6 All states now have at least 1 official participant except Rhode Island.

7 DRAFT 1 DRAFT 2 DRAFT 3? DRAFT 4? DRAFT 5? Through iterative process, author prepares and distributes additional drafts of the USDM to converge on best product possible Input accepted through Wednesday Finished map and accompanying text summary posted every Thursday at 0830 LT on the USDM web site: (
8

9 The very first U.S. Drought Monitor!! It was experimental, and developed partially in response to intensifying dryness in the eastern U.S. and across portions of the West. The map was created in CorelDRAW (basic drawing software)

10 Summer 1999 Authors revised the colors and adjusted the map area. Map then presented to senior-level government officials at a White House Briefing. They liked it so much

11 the following week, it became operational, making this the first official U.S. Drought Monitor!

12 The color issue was finally resolved in mid-september. The USDM still had a Watch and Forecast component
.")
13 December 2000 Format adjusted, color scale further improved, forecast component dropped, D0 goes from Watch to Abnormally Dry (going into and coming out of drought)

14 August authors make a transparent switch from CorelDRAW to GIS to create the map. There was a steep learning curve, but made the USDM a leader on the GIS front and would pay big dividends down the road


15 As a result, several authors began incorporating GIS weather and data directly into the map-editing process; consequently, accuracy and detail increase over the next several years no more eyeballing it!
, removing ambiguity and confusion that was repeatedly reported.")
16 September authors changed the Drought Impact Types from A (Agricultural) and H (Hydrological) to S (Short-Term) and L (Long- Term), removing ambiguity and confusion that was repeatedly reported
17 Recently, the NDMC changed the final map layout to make sure the non-conus areas are clearly depicted as such, and are on their own scale
18
19
20
21 United States Winter Wheat Areas Located in Drought Percent Mar Apr Apr Apr Apr Apr May May May May Jun Jun Jun Jun Jul Jul Jul Jul Jul Aug Aug Aug Aug Sep Sep Sep Sep Oct Oct Oct Oct Oct Nov Nov Nov Nov Dec Dec Dec Dec Dec Jan Jan Jan Jan Feb Feb Feb Feb Mar Mar Mar Mar Date Moderate or more intense drought (D1+) Agricultural Weather Assessments World Agricultural Outlook Board Severe or more intense drought (D2+) Extreme or more intense drought (D3+) Exceptional drought (D4)
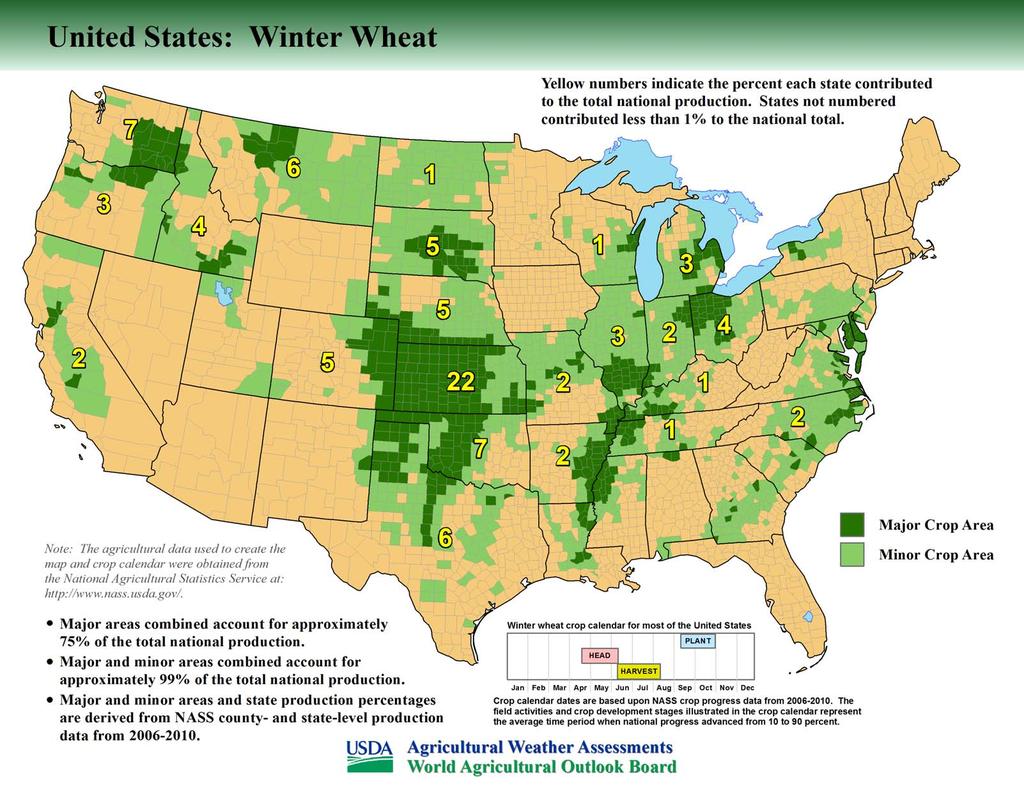
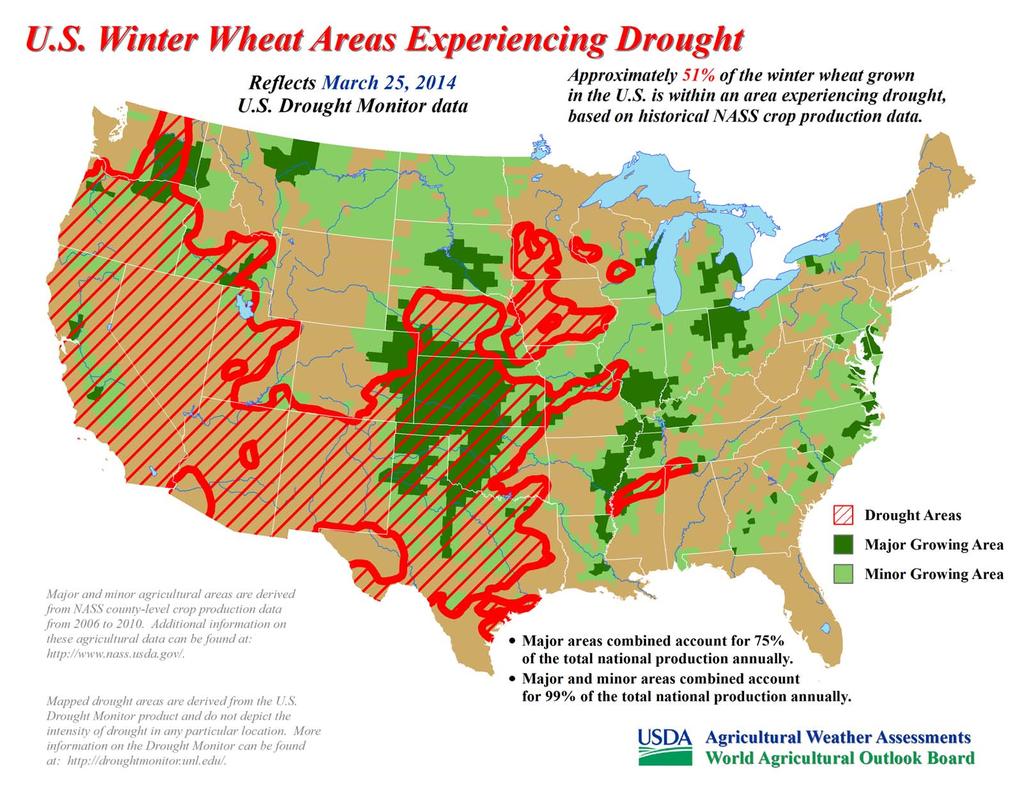
22 Crop production percentages and associated drought intensities Approximate Percentage of Winter Wheat Located in Drought * March 25, Kansas (22) Oklahoma (7) Washington (7) Montana (6) Texas (6) Colorado (5) Nebraska (5) South Dakota (5) Idaho (4) Ohio (4) Illinois (3) Michigan (3) Oregon (3) Arkansas (2) California (2) Indiana (2) Missouri (2) North Carolina (2) United States * Drought percentages were calculated from U.S. Drought Monitor (USDM) data for the above date. More information on the USDM is available at Percent in Moderate Drought (D1) Percent in Extreme Drought (D3) Percent in Severe Drought (D2) Percent in Exceptional Drought (D4) Agricultural Weather Assessments World Agricultural Outlook Board State contributions to national production (percentages in parentheses) are based upon National Agricultural Statistics Service (NASS) 5-year averages from More information on NASS data can be found at

23 U.S. Cattle Areas Experiencing Drought Reflects September 13, 2011 U.S. Drought Monitor data Approximately 37% of the domestic cattle inventory is within an area experiencing drought, based on NASS 2007 Census of Agriculture data. Drought Areas Major and minor agricultural areas are based on NASS 2007 Census of Agriculture data. Counties shaded in gray contain data that are not published by NASS, and hence were not used in delineating the major and minor agricultural areas. Additional information on these agricultural data can be found at: Mapped drought areas are derived from the U.S. Drought Monitor product and do not depict the intensity of drought in any particular location. More information on the Drought Monitor can be found at: Major areas combined account for 75% of the total national inventory. Major and minor areas combined account for 99% of the total national inventory. Major Livestock Area Minor Livestock Area Agricultural Weather Assessments World Agricultural Outlook Board Evolution of Texas drought during the past 12 months Texas Drought Texas Drought Texas Drought Texas Drought Reflects September 7, 2010 U.S. Drought Monitor data Reflects January 4, 2011 U.S. Drought Monitor data Reflects May 3, 2011 U.S. Drought Monitor data Reflects September 13, 2011 U.S. Drought Monitor data Exceptional Drought (D4) Extreme Drought (D3) Severe Drought (D2) Moderate Drought (D1) Agricultural Weather Assessments World Agricultural Outlook Board Exceptional Drought (D4) Extreme Drought (D3) Severe Drought (D2) Moderate Drought (D1) Agricultural Weather Assessments World Agricultural Outlook Board Exceptional Drought (D4) Extreme Drought (D3) Severe Drought (D2) Moderate Drought (D1) Agricultural Weather Assessments World Agricultural Outlook Board Exceptional Drought (D4) Extreme Drought (D3) Severe Drought (D2) Moderate Drought (D1) Agricultural Weather Assessments World Agricultural Outlook Board
24
25 U.S. Drought Monitor Usage by FSA Food, Conservation, and Energy Act of 2008 ( Farm Bill ) authorizes the Livestock Forage Disaster Program (LFP) Grazing loss because of drought on owned or leased grazing land or pastureland that is physically located in a county experiencing: D2 intensity for at least 8 consecutive weeks during normal grazing period will be eligible to receive an amount equal to 1 monthly payment D3 intensity during the normal grazing period will be eligible to receive an amount equal to 2 monthly payments D3 intensity for at least 4 weeks or a D4 intensity any time during the grazing period will be eligible to receive an amount equal to 3 monthly payments
26 U.S. Drought Monitor Usage by FSA Agricultural Act of 2014 ( Farm Bill ) re-authorizes the Livestock Forage Disaster Program (LFP) Grazing loss because of drought on owned or leased grazing land or pastureland that is physically located in a county experiencing: D2 intensity for at least 8 consecutive weeks during normal grazing period will be eligible to receive an amount equal to 1 monthly payment D3 intensity during the normal grazing period will be eligible to receive an amount equal to 3 monthly payments D3 intensity for at least 4 weeks or a D4 intensity any time during the grazing period will be eligible to receive an amount equal to 4 monthly payments D4 intensity for at least 4 weeks during the normal grazing period will be eligible to receive an amount equal to 5 monthly payments
27 2008 Farm Bill Livestock Forage Disaster Program (LFP) Payouts (financial assistance to producers who suffered grazing losses due to drought or fire on or after January 1, 2008, and before October 1, 2011, during the calendar year in which the loss occurs): 2008 calendar year: $165,540, calendar year: $ 98,739, calendar year: $ 33,334, calendar year: $180,950, calendar year: $ 0 LFP total, : $478,565,333
28 Retroactive LFP Payouts The 2014 Farm Bill contains permanent livestock disaster programs including the Livestock Forage Disaster Program, which will help producers in California and other areas recover from the drought. At President Obama s direction, USDA is making implementation of the disaster programs a top priority and plans to have the programs available for sign up in 60 days. Producers will be able to sign up for the livestock disaster programs for losses not only for 2014 but for losses they experienced in 2012 and While these livestock programs took over a year to get assistance out the door under the last Farm Bill, USDA has committed to cut that time by more than 80 percent and begin sign-up in April. California alone could potentially receive up to $100 million for 2014 losses and up to $50 million for previous years.
29 Thank you! Agricultural Weather Assessments World Agricultural Outlook Board