Assessing the risk of farmland abandonment in the EU
|
|
|
- Baldric Clark
- 5 years ago
- Views:
Transcription
1 Assessing the risk of farmland abandonment in the EU Technical assistance from JRC to DG AGRI to define key factors and drivers, process datasets, and provide results Administrative arrangement #AGRI
2 Background on AE indicators IRENA operation Indicator reporting on the integration of environmental concerns into Agricultural policy Objective: to develop and compile the set of 35 agri-environmental indicators for EU-15 (Nuts2/3) Outputs: indicator factsheets (42 indicators and sub-indicators) and their corresponding data sets, report and evaluation. Memorandum of Understanding Signed in April 2008 by DG AGRI, DG ENV, DG ESTAT, JRC and the EEA to develop and maintain a system of AEIs. AEI 17 Marginalisation AEI 14: Risk of Farmland abandonment [COM(2006)508] Monitoring frame, 28 AEI were listed for the EU-27 Monitoring the integration of environmental concerns into the Common Agricultural Policy To provide information on the farmed environment To track the impact of agriculture on the environment To assess the impact of agricultural and environmental policies on environmental management of farms To inform agricultural and environmental policy decisions To illustrate agri-environmental relationships to the broader public
3 Who is doing what DG AGRI Leader Responsible for the AEI14 Steering the study Overall coordination JRC Scientific and technical support Coordination of the expert panel, ) Conceptual and methodological improvement and data availability Progress reports Drafting and updating the factsheet Compiling the indicator Preparatory work (report FLA (2008) Facsheet and Map of risk by end 2012 Expert Panel Support on the development of the indicator and its validation

 will be set-up to give the best possible proxy of the risk.")
4 JRC Preparatory work Complex situation: - FLA is local-specific, can vary significantly at sub-region level. - No clear-cut division among factors which could affect FLA, depend on their interaction. - FLA tends to be minor in some MS but can occur everywhere. Option proposed: Drivers to be classified into a limited number of blocks corresponding to the main dimension of the FLA. Related indicators (definition, threshold, weight and interaction) will be set-up to give the best possible proxy of the risk. Unsuitable biophysical conditions Low Farm stability and viability Adverse regional context

5 JRC Preparatory work The complete picture Discussed, Revised and updated by experts

6 The expert panel Objectives: a. Conceptualise definition of farmland abandonment b. Identify most relevant factors for the risk of farmland abandonment c. Proposals for developing the indicator taking into account data availability Based on literature review and on experts meetings, a list identifying experts for the panel was set and completed by DG AGRI. 12 experts confirmed their interest in being part of the panel (from Universities, Ministries, Institutes, Associations and European Organisations) 3 meetings took place at JRC
7 Expert panel exercise Refinement of the list of drivers Based on factsheets and first screening, list of drivers was refined. Rationale, calculation options, thresholds and identification of data. List of selected criteria: Farm income under regional average Low investment in the farm Age of farm holder (> 65 years) Low farmer qualification (education/training) Remoteness and low population density Small farm size Farm enrolment in specific schemes Weak land market Previous trend of FLA (methodology from JRC report)
. = Studying the risk of occurrence of a local phenomenon at EU scale, challenging and heavy process!")
8 Challenges Indicator must be calculated on the basis of available data at EU level, based on harmonised methodology. + Farmland abandonment process occurring at local level (infra NUTS3). + Risk assessment and not only measurement (past FLA). = Studying the risk of occurrence of a local phenomenon at EU scale, challenging and heavy process! Solagro Literature review, JRC report Most recurrent drivers Expert panel exercise Definition, drivers, methodology and calculation Factsheet
9 Assessing the risk of farmland abandonment in the EU Definition : Farmland abandonment is defined as a cessation of management which leads to biodiversity loss and undesirable changes in ecosystem services (=simpler and more complete, exclusion of marginalisation). Purpose of the indicator: to help assessing the risk of farmland abandonment at EU-27 level(=probability of occurrence) through the identification of the most relevant factors (drivers) and the integration of the meaningful drivers into a Composite Index. The indicator will exclusively address the risk and not the consequences of FLA or the extend to which FLA actually happens.
10 Drivers Weak Land Market: Increase in land sales and rental prices is generally linked to a high incidence of land transactions which typically signals a high demand for agricultural land and hence a lower risk of land abandonment. Low Farm Income: Farmland is typically abandoned as an economic resource when it ceases to generate an income. Although this is not a sole cause, and although it can be triggered by a number of factors, there is a powerful link. Low Investment in the Farm: Investments reflect farm dynamism, its adaptation capacity and expectations about the future. New investments are a signal of a medium/long term strategy and can be proxy for willingness to continue farm activity. Data Source FADN-DG AGRI.L3 FADN-DG AGRI.L3 FADN-DG AGRI.L3 Age of Farm Holder: Farmland abandonment is more likely to occur when the farmer is old and close to retirement. Eurostat public database Low Farmer Qualification: Education/training and use of advisory services can be assumed as a proxy for the professionalism of the farm, and willingness to invest in terms of human capital and knowledge. An Inverse correlation exists between the level of education/training and risk of land abandonment Eurostat public database Previous trend of FLA: It is not possible to study the trend because the results for FSS 2010 will only be available in Remoteness / Low Population Density: Farmland with remote and/or difficult access is more prone to abandonment. Low farm Size: Larger farms can benefit from lower production costs, are more competitive in term of agricultural practices (machinery, better inputs efficiency) and usually more competitive and viable in economical terms. SIRE DB, GISCO DB FSS Eurostat Farm Enrolment in Specific Schemes : Use of the Agri Environment Measure (AEM) scheme. When a large share of AEM uptake, farmers commit to continue farming for a certain period of time, BUT a low level of AEM cannot be a proxy for a risk of abandonment. Eurostat public database 10
11 Data sources: Farm Accountancy Data Network (FADN) DG AGRI.L3 Drivers: Land Market, Farm Income, Investment in the Farm at holding level level of geographic reference: NUTS3 level of processing and reporting selected for the analysis: NUTS2 (NUTS1 for UK and DE) Problems: threshold on the minimum size farm may lead to a certain under-representation of the smallest farms FADN is only statistically representative at NUTS 0, 1 and 2 levels Farm Structure Survey (FSS) EUROSTAT Drivers: Low farm size level of geographic reference: NUTS3 LAU2 processing and results : NUTS3 LAU2 Problems: FSS census data 2010 will only available in No access to micro or local (LAU1-2) FSS data. Last deliverable from ESTAT is missing (Percentage of farms with a UAA under 50% of the NUTS 2 average UAA per holding, by NUTS 3 and by farm-type). 11
12 Data sources: Farm Structure Survey (FSS) Eurostat public database Drivers: Age of Farm Holder, Farmer Qualification, Farm Enrolment in Specific Schemes level of geographic reference: NUTS2 NUTS3 processing and results : NUTS2 Geodatabases: Euro Regional Map road network ( EuroGeographics), Urban Audit cities (2007, DG REGIO), SIRE database (2001, Eurostat), CORINE Land Cover (2006 and 2000, EEA), SRTM mosaic Europe (JRC). Drivers: Remoteness / Population Density level of geographic reference: LAU2 processing and results: LAU2 12
13 Driver 1: Weak land market Data Threshold Method. Rent Paid, including rent for building, quotas, FADN var. SE375. Rented UAA (ha), FADN var. SE030. Total UAA (ha), FADN var. SE025 Results presented using 5 quintiles, having 20% of the distribution in each class. Weighted average value of the rent per ha (euro ha-1) paid by holding. Share of rented land in the total UAA Evaluation Relevant, conceptually sound, complete 13

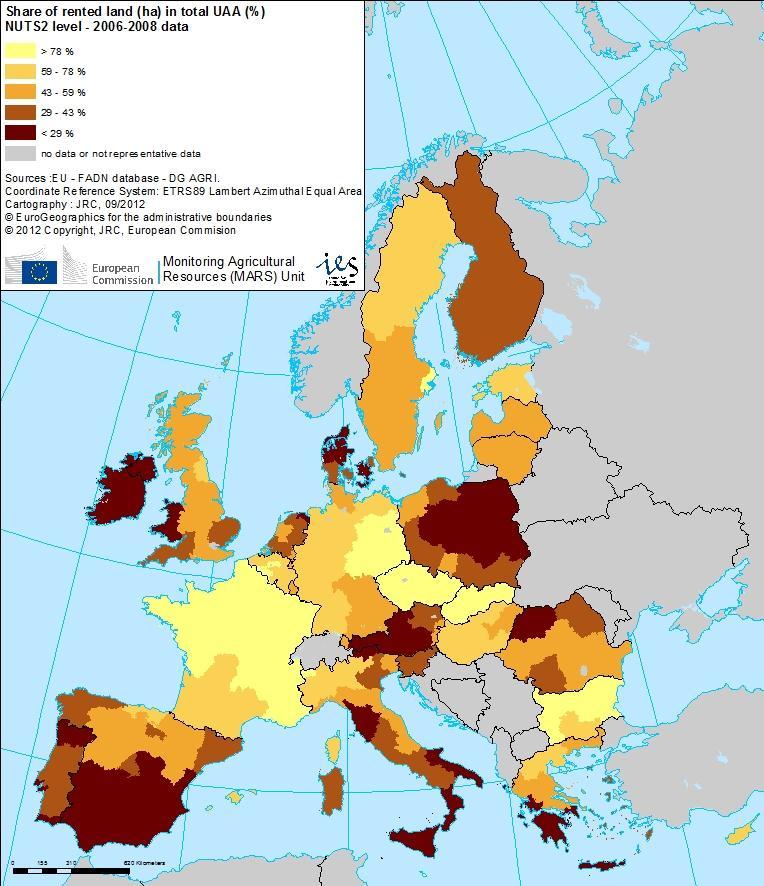
14 Driver 1: Weak land market 14
15 Driver 2: Low farm income Data Threshold Method Evaluation. Farm Net Value Added per Annual Working Unit, FADN Var. SE425. Gross Domestic Product (GDP) at market prices - Euro per inhabitant from Eurostat website Results presented using 5 quintiles, having 20% of the distribution in each class. Weighted average of agricultural income / national GDP Relevant, conceptually sound, complete 11/04/

16 Driver 2: Low farm income 16
17 Driver 3: Low investment level in the farm Data. Total investments before deduction of subsidies, FADN var. GI103IG: covers agric. land, building, rights, forest, machinery, circulating capital. Total UAA (ha), FADN var. SE025 Threshold Method Evaluation Results presented using 5 quintiles, having 20% of the distribution in each class. Weighted average of investment per holding (normalised by physical size) Relevant, low reliability in some MS, some variability 11/04/


18 Driver 3: Low investment level in the farm 18
19 Driver 4: Age of farm holder Data Threshold Method Evaluation. Farmer's (being a natural person) by age from Eurostat public database Results presented using 5 quintiles, having 20% of the distribution in each class. Share of farm holders aged more than 65 years Relevant, low reliability in some MS, some variability 11/04/

20 Driver 4: Age of farm holder 20
21 Driver 5: Low farmer qualification Data Threshold Method Evaluation. Agricultural training of farmer from Eurostat public database (FSS) (Practical experience only / Basic training / Full agricultural training) Results presented in 5 classes. Share (percentage) of farmers with practical experience only Low relevance, low reliability in some MS, some variability 11/04/

22 Driver 5: Low farmer qualification 22
23 Driver 7: Remoteness / low population density Data Threshold. Travel time. Population density Travel time to reach an urban center (> inhabts): > 60 min (tested also for more than 2 hours). Population density: < 50 inhabts / Km2.. Travel time and population density layers combined: > 60 min AND < 50 inhabts / Km2 Method Evaluation. Travel time: GIS network analysis. Population density: at commune level Relevant, conceptually sound, complete, detailed scale 11/04/
 2001 data not at risk Travel time > 60 min; Pop Density < 50 inh/km2 Travel time > 60 min; 50 < Pop Density < 150 inh/km2 30 < Travel time < 60 min; Pop Density < 50 inh/km2 30 < Travel time <")
24 Driver 7: Remoteness / low population density Travel time and population density layers combined Travel time (min.) and Population density (inh./km2) 2001 data not at risk Travel time > 60 min; Pop Density < 50 inh/km2 Travel time > 60 min; 50 < Pop Density < 150 inh/km2 30 < Travel time < 60 min; Pop Density < 50 inh/km2 30 < Travel time < 60 min; 50 < Pop Density < 150 inh/km2 Missing data for Travel time 24

25 Driver 7: Remoteness / low population density Ratio: UAA at risk / UAA total (%) at NUTS2 level Travel time and population density layers combined with UAA at risk UAA at risk =Agricultural areas with Travel time > 60 min AND Pop Density < 50 inh./km2 CORINE LAND COVER used to estimate UAA at LAU2 level. 25
26 Driver 8: Low farm size Data Threshold Method Evaluation. FSS UAA by FT: % holding with UAA per holding below ½ regional average (by FT) at lowest possible geographic level (NUTS3, LAU1, LAU2) Results presented in 5 classes. Regional average (by FT) calculated at NUTS3 level. Relevance, low reliability in some MS, conceptual issues, some variability amongst MS 11/04/
 with UAA below half the NUTS3 average of grazing")
27 Driver 8: Low farm size Share of grazing livestock holdings (percentage) with UAA below half the NUTS3 average of grazing livestock farms 27
 with UAA below half the NUTS3 average of permanent")
28 Driver 8: Low farm size Share of permanent crops holdings (percentage) with UAA below half the NUTS3 average of permanent crops farms 28
29 Driver 9: Farm enrolment in Specific Schemes Data Threshold Method Evaluation. AEM data on organic farming from FSS Eurostat public database Results presented in 5 classes. Share of UAA (percentage) in organic farming (certified). Reliable, conceptual deficiency 11/04/

30 Driver 9: Farm enrolment in Specific Schemes 30
31 The Composite Index Combination of meaningful drivers into an index following a methodology proposed by the OECD (2008). Theoretical aspects Data selection. Drivers should be selected on the basis of their analytical soundness, measurability, country coverage, relevance to the phenomenon being measured and relationship to each other. Normalisation. Drivers should be normalised to render them comparable. Attention needs to be paid to extreme values as they may influence subsequent steps in the process of building a composite index. Weighting and aggregation. Indicators should be aggregated and weighted according to the underlying theoretical framework. Robustness and sensitivity. Analysis should be undertaken to assess the robustness of the composite indicator in terms of, e.g. the choice of weights. Links to other variables. Attempts should be made to correlate the composite index with other published indicators. 31
32 Results: The combination of data selection and normalisation procedures result in 4 scenarios: Drivers meaningful and complete: Weak land market Farm income Population density and remoteness Normalised at EU27 level Normalised in each MS S1 S2 Drivers meaningful and complete added with drivers: Low farm investment Age of farm holder Normalised at EU27 level Normalised in each MS S3 S4 Normalisation method: Min-Max [0 1] Weighting: equal weight assigned to each driver Aggregation: linear combination 32

33 Results: Scenario 1 Composite indicator of the risk of farmland abandonment based on drivers D1, D2, D7, normalised at EU27 level. Quintile 0-80% (yellow), 80% - 90% (light brown) and 90% - 100% (dark brown) 33
34 Results: Scenario 3 Composite indicator of the risk of farmland abandonment based on drivers D1, D2, D7, normalised at EU27 level. Quintile 0-80% (yellow), 80% - 90% (light brown) and 90% - 100% (dark brown) 34


35 Results: Scenario 4 - examples 35


36 Results: Scenario 4 - examples 36
37 Conclusions Regions with higher risk (European level scenario3): PT, SP(Extremadura & Castilla la Mancha), IT (Tuscany, Molise, Sardinia), EL, LV, EE, FI (northern), SE (northern), IE (Donegal, Connacht) Farm-types in regions with higher risk: Specialist grazing livestock, specialist permanent crops Environmental impact: Negative for extensively managed land (biodiversity, semi-natural habitats ) However, can be beneficial under specific conditions (fragmented landscape) Abandoned land for agriculture but options for reversion to natural woodland, hunting, recreation 37
38 Conclusions Methodology Manifold causes and interactions for FLA, varying amongst MS Ranking of regions at risk rather than absolute value National level more reliable than EU27 Data needed at better spatial scale Some issues related to FADN data on investment, land rent, household or external income Better FSS data needed (LAU2 or anonymised) Spatial downscaling possible improve results (e.g Tuscany) Issue with codes of administrative units (changing in time) FLA observations needed to validate the model 38
 A")


 Abstract painting")
39 Data availability At detailed scale (LAU2) A good picture of reality Local level NUTS3 Cubism/patterns of reality Regional / National level (NUTS2, 1, 0) Abstract painting But we did it!! 39