An International Benchmarking Comparison of Australian Crop Production and Profitability Ashley Herbert Agrarian Management
|
|
|
- Rafe Day
- 5 years ago
- Views:
Transcription


1 An International Benchmarking Comparison of Australian Crop Production and Profitability Ashley Herbert Agrarian Management
2 agri benchmark Cash Crop Global network of professionals in agriculture. Benchmark typical farms in grain producing regions around the world Based at the Thünen Institute of Farm Economics, Germany.
3 Present in all major countries and crops Crop coverage : Corn Soybeans Wheat Sugar beet Rice Rapeseed Oats Rye (Malting) barley Sunflower Sorghum Cotton Peas Beans Palm oil Sugar cane Countries participating in agri benchmark Cash Crop Countries to come online 2014 Priorities for new partnerships Page 3
4
5 Average Wheat Yield & Farm Gate Price Yield (T/ha) Price D/T Farm gate 0.0 AU East EU NA SA Yield Price 0
6 Wheat Price ($/T) Typical farm regions ATRALIA $242 East Europe $181 Farm gate price ($/t) Average 25 th Percentile Median 75 th Percentile EU $235 $223 $238 $247 North America $225 Argentina $114 Uruguay $164 All farms $219 $214 $225 $245
7 Wheat Yield Variability Coefficient of Variation % 45% 40% 35% 30% 25% 20% 15% 10% 5% 0% AU East EU NA SA P25 P75 median
8 Average Wheat Income and Production Costs ($/T) $300 $250 $242 $181 $235 $225 $114 $200 $150 $100 $50 $0 AU East EU NA SA Seed Fertiliser Pesticides Machinery Labour Other Income P25 median P75
9 Average Wheat Enterprise Margin (D/T) $200 $150 $73 $61 $79 $71 $5 $100 $50 $0 -$50 AU East EU NA SA Enterprise Margin Margin after decoupled payments P25 median P75
10 $140 $120 $100 Average Wheat Input Costs ($/T) $85 $48 $75 $92 $71 $80 $60 $40 $20 $0 AU East EU NA SA Seed Fertiliser Pesticides Other P25 median P75
11 $120 $100 Average Wheat Machinery & Labour Costs ($/T) $85 $73 $85 $62 $38 $80 $60 $40 $20 $0 AU East EU NA SA Machinery Labour P25 median P75
12 600 Average Physical Inputs (kg/ha) AU East EU NA SA Seed Nitrogen Phosphate Potassium
13 Average Physical Inputs (kg/t) AU East EU NA SA Seed Nitrogen Phosphate Potassium
14 Average Fertiliser Inputs (kg/t) AU East EU NA SA Nitrogen Phosphate Potassium
15 Wheat Production Costs $/ T Region/ Farm Cost per tonne of production ($/T) Seed Fertiliser Pesticides Labour Machinery Total ATRALIA $10 $43 $29 $28 $57 $169 East Europe $11 $26 $10 $17 $56 $120 EU $13 $36 $22 $33 $53 $160 North America $16 $46 $21 $13 $49 $154 Argentina $13 $41 $17 $4 $34 $109 Uruguay $28 $46 $24 $4 $62 $165 All farms $14 $38 $22 $25 $52 $155
16 Input Costs as Proportion of Wheat Income % 80% 70% 60% 50% 40% 30% 20% 10% 0% 34% 26% 30% 37% AU East EU NA SA P25 median P75
17 AU East EU NA SA P25 median P75 Total Costs as Proportion of Wheat Income 140% % 100% 69% 67% 68% 70% 80% 60% 40% 20% 0%
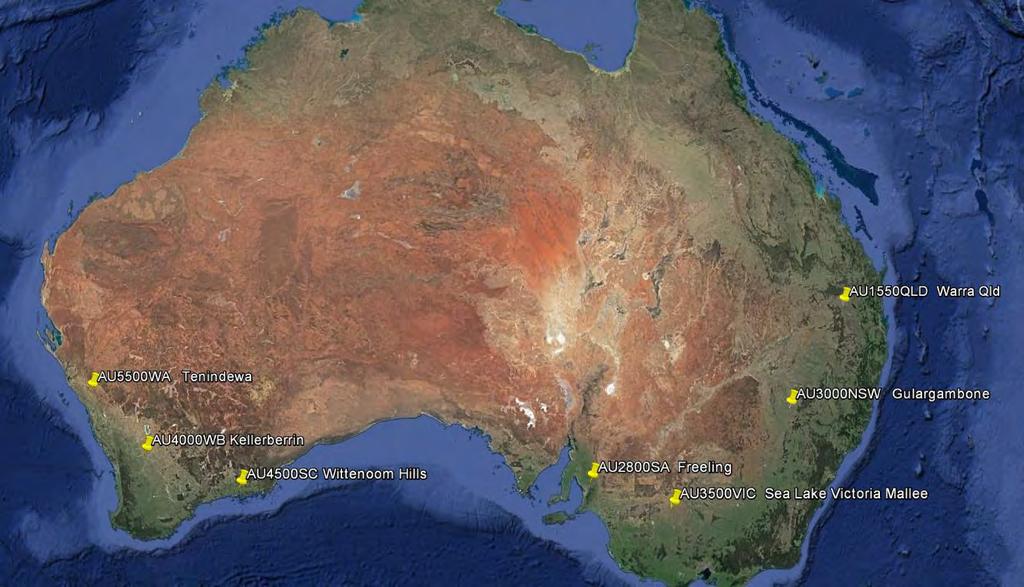
18 Total Costs as Proportion of Wheat Income Typical farm regions Total Cost efficiency Average 25th Percentile Median 75th Percentile AU4000WB 76% AU4500SC 59% AU5500WA 82% AU1550QLD 67% AU2800SA 51% AU3500VIC 68% AU3000NSW 83% ATRALIA 69% East Europe 67% EU 68% 57% 68% 75% North America 70% Argentina 101% Uruguay 111% All farms 73% 63% 70% 79%
19 Summary o Australian production costs and profitability are comparable to that in other grain growing regions of the world. o Australian wheat yields are most variable. o Cost efficiency is comparable between regions.
 A Level 4, East")


20 Grains Research and Development Corporation (GRDC) A Level 4, East Building, 4 National Circuit, Barton, ACT 2600 Australia P PO Box 5367 Kingston, ACT 2604 Australia T F #GRDCUpdates