Feeding small grains and small grain silages
|
|
|
- Norma Barker
- 5 years ago
- Views:
Transcription


1 Feeding small grains and small grain silages Rick Kersbergen University of Maine Cooperative Extension
2 Why do I like small grains for the Northeast? Opportunity to reward good management Flexibility in harvest, storage and feeding options Competitiveness of the crop Utilization of winter growing season
3
4

5 Complementing grain with Quality forages
6 Excess protein costs in... Use of energy for excretion of surplus N from soluble and NPN sources Potentially detrimental to reproductive performance Utilize MUN (Milk Urea Nitrogen) or BUN (Blood Urea Nitrogen) as a monitor
7 Table I. Nutrient composition of common feed grains and oilseeds. Corn Sorghum Wheat Oats Barley Soybeans Cottonseed (% of Dry Matter) Crude protein NE L, Mcal/pound Fat NDF Ca P Source: National Research Council (1989). 1 NE L = Net energy for lactation.
8 MODAL VALUE AND RANGE FEEDSTUFF Starch Crude Protein ---- % of Dry Matter ---- Corn grain 72 (65-76) 10.0 ( ) Sorghum grain 72 (68-80) 10.5 ( ) Wheat grain 77 (66-82) 14 Barley grain 57 (55-74) 12.0 ( ) Oats grain 58 (45-69) 12.6 ( )
9 Extent of Starch Digestion in the Rumen Grain type (ex. corn vs barley) Processing Other components of the diet (complements?) Passage rate through the rumen
10
11 Protein Primer Soluble Degradable NPN Undegradable By-Pass Microbial Metabolizable
12 McCarthy et al. 17 Overton et al. 23 BARLEY CORN BARLEY CORN Dry Matter Intake, kg/day a Starch Intake, kg/day a Apparently digested in rumen, kg/day a intake a...% of starch Passage to Duodenum, kg/day a Apparently digested postruminally, kg/daya % of starch intake a Apparently digested in the total digestive tract, % of starch intakea a Means differ significantly (P<0.01) between corn and barley. Table 2: Ruminal and postruminal digestion of barley and corn starch in lactating dairy cows.
13 The Cornell Net Carbohydrate and Protein System (CNCPS) was developed to predict requirements, feed utilization, animal performance and nutrient excretion for dairy and beef cattle and sheep, using accumulated knowledge about feed composition, digestion, and metabolism in supplying nutrients to meet requirements.
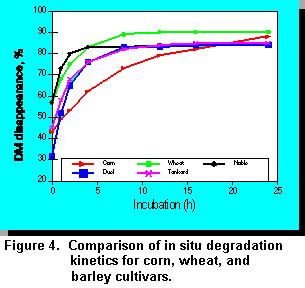
14 Testing is critical!!! Barley Variety Issues 600 samples/30 varieties CP values % ADF values % Starch values % 18 hour Dry Matter Dig. 18.9%-75.3% Why?

15 Why the differences Malting lottery. Nitrogen management Test Weight (Buy whole grains!) Processing (roast, grind, temper, roll) Storage
16 Feeding considerations How much can you feed? What do feed with the grain? How is it processed? How often will you feed the grain? What is your production goal? Know your grains and specific characteristics. Watch your cows
17 Relationships between the bulk density of grains and their metabolisable energy (ME) content
18 Processing Small Grains Grinding (hammermill) Rolling Steam flaking Roasting Tempering


19 Quality Considerations for Dairy Cattle Grain molds in the field Low test weight (reduces energy content of grain 5-10%) Damaged or broken kernels Sprout damage Immature grain Heat damage Improper moisture content
20
21 Effects of Tempered Barley on Milk Yield, Intake and Digestion Kinetics of Lactating Holstein Cows. Christen,et al. Barley tempered by adding 10% water 24 h before rolling was compared to dry rolled barley. Tempered rolled barley had a slower rate of passage (7.8%/h) than dry rolled (8.6%/H). 21% for dry barley and 6% for tempered washout rate from in situ bag indicates tempering reduced pool size of small particles Milk yields increased 5% Digestibility of dietary DM 6%,NDF 15%, ADF 12% CP 10% no total intake differences


22 A Farmer s Actual Experience Ø Perry Lilley, Lilley Farms, Smyrna, ME On-farm integrated dairy Grows soybeans and small grains for feed Also coupled with a local potato farm
23
24
25 Rewarding on farm management by Value adding nutritional components of purchased inputs Processing whole seed allows purchase on greater quality indicators such as test weight Time sensitive processes like tempering offer greater nutritional efficiency potential Processing effect on nutritional variables like effective NDF
 Increased interest in United States due to: Recent")

 animal production/economic claims Are fodder systems feasible")

26 Fodder Systems Old idea renewed- started in 1600 s Australia and New Zealand (arid regions) Increased interest in United States due to: Recent droughts/extended dry periods High organic grain prices Fodder viewed as easy alternative to producing high-quality forage Hard-sell marketing by those selling the systems, with some pretty impressive (but not necessarily substantiated) animal production/economic claims Are fodder systems feasible and economical for US grazing dairy farms in temperate regions? Dr. Kathy Soder Animal Scientist USDA- ARS, University Park, PA Kathy.Soder@ars.usda.gov Phone:


27 Perceived/Expected Benefits Increased palatability Feel-good feed High forage yield in small space No pesticides/herbicides Little waste Low energy/water consumption Rapid growth Easy, high-quality forage
 Improved digestibility (starch converted to sugar) Digestive enzymes Fatty acids Improved nutrient availability")

28 Perceived/Expected Benefits Improved nutritional quality Increased vitamins (photosynthesis) Increased minerals (due to water additives) Improved digestibility (starch converted to sugar) Digestive enzymes Fatty acids Improved nutrient availability Reduction in anti-nutritional factors Antioxidant properties Consistent feed quality Minimize feed changes from winter to summer Eliminates reliance on weather Molds? 1 kg grain input, 5-8+ kg output from system (?)

29 Perceived/Expected Benefits Improved animal performance Better heat stress tolerance (high digestibility) Improves digestion/absorption with less energy required Greater milk production, reproduction, weight gain More efficient waste management Immune response Lower SCC Greater vitality/energy Much lower water requirements than field crops

30 Potential Drawbacks Mold Loss of feed that day- what is the backup plan? Ill/dead animals Cost/kg of DM Fodder system distributors don t like to talk about DM Labor requirements Cows will toss flakes (TMR?) Potential for rumen acidosis (sugars) Initial capital expense (purchased systems) Doesn t qualify for Organic Pasture Rule or some grassfed labels
31 Nutrient Composition Barley Grain Sprouted Barley % Change Pasture CP, % DM NDF, % DM ADF, % DM Starch, % DM Sprouting: * Slightly increased CP * Due to decreased DM * Concentrates existing CP, does not create more unless there is N in the water ESC, % DM % 5.8 WSC, % DM % 9.9 Ca, % DM P, % DM Hafla et al., 2014
32 Nutrient Composition Barley Grain Sprouted Barley % Change Pasture CP, % DM NDF, % DM ADF, % DM Starch, % DM ESC, % DM % 5.8 Sprouting: * Slightly increased CP * Due to decreased DM * Concentrates existing CP, does not create more unless there is N in the water * Increased fiber (NDF, ADF) * Concentration of nutrients WSC, % DM % 9.9 Ca, % DM P, % DM Hafla et al., 2014
33 Nutrient Composition Barley Grain Sprouted Barley % Change Pasture CP, % DM NDF, % DM ADF, % DM Starch, % DM ESC, % DM % 5.8 WSC, % DM % 9.9 Ca, % DM Sprouting: * Slightly increased CP * Due to decreased DM * Concentrates existing CP, does not create more unless there is N in the water * Increased fiber (NDF, ADF) * Concentration of nutrients * Decreased starch- converted to sugar * May change feed conversion * Increased sugar (ESC & WSC) P, % DM Hafla et al., 2014
34 Nutrient Composition Barley Grain Sprouted Barley % Change Pasture CP, % DM NDF, % DM ADF, % DM Starch, % DM ESC, % DM % 5.8 * Minerals relatively unchanged and will depend on additives in water WSC, % DM % 9.9 Ca, % DM P, % DM Hafla et al., 2014
35 Yield Yield Barley Grain Sprouted Barley % Change Pasture Sprouting: * 81% decrease in DM % DM, % Fresh wt, kg DM yield, kg Total NE L for 1 tray, Mcal Hafla et al., 2014
36 Yield Yield Barley Grain Sprouted Barley % Change Pasture Sprouting: * 81% decrease in DM % * 327 % increase in fresh weight yield DM, % Fresh wt, kg DM yield, kg Total NE L for 1 tray, Mcal Hafla et al., 2014
37 Yield Yield Barley Grain Sprouted Barley % Change DM, % Fresh wt, kg DM yield, kg Total NE L for 1 tray, Mcal Pasture Sprouting: * 81% decrease in DM % * 327 % increase in fresh weight yield * 17% decrease in DM yield Hafla et al., 2014
38 Yield Yield Barley Grain Sprouted Barley % Change DM, % Fresh wt, kg DM yield, kg Pasture Sprouting: * 81% decrease in DM % * 327 % increase in fresh weight yield * 17% decrease in DM yield * 21 % loss of total energy per tray Total NE L for 1 tray, Mcal Hafla et al., 2014
39 Why is DM/Energy Lost? Seeds utilize stored energy (starch) during the first week of growth to germinate Photosynthesis doesn t really kick in until 2 nd week of growth Harvesting fodder before photosynthesis really takes effect Net loss of energy that seed uses to germinate and get established Never let fodder get to the stage of growth where nutrients start to accumulate Putnam et al.,
40 Summary NOT a cheap or easy alternative to producing high-quality forages on your farm! Mold/down time No silver bullet Can be a long learning curve High maintenance/labor systems Sprouting may have application in organic, intensive, and small-scale farms with high value outputs, high land prices, and/or high alternative feed prices. Alternative forage source that must be thoroughly evaluated on a farm-by-farm basis
41 Why do I like small grains for the Northeast? Opportunity to reward good management Flexibility in harvest, storage and feeding options Competitiveness of the crop Utilization of winter growing season
42 Small Grain Silages Multiple opportunities for harvest Decisions can be made depending on climate, forage needs, and feed prices Rotation strategies Grazing potential
43 Why the interest? Producers looking for a forage energy or protein source that requires little or minimal weed control Spread crop risk Easy crop to establish and grow Double crop with corn or BMR SS Winter cover crop with good feed value --scavenge excess nitrogen in fall --harvest phos. (double P removal) Rotation crop with corn that leads to perennial forage seeding (underseeded)
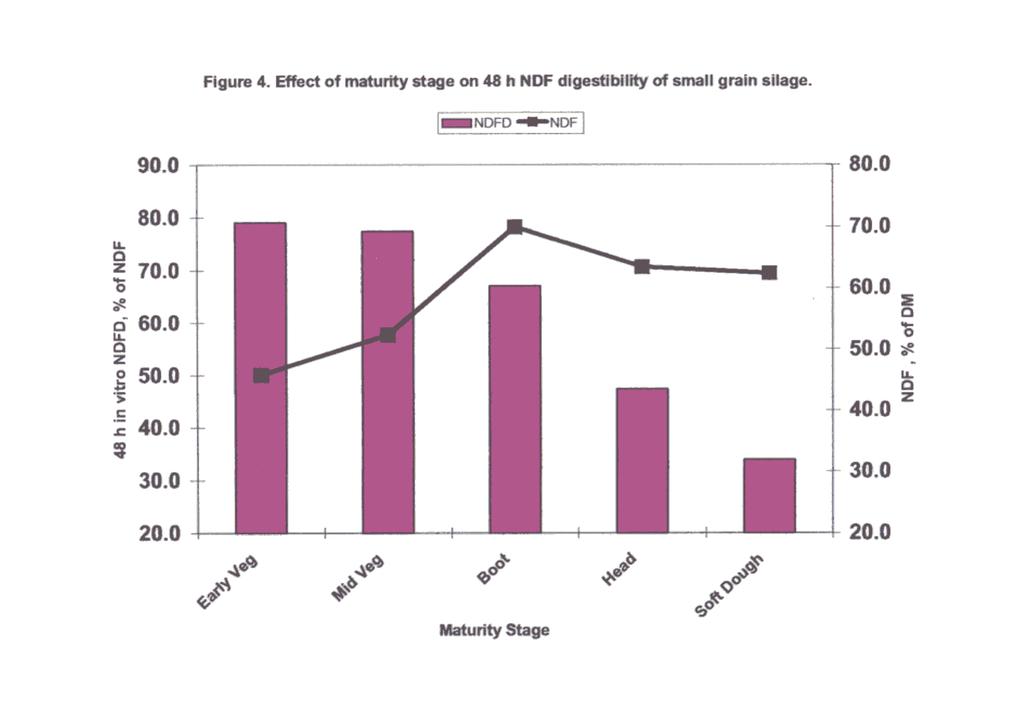
44 Traditional Spring Planted Grains Barley, Oats, Wheat are the traditional crops (seeding rates higher for forage vs grain) (thin stems) IVDMD Barley> Oats>Wheat When to harvest? --Optimum forage quality? --Optimum digestible nutrients per acre? (TDN per acre)
45 What kind of yields? 18 tons corn dm 5.4 tons Highly responsive to nitrogen management Responsive to early planting Boot stage tons dry matter Late milk-early dough stage 3-4 tons per acre
 -NDF48-50% -ADF 35-38% -IVDMD 62% -yield 3-4")
46 Boot stage When to Harvest? -high sol cp 18-20% -30%ADF, 40% ADF -yield tons dry matter/acre -IVDMD 80% -needs wilting from 85% moisture to 70% Late milk/early dough -CP 12% (fertility) -NDF48-50% -ADF 35-38% -IVDMD 62% -yield 3-4 tons of Dry matter/acre -needs little wilting -milk to early dough is short time period


47 Balancing Yield and Quality? Very low yield High quality Moderate yield Moderate quality
48
 -erosion control -scavenge nitrogen Good winter survival Potential fall and/or early spring grazing --Chop early and plant short season corn --Chop")
49 Double Crop Triticale or Rye Fall cover crop (September plant?) -erosion control -scavenge nitrogen Good winter survival Potential fall and/or early spring grazing --Chop early and plant short season corn --Chop late and plant sorghum sudan grass Other Winter Grains --Spelt, Winter Wheat, Winter Barley?
50 Other Small grain silages Lots of opportunities to be creative Winter grains (triticale, barley, spelt, rye) Late summer grains (Oats sown in mid-late July can yield silages 18-20% CP in the fall)


51 Rotation effects Improve yields Disrupt weed and pest cycles -significant weed seed reduction with diverse rotations/and/or sod Soil Quality? Improved varieties Minimun/no-till drills -changing tillage systems will disrupt weed cycles.

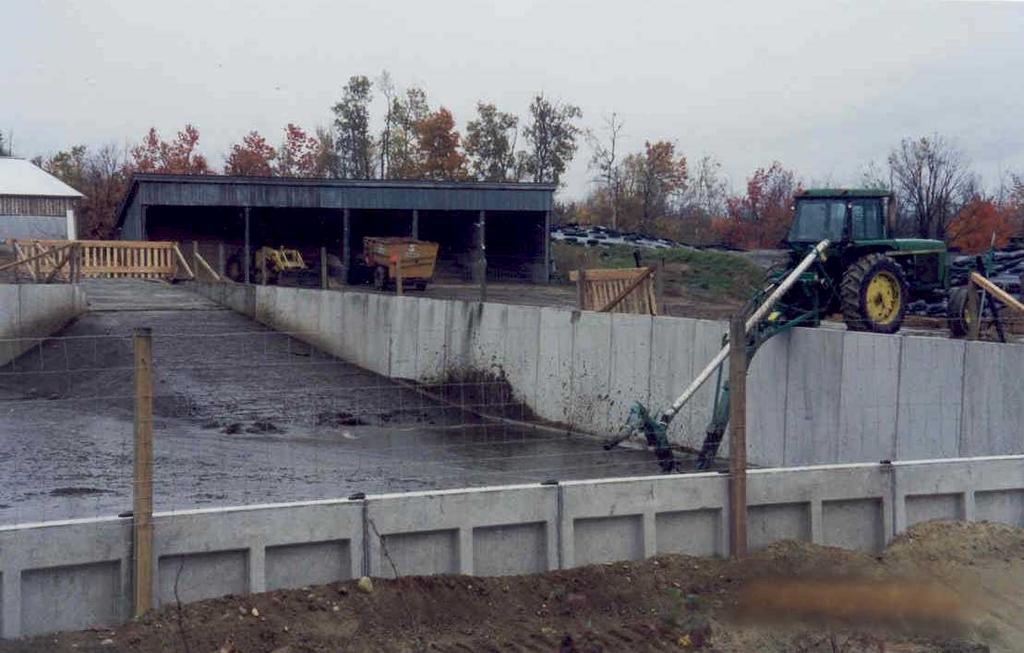
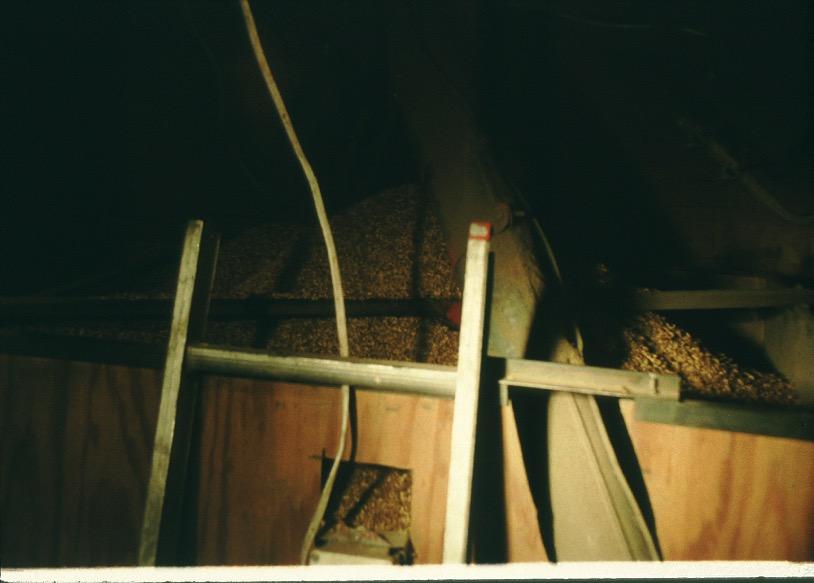
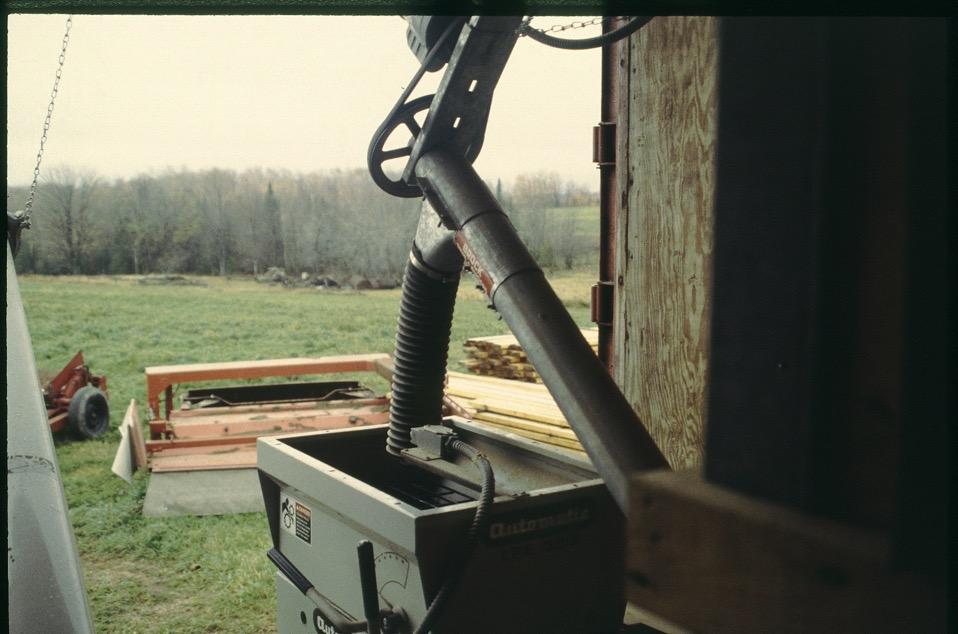
52 Storage of homegrown grains

53 Grain Storages Is the grain to be stored dry? Is the storage going to be used to dry the grain? How long is the storage period? Maintain a moisture level. How big is the volume of the grain.