Adams County Voluntary Stewardship Plan
|
|
|
- Asher Bates
- 5 years ago
- Views:
Transcription

1 Adams County Voluntary Stewardship Plan Presented by Ben Floyd, Anchor QEA 1
2 Agenda Welcome and Meeting Purpose Recap and follow up from December meeting Conceptual Overview of Work Plan Introduction Regional Setting Baseline and Existing Conditions Protection and Enhancement Strategies Goals and Measureable Benchmarks Implementation Outreach Next Steps 2
3 Re-cap December Work Group Meeting 3
4 12/13 Work Group Meeting Re-cap Critical Areas Protection Strategies Conservation Practices Matrix Discussed agricultural viability as a major goal Will be addressed through dual benefit conservation practices Discussed how conservation practices will be used to track critical areas benefits Additional discussion was had on how to track conservation practices completed privately Introduced goals, benchmarks, and indicators Brainstormed potential outreach opportunities Proposed Conservation Districts (Adams and Grant) lead implementation 4
5 Volume One Conceptual Overview of Work Plan 5
6 Section 1: Introduction Introduce VSP Background Discuss main purpose and goals in relation to the Growth Management Act Summarize the Work Plan elements Outline consistency with requirements under RCW 36.70A.720 Roles and Responsibilities for Work Plan Development FAQs Define state, local, and individual roles and responsibilities What is meant by voluntary participation? What are baseline conditions? What does it mean to protect and enhance critical areas? What does it mean to maintain agricultural viability? Suggestions for additional questions? 6

7 Background and Purpose 7
8 Section 2 Regional Setting 8
 to 15 (northeast) Soils in the County are characterized as deep, silty, and well")
9 County Profile Unincorporated ag lands make up most of County Precipitation ranges from less than 8 of annual precipitation (southwest) to 15 (northeast) Soils in the County are characterized as deep, silty, and well drained 9
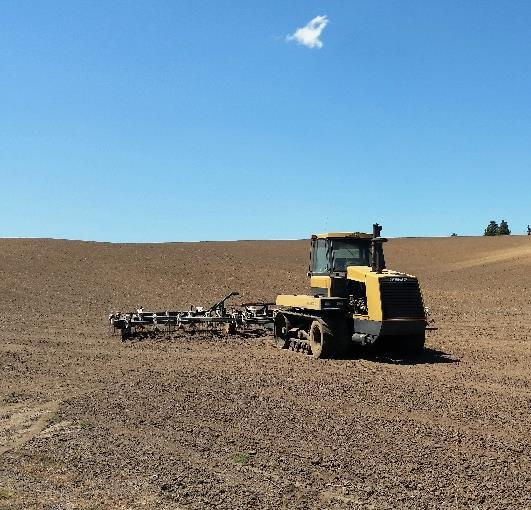
10 Agricultural Land Private agriculture is the major land use in County (91%) Major types of agricultural activity includes: Dryland (55%) Rangelands (13%) Irrigated (23%) 10
11 Agriculture in Adams County In 2012 the market value of agricultural products produced in Adams County was approximately $430 million 79% was crops 21% was livestock By value, grains were top commodity followed by vegetables and potatoes There were approximately 700 farms Sales (Dollars) % of Farms Less than 10,000 50% 10,000 to 100,000 11% 100,000 to 250,000 9% 250,000 to 500,000 9% Greater than 500,000 21% Census of Agriculture


12 Critical Areas FWHCA Wetlands Geologic Hazards (Erosion) CARA FFA 12
13 Critical Areas Critical Area Functions and Critical Areas Functions Values Hydrology Soil Health Habitat Wetlands Fish and Wildlife Habitat Conservation Areas Critical Aquifer Recharge Areas Geologically Hazardous Areas Frequently Flooded Areas 13
14 Section 3 Baseline Conditions 14
15 VSP Crosswalk Crtical Areas Functions and Values Conservation Practices Goals and Benchmarks 15
16 Critical Areas Intersection with Agriculture Critical areas occur mostly on agricultural lands Small intersects with agriculture: Wetlands Critical aquifer recharge areas Frequently flooded areas Fish and wildlife habitat conservation areas Water erosion potential (Ringold Erosive Soils) Larger intersects with agriculture: Wind and water erosion potential (NRCS) neither are designated critical areas in Adams County Conservation practices do not need to intersect with physical critical areas to protect and enhance critical areas functions and values 16
17 Wetlands Example 1.2% of the County s total agricultural lands have wetlands, which represents a majority (approximately 79%) of the wetlands found within the County. Distribution of Wetlands in Each Agricultural Type Dryland 8% Irrigatated <1% Rangeland 92% 17

18 Wetland Functions and Values Key Functions Hydrology Wetland Functions Stores water to reduce flooding and contributes to base flows Habitat Provides aquatic and woody vegetated habitat for fish and wildlife Provides water filtration, reduces sedimentation Moderates water temperature 18
19 Critical Aquifer Recharge Areas 19
20 Agricultural Viability Regional Perspective The ability of a region to sustain agricultural economy and production over time Concept Stable and secure agricultural land base Infrastructure and services Support for best farm management practices Education, training, and succession planning Welcoming business environment Market Trends/Viability Land conversion Stable water rights Utilities/irrigation Detail Market access/transportation Economically viable solutions Balanced approach Apprenticeships/training Interconnectivity with end users Stable regulatory environment Partnership based environmental protection Changing livestock and commodity prices can effect the number of producers that support economy Value added measures to make products more marketable 20
21 Agricultural Viability Farm Perspective The ability of a farm to meet financial obligations and make profit Reduce Input Costs Concept Maintain/Enhance Land Production Capacity Flexibility to Respond to Market Conditions Incentives Managed Farmland Conversion No Surprises Regulatory Environment Protect Private Property Rights Environmental Variation Energy (power, fuels) Chemicals/fertilizers Labor Soil health Detail Water systems and moisture management Nutrient management Promoting/adopting new technology Changing land in production Individual schedule for implementing conservation practices Cropping choices Payment for measures Tax breaks Urban development (limited) Maintain resource lands Federal - CWA, CAA, ESA, etc. State and Local Permitting Recognize and respect rights Rainfall, temperature, etc. affects activities 21
22 Agricultural Interviews SWOT Analysis Conduct a SWOT analysis with agricultural producers in the County Would you like to be interviewed? Do you know of a good person to interview? 22
23 Section 4 Protection and Enhancement Strategies 23
24 VSP Crosswalk Crtical Areas Functions and Values Conservation Practices Goals and Benchmarks 24

25 Conservation Practices Example Practice Ag Type Description Critical Areas Function Hydrology Soil Health Habitat Agricultural Viability Residue and Tillage Management Dryland Rangeland Managing crop and plant residue and limit soil disturbance (e.g. no- or reduced-till, direct seed, and mulch tillage) Soil quality and conservation Weed management Increased yield and fertility Integrated Pest Management Dryland Rangeland Managing pesticide use to reduce runoff Soil quality Weed management Pollinator/beneficial organisms Managing application of Nutrient Management Dryland nutrients to minimize loss to runoff Soil quality Increased yield and fertility Reduced input costs Controlling the timing, amount, Water Management Irrigation frequency and application rate of irrigation water Soil quality and conservation Prescribed Grazing Rangeland Managing grazing and vegetation harvest to improve plant communities and manage weeds Soil quality and conservation Weed management Increased yield and fertility 25

26 NRCS Practices Implemented ( ) 26
27 Section 5 Goals and Benchmarks 27
28 VSP Crosswalk Crtical Areas Functions and Values Conservation Practices Goals and Benchmarks 28

29 Benchmarks Goals Countywide Critical Area Protection Enhancement Based on our 4 Ecosystem Functions Define our enhancement trajectory Objectives Based on conservation practices Define the focus of implementation 29


30 Benchmark: Protect/ Enhance Critical Areas functions and values B Ag. Viability Goals: Protect and Improve Enhance Increase Water Quality Hydrology Soil Health Habitat Objectives: Direct Seed, Mulch Till/ Range Watering/Nutrient Management/ Pest Management/ Prescribed Grazing/ Fencing/ Range Planting.. 30

31 Goals are Based on Critical Area Functions Protect and Improve surface water quality Improve groundwater quality Increase hydrologic storage Increase groundwater recharge Increase soil moisture Enhance soil quality Enhance terrestrial habitat Enhance aquatic habitat 31
32 Habitat Goal Example Protect and enhance existing terrestrial habitat areas Protection and/or Enhancement through: Limiting soil compaction or trampling of habitat Promoting water management to prevent unintentional conversion of shrub steppe habitat Enhancement through: Restoring or creating new habitat or habitat structures Objectives: 32
33 Functions and Values Measuring Goal Performance using Benchmarks Account for Discontinuation of Practices Enhancement Benchmark Protection Benchmark July 22,2011 Time 33

 Net Gain in Water Quality")
34 Function Indicator (using CPPE) Example Habitat Function: Measurable Benchmarks Habitat Function Protection/Enhancement Protection Benchmark Cumulative Gross Losses (recidivism) Net Gain in Water Quality Function 34
35 Measurable Benchmarks Conservation practices with direct effects on critical areas Use the conservation practices are inherently geographically related to critical areas Riparian planting Wetland restoration Conservation practices with indirect effects on critical areas Reduced tillage Irrigation water management 35
36 Quantifying Measurable Benchmarks 1. Apply methods to relate conservation practices benefits to critical areas functions and values 2. Set benchmarks based on conservation practices direct and indirect effects on critical areas functions and values 3. Account for practices implemented, continuing practices, and practices discontinued 36
37 Using CPPE to relate conservation practices benefits to critical areas functions and values (Step 1 in Quantifying Measurable Benchmarks) Conservation Practice 1 Residue and Tillage Management (reducedand no-till) Projects Acres Affected Habitat Effect Hydrology Effect Water Quality Effect Soil Health Effect ,423 g g g g Pest Management 62 36,540 g g g g g g Nutrient Management 49 27,384 g g g g g Irrigation Management ,274 g g g g g g g g g Prescribed Grazing 15 13,201 g g g g g g g g Cover Crop 13 1,825 g g g g Access Control 2 1,516 g g g g Habitat Management ,396 g g g g g g Beneficial Effects Neutral or Adverse Effects High Medium Slight No Effects Slight Moderate High g g g g g g g g g g g g g Key Benchmark quantities for conservation practice enrollment are provided in 5-year reporting 37

38 Setting a Protection Benchmark with CPPE (Step 2 in Quantifying Measurable Benchmarks) Quantify the benefit of stewardship we know has been implemented conservation practices under contract to NRCS Estimate future practices for the first 10 years of VSP implementation Evaluate if critical area functions and values will be protected through expected net changes in agricultural land stewardship 38
39 Account for Implemented and Continuing Practices (Step 3 in Quantifying Measurable Benchmarks) Rely on Conservation Districts to track implementation and continuation of conservation practices Use Farm Stewardship Plans for individual agricultural producers Other tracking options website, checklist, etc. 39
40 Account for Discontinuation of Practices (Step 3 in Quantifying Measurable Benchmarks) Understanding Voluntary Stewardship from the Producer Perspective to Account for Recidivism Stewardship Investments Versus Stewardship Actions 40
41 Understanding how Different Agricultural Business Models Affect Discontinuation of Practices Operators on their own land Operators who typically lease land annually Operators who typically lease land for several years Landowners who typically lease their land to operators 41
42 Calculating Discontinuation of Practices Recidivism Rate Recidivism Category Example Practices No Recidivism Permanent Conservation Practices Permanent Easements Major Infrastructure Lower Recidivism Higher Recidivism High Barriers to Entry/Exit o Conservation investments o Maintenance cost o Effectiveness Increases Land Productivity Lowers Cost Low Barriers to Entry/Exit o Easily removed Reduced land in production Rotational use o Market driven rotation Reliance on unstable conservation funding or incentives (e.g., CRP) Tillage Management Pest Management Nutrient Management Irrigation Management Fencing Habitat Restoration Prescribed Grazing Cover Crop Range Planting 42
43 Indicators Indicators include information collected through existing programs Water quality monitoring Flow data Priority Habitat and Species data, etc. Help to understand if conservation practices are effecting physical indicators of functions and values Affect of agriculture on indicators in not easily distinguished Indicators may not reflect benefits from stewardship actions for many years or even decades 43

44 Adaptive Management Indicators feed adaptive management 44
45 Chapter 6 Implementation 45
46 Implementation Framework Expected to continue largely through established programs and organizations Work Plan implementation responsibilities include: agricultural producer participation and outreach technical assistance program performance tracking and reporting adaptive management Reporting timeline 2 years: Report on progress 5 years: Performance Review Proposed implementation lead: Adams CD Adams CD: Tracking and reporting to WSCC Adams and Grant CDs: Coordinate implementation with private industry and local, state, and federal agencies 46
47 Analysis Units Major Drainage Areas (4 major watersheds) Mostly within Lower Crab (WRIA 41), Palouse (WRIA 34) and Esquatzel Coulee (WRIA 36) Small portion in Upper Crab-Wilson (WRIA 43) VSP Watershed Analysis Units By watershed? By CD boundary? 47
48 Integrated with Existing Programs and Plans Groundwater Management Plans Environmental Quality Incentives Program (EQIP) Conservation Stewardship Program (CSP) Wetland Reserve Program (WRP) Conservation Reserve Program (CRP) Private Lands Conservation Program (WDFW-led) Private sector Others 48
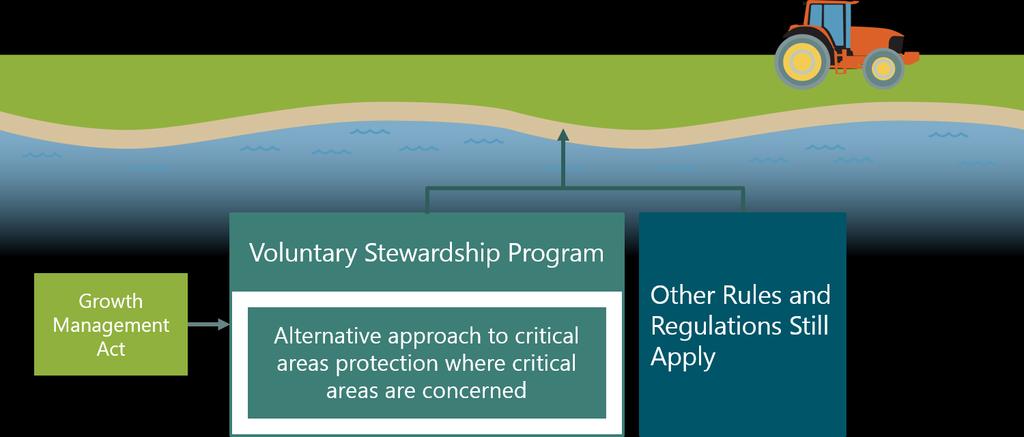
49 Regulatory Environment 49
50 Outreach 50
51 Outreach During Plan Development Adams Conservation District Annual Meeting (January 24 th ) Done! Industry meetings, agricultural shows Other meetings where producers already meet (monthly coffee hours) announcements or postcard notifications Conservation District Washington Cattle Breeders Others? Articles in the Othello Newspaper, others? 1-page VSP FAQs/Summary of Work Plan In development 51
52 Outreach During Plan Implementation Venue Description Meetings Media Conservation Districts Industry meetings Others? CDs websites and newsletters Adams County website WSCC news and announcement webpage Articles, announcements, and advertisements with local newspapers (Othello, others?) distribution lists (CDs) Others? Others Informational booths and displays at fairs and agricultural shows Individual outreach VSP Self-assessment Checklist 52
53 Next Steps 53
54 Expected Next Steps March 14, 2017 Review and comment on Work Plan April June Continue to review and comment on Work Plan After June TBD 54