Agronomic rate for biosolids application to cropland. Andy Bary Soil Scientist Crop & Soil Science Washington State University Puyallup
|
|
|
- Amberly Osborne
- 5 years ago
- Views:
Transcription

1 Agronomic rate for biosolids application to cropland Andy Bary Soil Scientist Crop & Soil Science Washington State University Puyallup
2 PNW 511

3 On the web
4 NOTE: This is adapted from Pacific Northwest Extension publication number, PNW0511e. Enter information in these cells as applicable You must enter information in these cells to determine an application rate Cells of this color are calulations for your use Version 20-Dec-07 GENERAL INFORMATION Biosolids Source Field Number/ID Dry tons biosolids available (= wet tons x % solids) dry tons Acres available acres BIOSOLIDS DATA Ammonia/ammonium-N mg/kg 0 #/dry ton Nitrate-N mg/kg 0 #/dry ton Total Kjeldahl N mg/kg 0 #/dry ton Percent solids Organic nitrogen 0 mg/kg 0 #/dry ton NITROGEN (N) CREDITS PREVIOUS BIOSOLIDS APPLICATIONS Last Year 2 Years Ago 3 Years Ago 4 Years Ago Dry tons applied/acre to site Organic N concentration (mg/kg) N credit (#/dry ton) N credit (#/acre) OTHER CREDITS NOT ACCOUNTED FOR Nitrate-N applied in irrigation water #/acre N applied at seeding (starter fertilizer) #/acre Preplant nitrate-n in root zone (east of Cascades) #/acre NOTE: not required if accounted for in the nitrogen recommendation in Cell B30 Plowdown of cover or green manure crop #/acre NOTE: not required if accounted for in the nitrogen recommendation Previous manure applications #/acre in Cell B30 NOTE: not required if accounted for in the nitrogen recommendation in Cell B30 Total N credit 0 #/acre NITROGEN FERTILIZER RECOMMENDATION Nitrogen recommendation (via guidelines, agronomist, etc.) 0 # N/acre/yr ESTIMATED BIOSOLIDS PLANT-AVAILABLE NITROGEN Percent of ammonium-n retained after application (see Table 1) 0% Percent of organic N mineralized in Year 1 (see Table 2) 0% Estimated plant-available N in biosolids 0 # N/dry ton Amount of plant-available N needed from biosolids 0 # N/acre AGRONOMIC BIOSOLIDS APPLICATION RATE Dry tons per acre = #DIV/0! dt/acre Wet tons per acre = #DIV/0! wt/acre Cubic yards per acre = #DIV/0! yd 3 /acre Cubic feet per acre = #DIV/0! ft 3 /acre Gallons per acre = #DIV/0! gallons/acre Acre-inches per acre #DIV/0! acreinches/acre ACREAGE NEEDED Acres needed #DIV/0! acres Same calculations found in hardcopy PNW 511. Download Excel worksheet.

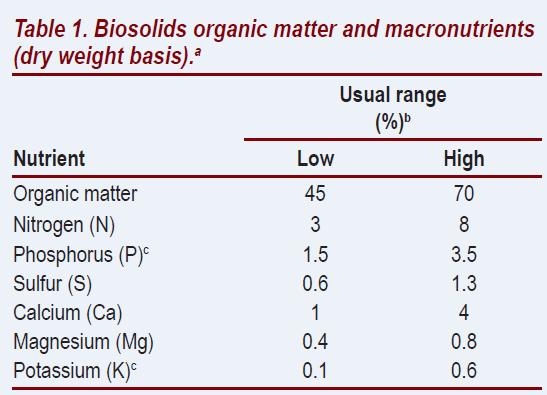
5 Nitrogen controls the application rate for biosolids in most situations.
6 Agronomic rate balances environmental and economic goals Environmental: Balance crop N demand with plant-available N to prevent nitrate leaching. Economic: Provide enough N for near maximum yield and quality of crop.

7 Plant available N supply from biosolids depends on rates of mineralization of organic N and retention of ammonium N
8 Agronomic Rate Calculation PNW 511 -E You provide: Soil and crop information (needed to use university nutrient/fertilizer guide) Biosolids data: N, solids, application method, incorporated or not Previous biosolids applications to field (5 yr) Other sources of plant-available N Appropriate university fertilizer/nutrient management guide(s)

9 OSU Extension Catalog Fertilizer Guides page OSU Extension publications

10 OSU Fert Guide 80

11 Use an appropriate fertilizer guide for region and crop
12 OSU FG-63 (west of Cascades) 50 to 60 lb N per forage harvest
13 In OSU FG 63. Pastures, western OR and WA

14 Past biosolids applications contribute to current soil N supply. Figure 2. Conceptual illustration of biosolids N cycling over the long term, when biosolids are applied annually.
15 Estimated nitrogen credits for previous biosolids applications at a site Source: Table 1 in PNW 511 (2007)
16 Example 1: Grass Hay, West of Cascades Soil: Jory silty clay loam Crop: grass hay Yield goal: two cuttings per year Plant-available N needed: 120 lb N/acre Plant available N from other sources: none
17 Example 1: Grass Hay, West of Cascades Biosolids form: solid (cake) Biosolids processing: anaerobic Method of application: surface Days before incorporation: never Expected application season: fall or early spring Biosolids analysis: Next page
18 Biosolids analysis Total N = 5% Ammonium-N = 1% Total solids = 20%
19 Example 2: dryland winter wheat wheat/fallow cropping system < 12 inch precip zone Soil: silt loam Crop: Wheat-fallow Yield goal: 40 bushels/acre (soft white wheat) Plant-available N needed: use worksheet in fertilizer guide
20 Example 2: dryland winter wheat wheat/fallow cropping system < 12 inch precip zone Biosolids form: solid (cake) Biosolids processing: anaerobic Method of application: incorporated Days before incorporation: 4 days Expected application season: fallow year Biosolids analysis: 5% total N, 1% NH4-N, 20% total solids
21 N credit for previous biosolids application determined by soil testing In OSU FG 80. WW in wheat fallow, low precip. zone
22 In OSU FG 80. WW in wheat fallow, low precip. zone
23 Research Biosolids can improve soil health Long term trials needed to measure soil health benefits

24 Biosolids applications improve soil in the long run by building organic matter


25 Evidence for longterm biosolids effects on nutrient management and soil organic matter: Dryland wheat in central Washington

26 Long-term dryland wheat-fallow experiment 1994-present Alternating winter wheat and fallow Biosolids applied every 4 th year, crop harvested every 2 years
27 Long-term dryland wheat-fallow experiment Biosolids rates: 2, 3, 4 dry tons/acre each application Inorganic N 50 lb/acre each crop Zero-N control Total biosolids applied : dry tons/acre
28 Biosolids had equal or greater grain yields than inorganic N treatment dt/a biosolids 3 dt/a biosolids 4.5 dt/a biosolids Inorganic N Zero-N Grain yield, lb/a ab a a b c a a a a b bc ab a c c mean First crop mean Second crop mean
29 All biosolids application rates increased organic matter in the upper 4 inches of soil Total C, mg/kg a a b c c 2dt/a biosolids 3 dt/a biosolids 4.5 dt/a biosolids Inorganic N Zero-N Depth, Inches
30 C and N accumulation in soil as % of biosolids C and N applied Wheat: Applied every 4 th year since 1994 C increase = 57% of total C applied N increase = 33% of total N applied Improves soil and sequesters carbon
31 Soil test P increased in the biosolids treatments. Soil P, mg/kg a a b c a b c a Depth, Inches 2dt/a biosolids 3 dt/a biosolids 4.5 dt/a biosolids Inorganic N Zero-N b bc ab c

32 Fate of biosolids N and inorganic (fertilizer N) Soil sampled in 2011, 10 yr. after last biosolids application Cogger et al., Puyallup, WA (WSU)
33 Biosolids research summarized in 2015 PNW Extension publication
34 Questions?
35 Fertilizing with Biosolids Andy Bary Soil Scientist Crop & Soil Science Washington State University Puyallup
36 What s on the menu? Preview new Extension publication Soil testing as a value-added service of your biosolids program What a soil test measures Choosing a lab and requesting appropriate testing methods Guide to soil sample collection Phosphorus: agronomic vs. environmental interpretation
37 Pacific NW Extension publication 508-E
38


39 Biosolids: fertilizer replacement value of nutrients
40 Role of soil testing in nutrient management
41 Nutrient management Plan Implement Monitor Then modify based on what monitoring data (soil, plant, irrigation water) tells you
42 Role of soil testing in biosolids management program
43 Nutrient management goals for biosolids managers Regulatory compliance: agronomic rate Assisting farmer with his business: crop production A well-designed soil testing program is an essential part of pro-active biosolids management Build trust in local agriculture community
44 Soil testing: role in biosolids management Ag professionals and farmers are familiar with soil testing as a management tool But, they may not understand organic fertilizers And may not understand what an agronomic rate is


45 Soil testing: overlap of regulator, grower, and biosolids manager goals Reduce nutrient loss to environment Produce a profitable crop Success Routine procedures for land application
46 Soil testing methods and interpretations Land grant universities OSU, WSU, U of I developed soil test methodology and interpretations Pacific Northwest is unique in US cross-border cooperation in nutrient management among universities Crop specific soil test interpretations Similar across state lines for agro-ecoregions (e.g. irrigated or Columbia Basin)

47 OSU EC 1478-E Most recent summary of applicable soil test methods used in the Pacific Northwest General reference: approved method, general interpretation: low, medium, high More specific information provided in crop/region specific nutrient management guides
48 What to expect from a soil test Determine soil nutrient status with respect to crop production (deficient, adequate, excess) Determine need for lime or other amendments to adjust soil ph Measure change over time due to management practices, including fertilizer source, rate, timing.
49 Soil test value vs. crop yield response to nutrient addition
50 soil ph Soil analyses: west of Cascades (ph < 7; precipitation 30 to 50+ inches) lime requirement: SMP buffer test Bray P1 phosphorus Exchangeable cations (Ca, Mg, K ) hot-water extractable B Post-harvest NO3-N? Sept 1-Oct 15
51 Soil analyses: east of Cascades (ph > 7; precipitation 6 to 20 inches) soil ph soluble salt (EC) Olsen phosphorus Exchangeable cations, including sodium (Na) hot water extractable B Preplant NO3-N (consult university nutrient guide for sample depth) % CaCO3 (free lime) DTPA extract: Zn, Fe, Mn
52 Interesting but probably not essential Ammonium-N (NH4-N) Sulfate-S (SO4-S) Percent base saturation Cation exchange capacity (CEC) Nutrient ratios Soil texture Mineralizable N, total N Soil health score (Haney test) Organic matter or soil carbon Sometimes useful for long term monitoring
53 Choosing a laboratory NAPT-PAP Lab choosing tips Talk to them Visit the lab See lab report Use same lab consistently

54 Voluntary soil testing quality control program supervised by Soil Science Society of America About 10 labs in West were certified in 2014 Based on annual performance in accurate analysis of double-blind soil samples Must use NAPT-PAP lab when sampling under cost-share agreement with NRCS for nutrient management
55 Reference soil samples for sale at NAPT-PAP website Soil sample with a known analysis using approved agricultural soil testing methods Can be used to assess accuracy and consistency of analyses over time.


56 OSU Extension pub EC 628 Good summary of general principles OSU EC

57 Soil sampling PNW Extension publication 570-E
58 Consistent soil sampling depth is critical Nutrients like P and K are often much higher in top inches of soil Especially in no-till or pasture: nutrients accumulate and ph changes mostly at the soil surface (0-2 inches) Standard sampling depth for most soil test interpretations in university guides is 12 inches in the PNW Consult nutrient management guide for crop before sampling

59 Soil probe Collect same amount of soil from each depth Known sampling depth Easy to clean out between samples Photo: OSU Extension

60 Use shovel? Depth unknown More soil from top than from bottom of hole May be zinc plated Photo: Virginia Tech

61 Different probes suited for different sampling situations Foot probe Open-ended gator probe
62
63 What changes you expect from repeat Increase soil test P biosolids application Maintain or decrease soil test K Increase soil organic matter (and total N & C) Increase soil NO3-N (preplant application) Utilize most of the soil NO3-N near crop harvest time (low NO3-N in fall is the goal) ph and soluble salt (EC) similar to mineral N fertilization program (e.g. urea)
64 Phosphorus Plant nutrient Potential water pollutant Biosolids are rich in P When applied to supply N for a crop, P accumulates P accumulation monitored by agronomic soil testing Agronomic testing extracts a small fraction of total soil P that is correlated with P that roots can extract from soil.

65 Total vs. available nutrients in biosolids

66 Phosphorus: Landscape view In: Sharpley et al., 1999; ARS-149
67 Potential for P Transport Source Factors Phosphorus Index Adapted from SERA-IEG 17, No. 389 Soil Erosion Runoff Surface & Subsurface Soil Test P Rate of P applied fertilizer or manure Method & timing of P application P Index Value low, med, high
68 Figure 3. Agronomic and environmental interpretations of soil test P.
69 cm SAMPLING DEPTH non-application buffer areas biosolids application areas High Risk BRAY 1 P (mg kg -1 ) Medium Risk Low Risk Agronomic Sufficiency Level SITE
70 Questions?