What is happening to the world? The importance of green growth
|
|
|
- Adele Melton
- 5 years ago
- Views:
Transcription
1 What is happening to the world? The importance of green growth Professor Sir John Beddington Chief Scientific Adviser to HM Government and Head of the Government Office for Science

2 An inevitable increase in population Historical progression of Global Population Total Population Year Interval 3 billion Billion years 5 Billion years 6 Billion years 7 Billion years 8 Billion* years 9 Billion* years Source: UN DESA Population Division, 2011 * Denotes predicted year
3 An inevitable increase in urbanisation Impact: Developing countries will be building the equivalent of a city of 1 million people every five days between now and 2050 Example: In Africa, by 2050 an additional 800m people are predicted to be living in cities (62% total population). Issue: Urban populations more vulnerable to shocks: natural hazards, supply of food+ utilities Source: People and the Planet, Royal Society, 2012 Urban / rural population Population (millions) 7000 Urban population Rural population Percentage population residing in urban areas


4 Food security: 925 million people go hungry Around 1 billion people suffer from the hidden hunger World population is increasing by 6 million per month The current situation: Food, water and energy poverty An extra billion tonnes of cereals will be needed by 2030 (FAO) Water security: 1.2 billion people live in areas affected by physical water scarcity 1.6 billion people live in areas affected by economic water scarcity 884 million people lack access to clean water Poor quality water in Middle East and North Africa costs from 0.5% to 2.5% of GDP. Energy security: Currently, 1.4bn people do not have sufficient electricity. It is estimated that in bn people will still lack access to electricity Source: FAO (2010) / WEO 2010/UNICEF 2010

5 Dilemma: Taking people out of poverty increases consumption, further increasing demand for resources Meat consumption David MacKay 2009 UN Human Development High Index Medium General food consumption Low
 8")
6 Future challenge: Increasing demands on resources Current and 2030 water deficits Billion m Ground Water Agriculture Industry Surface Water 100 Municipal and domestic -40% Existing Withdrawals Withdrawal Basins with deficits Basins with surplus 700 Existing supply Global average yield (tonnes/ha) Wheat Maize Source: USDA PDS database Anticipated demand by 2050 (FAO)


7 Context: challenges Population 1 billion more people Urbanisation population increase concentrated in cities A more prosperous world, but also a further strain on resources Complex demographic trends Migration to vulnerable areas Summary: Increasing demands on resources by Source Food +38% FAO (TOWARDS 2030/2050) Water 40% gap in supply/demand Water 2030 Global Water Supply and Demand model Energy +54% OECD Environmental Outlook to 2030


8 Climate change is happening and will continue In Russia worst drought since record began (130 years) 558 active forest fires, consuming 180 ha Grain harvest reduced by 30%. Sea Ice Extent on 5th September 2012


9 Climate change is happening and will continue Expected area covered under normal historical conditions 0.1% 2.1% 2.1% 0.1% PNAS, online Aug 2012 Courtesy of Tim Benton
 www.pnas.org/cgi/doi/10.1073/pnas.")
10 Courtesy of Tim Benton Climate change is happening and will continue The mean is moving, but the distribution is getting wider >2x faster Hansen et al (2012)


11 Increase in severe weather events Hurricane Sandy 2012, Minimum central pressure 946mb with maximum sustained winds 80mph. Cyclone Nargis 2008, Minimum pressure 962mb with maximum sustained winds 135mph.


12 What about the past? There has been a failure to recognise the: value of Natural Capital to economic development linkages between food, water and energy systems Importance of ecosystem services


13 The recent past: Result of increasing food production Of 11.5 billion ha of vegetated land on earth, around 24% has undergone human induced soil degradation Pie charts and map show the extent of areas of degraded land in the world and the location of degraded soils Source: UNEP 1997 and GRID Arendal 2001

14 The result of increasing energy production: Green house gas emissions

15 The result of increasing the supply of water Groundwater extraction in many areas exceeds replacement rate Source: Milesi et al, 2008

16 Metric adopted by the Convention of Biological Diversity Indicators of biological diversity worsening
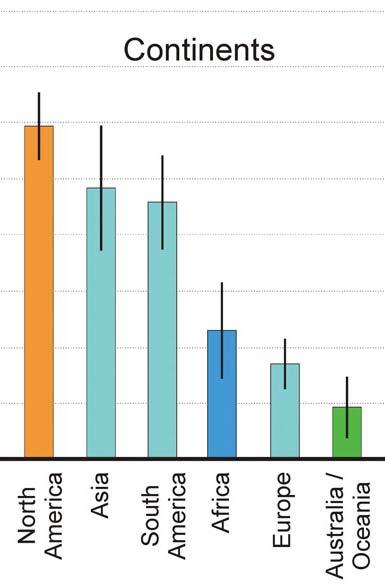
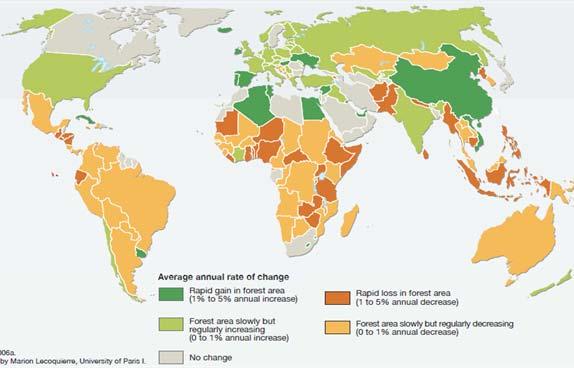
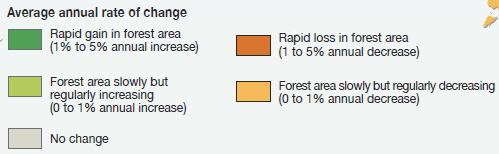
17 Exploiting resources: Forests
 PLoS Biology 7(6)e1000131 A third of")
18 The result of increased fish production: Unsustainable fisheries Average management effectiveness 75% of the major marine fish stocks are either depleted, overexploited or being fished at their biological limit World Summit on Sustainable Development 2002 One billion people rely on fish as their primary protein source IFPRI 2008 Source: Mora et al (2009) PLoS Biology 7(6)e A third of the global animal production (by weight), comes from oceans, seas, rivers and lakes FAO 2006
19 The result of increased fish production: Unsustainable fisheries Global fisheries


20 The future must not be like the past We need growth to alleviate poverty and meet demands of a growing population. But, we need sustainability: for fisheries, forestry, agriculture, energy


21 Challenges and opportunities: Agriculture System of Rice Intensification (SRI) Designed to benefit farmers with small holdings Increases productivity by maximising management practices not inputs. Benefits seen in over 40 countries 100 per cent increase in yield 90 per cent reduction in seed 50 per cent water saving Example: Vietnam SRI adopted by over 1 million farmers over 4 years per cent decrease in seed use 5 9 per cent increase in yield 33 per cent less water Extra income of US$95 $260 per/ha In addition: Reduces water use and methane emissions Positive health impacts resulting from lower pesticide and herbicide applications


22 Challenges and opportunities: Climatic resilience Climate Smart Agriculture Increase productivity, Identify opportunities for carbon sequestration and GHG mitigation, including: Precision application of inputs Fodder management Agro forestry Risk management: Provide climate risk analysis and short term weather forecasting services Example: Kenya Agriculture Carbon Project Aim to increase productivity and encourage private enterprise. Builds in carbon sequestration activities. Includes: Reduced tillage Targeted application of fertilisers Residue management Provides technical support to over 60,000 farmers Potential to sequester about 60,000tons of CO2 equivalents per year Diversify farmer income sources Reduce vulnerability of small farmers to climate change.
.")

23 Integrated Agriculture Aquaculture Rice monoculture dominant farming practice. Integrated rice fish production would: Help address food security issues. Increase efficient fertiliser use Increase net income by 5 11% (Ofori et al 2004). Improve nutritional status of rural families Example: Philippines More than one hundred and fifty fold increases in income and fish production could be achieved if the Philippines harvested 300 kg/ha/year of fish from just five per cent of its 3 million hectares of rice land. That means over PESOS 736 million a year to Philippine farmers and tons of fish. Challenges and opportunities: Agriculture / aquaculture Nesar Ahmed & Stephen T. Garnett
 Cattle population produces 6m metric tonnes excrement / annum Coal (3.6%) Potential to produce 1.")
24 Challenges and opportunities: Rural renewable energy Renewable Energy Energy mix Hydropower Viable potential capacity: Estimated at 108,000 MW Installed capacity: 3046 MW Village electrification from small/micro systems Biogas Gas (20.5%) Cattle population produces 6m metric tonnes excrement / annum Coal (3.6%) Potential to produce 1.5million m3 biogas / day Solar Hydro (58%) Radiation intensity: Dry season: 5kWh/m2/day Extensive application solar energy for domestic use; water supply; battery charging. Small Hydro Power UN Industrial Development Organisation implementing projects in China, India, Indonesia, Sri Lanka, Zambia, Tanzania, Uganda, Kenya. Umbrella regional programme with a focus on South South cooperation to implement about 100 SHP projects in Africa within the next 3 years Example: Lighting Up Rural Africa programme. Pilot projects in rural communities to: Augment on / off grid rural electrification Link energy services with productive uses for poverty reduction Diesel (29.6%)


25 Overarching challenges: Reduce poverty Meet the demands of a growing population To do this we must exploit our natural resources sustainably without destroying the environment or worsening climate change. We need Green Growth