Feed Efficiency, RFI and the Benefits for the Beef Industry
|
|
|
- Sophia Stevenson
- 5 years ago
- Views:
Transcription


1 Feed Efficiency, RFI and the Benefits for the Beef Industry J.A. Basarab, P.Ag., Ph.D. Alberta Agriculture and Rural Development Lacombe Research Centre, Alberta, Canada Tiffin Conference, Cattle Gate to Dinner Plate 19 January 2012, Lethbridge, Alberta
2 Feed Efficiency in Beef Cattle: Why? 56-71% of total cost of production for cow-calf operations is associated with feed, bedding and pasture (Alberta Agriculture and Rural Development 2005) 65-75% of the total dietary energy cost in breeding cows is required for maintenance (Ferrell & Jenkins 1985; NRC 1996) Genetic improvement in feed efficiency - estimated: $ million annually to Alberta s beef cattle industry
3 Energetic Efficiency in growing beef cattle 1. Feed Intake 2. Feed Conversion Ratio: DMI/ADG; CV for DMI, 8-12%; CV for ADG, 16-20% 3. Partial Efficiency of growth: ADG/(avg. DMI-expected DMI m ) efficiency of growth after removing FI for maintenance 4. Relative Growth Rate: 100 x [log end wt log start wt]/days on test Growth relative to instantaneous body size 5. Kleiber Ratio: ADG/avg test period LWT 0.75 weight gain per unit of metabolic body weight All measures are related to body size, growth and composition of gain
4 Maintenance requirements of beef cattle is largely unchanged over last 100 years (Johnson, Ferrell and Jenkins, 2003)
5 % Change in greenhouse gas emissions and global warning potential achieved through genetic improvement ( ) CH 4 NH 3 N 2 O GWP 100 Chickens layers Chickens broilers Pigs Cattle dairy Cattle beef Sheep Sources: Project for DEFRA by Genesis Faraday Partnership and Cranfield University (AC0204) from Hume et al. (2011), J. Ag. Sci., doi: /s Pork kg CO 2 e/kg pork; chicken kg CO 2 e/kg chicken; Dairy 1.3 kg CO 2 e/kg milk Beef kg CO 2 e/kg beef
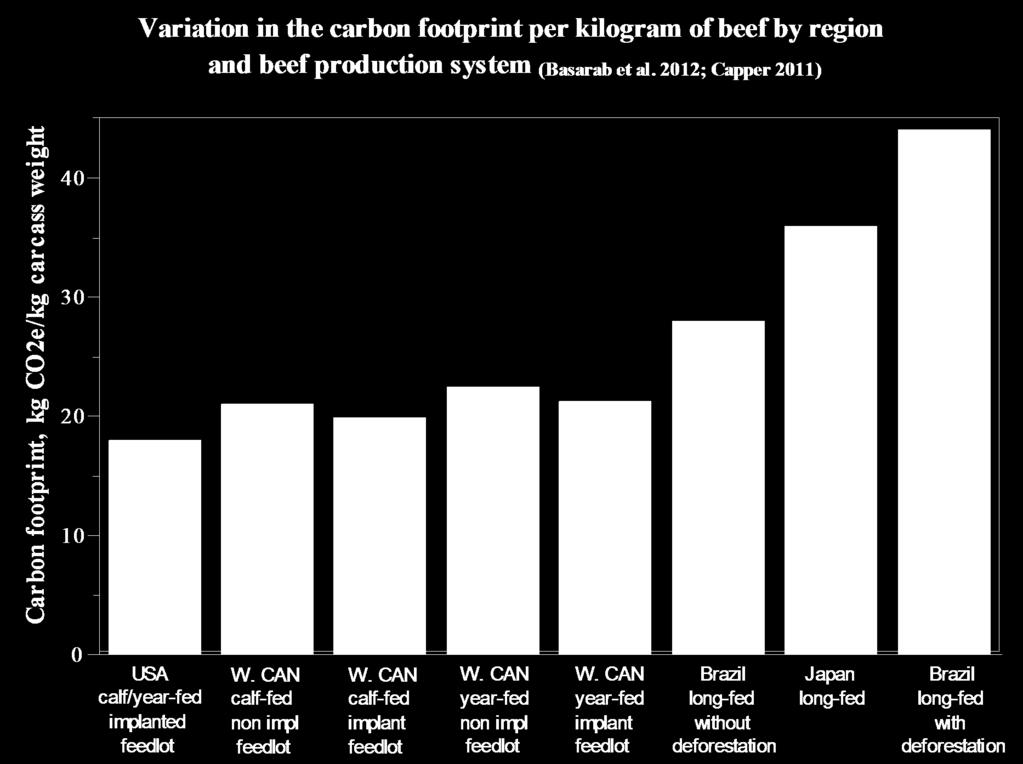
6
7 Figure 1. Breakdown of total greenhouse gas (GHG) emissions resulting from hormone free and growth implanted calf-fed and yearling-fed beef production systems (CO2 equivalents, 160 cow-herd assumed). Feeder 14.5% Feeder 15.1% Replacement bulls 1.3% Replacement bulls 1.3% Spring culled cows 3.9% Spring culled cows 3.9% Fall culled cows 3.2% Fall culled cows 3.1% Replacement heifers 3.4% Herd bulls 3.6% Productive cow 70.0% Replacement heifers 3.4% Herd bulls 3.5% Productive cow 69.6% Calf-fed, Hormone Free An imal GHG emissio n s = 9 2 2,1 0 7 k g CO2 e Ca lf-fed, growth implanted An imal GHG emissio n s = 9 2 8,3 4 4 k g CO2 e Feeder 35.4% Feeder 36.3% Replacement bulls 1.0% Spring culled cows 3.0% Productive cow 53.0% Replacement bulls 1.0% Spring culled cows 2.9% Productive cow 52.2% Fall culled cows 2.4% Fall culled cows 2.4% Replacement heifers 2.6% Replacement heifers 2.5% Herd bulls 2.7% Herd bulls 2.7% Yearling-fed, Hormone Free An imal GHG emissio s = 1,2 1 9,6 5 9 k g CO2 e Yea rling-fed, Growth Implanted An imal GHG emissio n s = 1,2 3 7,0 8 2 k g CO2 e Total GHG emissions include methane from enteric fermentation and manure, nitrous oxide from manure, carbon dioxide from energy use and nitrous oxide from cropping.
8 Energetic Efficiency in growing beef cattle Residual Feed Intake (RFI) also called Net Feed Efficiency: FEED INTAKE ADJUSTED FOR BODY SIZE AND PRODUCTION - growing cattle is the difference between an animal's actual feed intake & its expected feed requirement for maintenance of body weight, growth and changes in fatness RFI Mid RFI -RFI 2 - moderately heritable (h 2 = ) - reflects an animal s energy requirement for maintenance. RFI, kg as fed/day Olds College; 96 British bulls ( ) Cost difference: -RFI vs. +RFI 3.0 kg as fed/day x $0.15/kg x 140 days = $63 Diet (as fed basis): 76% barley silage; 30% barley grain & 3% beef sup. (32 % CP) Bull ID
9

10 Selection for low RFI will: 1. Have no effect on growth & animal size Phenotypic (r p ) & genetic correlations (r g ) are near zero Arthur et al. 2001; Basarab et al. 2003; Crews et al. 2003; Jensen et al r p = 0.00 P = 0.99 r p = 0.00 P = steers from 5 genetic strains fed a finishing diet and gaining 1.52 kg/day. No relationship to slaughter weight, hip height and gain in hip height (Basarab et al. 2003).
11 10 2. Reduce feed intake by 10-12% at equal body size & ADG rp = ; rg = (Arthur et al. 2001; Basarab et al. 2003, 2007, 2011;Herd et al. 2002) DMI, kg/hd/day hybrid bulls Olds College, Fall 2006 rp = Residual feed intake, kg DM/hd/day
12 3. Improve Feed Conversion Ratio (FCR) by 9-15% at equal body size & average daily gain rp= ; rg = ; Arthur et al. 2001; Basarab et al. 2003, Herd et al FCR, kg DMI/kg gain steers rp = 0.43 Lacombe RFI, kg as fed/day


; MEI =")
 Stomach complex: 7.6% LOW RFI (P=0.")
13 4. No effect on carcass fat provided RFI is adjusted for fatness (Basarab et al. 2003; Nkrumah et al. 2007) Phenotypic (r p ) & genetic correlations (r g ) are inconsistent & near zero (0.20 to 0.20) Classical Serial Slaughter Study: Total whole body composition (water, fat, protein, ash & energy); MEI = Retained energy + Heat Production Liver weight: 7.8% LOW RFI (P=0.007) Stomach complex: 7.6% LOW RFI (P=0.004) Heat production: 9.3% LOW RFI (P<0.001)
 Basarab et al. 2003; Nkrumah et al. 2007 LOW or -RFI MEDIUM RFI HIGH or +RFI 1.00 Time (0.")
14 Oxygen consumption (L/min) Lower heat production by 9-10% (MEI=RE+HP; HP=NEm + HIF) Basarab et al. 2003; Nkrumah et al LOW or -RFI MEDIUM RFI HIGH or +RFI 1.00 Time (0.5 hr)
15 Methane production (L/min) 6. Lower methane emissions by 15-30% & manure production by 15-20% Okine et al. 2001; Arthur et al. 2002; Nkrumah et al. 2007; Hegarty et al LOW or -RFI MEDIUM RFI HIGH or +RFI Time (0.5 hr)
16


17 Three Cross Ranch 2007 breeding season Mating Grp 1 +RFI -RFI Mating Grp 2 +RFI -RFI Mating Grp 3 +RFI -RFI X 123 cows X 121 cows X 48 cows Morison s Feedlot Jun Sep 2009 Feed Intake test, 240 feeders
18 Distribution of Residual Feed Intake (RFI) for TX BeefBooster bulls tested from Dec 11/2006 to Mar 8/2007. (barley silage:grain (60:40%) diet) n=73, mean=0.00 SD= R2 x 100 = 58.2% RFI, kg DM/day S WK29S JB38S JB418S WK103S 11S JB94S 74 8S DC25S 45 DC19S DC27S 52S AL139S 38 50S 109S 91S 77S S 14S S S 112S 420S S S 40S S AL150S JB101S WK20S WK98S DC24S 46 WK114S 403S JB87S JB68S JB24S RFI BULLS 9 +RFI BULLS Bull ID
19 7. No effect on bull fertility Wang, Ambrose, Colazo, Basarab et al., J. Anim. Sci Relationship (r p ) between RFI and breeding soundness in yearling beef bulls Traits n r p sign. 365-day SC, cm NS Front feet score NS Front leg score NS Hind feet score NS Disposition score NS Semen morphology NS Semen motility * Semen conc. score NS Progeny produced (27 sires) 0.00 NS No difference in culling reasons: 42.1% of +RFI & 41.5% -RFI bulls culled

20 Relationship between sire phenotypic RFI and average progeny phenotypic RFI (Three Cross Ranch) Average Progeny RFI, kg DM/day y = x, sire=13, R2 = 57.3% kg DM/day x $0.30/kg DM x 150 days = $15.84/hd Sire phenotypic RFI, kg DM/day Where r-square for growth curves was greater than 0.95 and progeny per sire is 2 or more. Slope equal for slaughter heifers and steers. 3.7% reduction in DMI (0.35 kg DM/d/9.5 kg DM/d); cow 13 kg DM/d x 3.7% x $0.15/kg DM x 365 = $26/cow
21
22 Effect of sire RFI on the carcass quality of their progeny Progeny performance Sires Sires During finishing +RFI -RFI Sign. Number of progeny Progeny carcass weight, kg NS Progeny carcass grade fat, mm NS Progeny ribeye area, cm NS Progeny marbling score NS Progeny yield grade NS Progeny lean meat yield, % NS NS, not significant, P>0.05


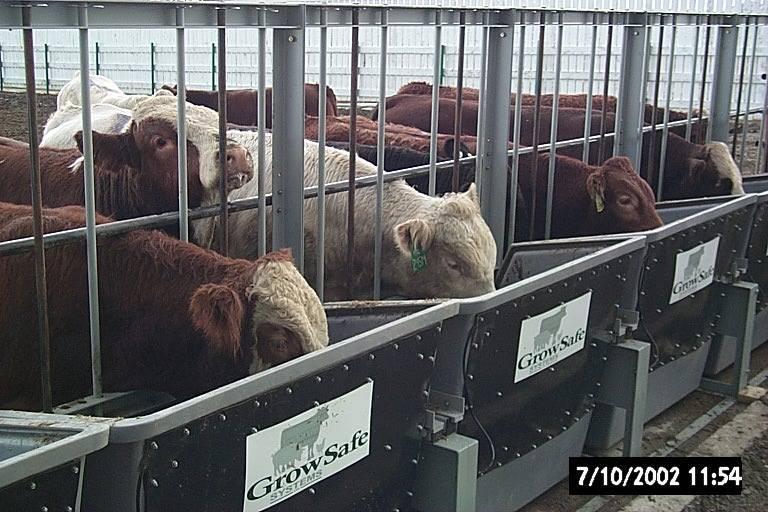
23 Individual Animal Feed Intake Facility, Lacombe Research Centre, AB, Canada Cow productivity & reproductive fitness 30% straw:70% grass hay (DM basis) 9.6% CP, 8.75 MJ ME/kg DM 56.6% barley straw:40.0% silage 3.4% Feedlot sup (32% CP) ad libitum twice daily
![8. No effect of RFI fat on age at puberty and pregnancy Cumulative % reaching puberty 1 0 0 80 60 40 20 0 A. [-RFI] n=94 [+RFI] n=89 P = 0.03 P = 0.40 P = 0.34 P = 0.](/docs-images/85/92707895/images/24-1.jpg "22 7 8 9 10 11 12 13 14 15 16 Age, mo P = 0.29 P = 0.99 P = 0.54 Cumulative % pregnant 1 0 0 80 60 40 20 0 B. P=0.49 P=0.76 P=0.47 P=0.38 P=0.68 (-RFI) n=94 (+RFI) n=96 P=0.80 P=0.")
24 8. No effect of RFI fat on age at puberty and pregnancy Cumulative % reaching puberty A. [-RFI] n=94 [+RFI] n=89 P = 0.03 P = 0.40 P = 0.34 P = Age, mo P = 0.29 P = 0.99 P = 0.54 Cumulative % pregnant B. P=0.49 P=0.76 P=0.47 P=0.38 P=0.68 (-RFI) n=94 (+RFI) n=96 P=0.80 P=0.80 P= Days from start of breeding season A. Levels of significance are given for cumulative percent of heifers reaching puberty by 9, 10, 11, 12, 13, 14 and 15 mo of age. B. Levels of significance are given for cumulative percent heifers pregnant by 2, 7, 12, 17, 22, 27, 32 and 37 d of the breeding season. Adapted from Basarab et al. (2011).
25 9. No effect of calving pattern RFI adj. for fat NS NS Cumulative Percent (%) NS NS 20 NS -RFI n= 75 n= 73 +RFI Days from start of calving

26 Productivity traits in -RFI and +RFI first calf heifers Trait Heifer RFI fat -RFI +RFI sign. Heifers exposed to breeding Calving difficulty, % NS Total calf death, % Calf death unknown, % Weaning rate, % NS Birth weight, kg NS Pre-weaning ADG, kg/day NS Weaning weight, kg NS Heifer productivity, kg/hd/yr NS Basarab et al. 2011; improved early life survival 1) better uterine env. due to more available nutrients, and 2) lower reactive oxygen species, proton leakage in mitochondria and oxidative stress at cell level.
 LOW RFI cow J1042 (5 yr-old Hereford-Angus cow in the spring of 2004; RFI adj = -2.")

27 10. No effect on pregnancy, calving or weaning rates No effect on kg calf weaned/cow exposed to breeding (Arthur et al. 2005; Basarab et al. 2007) LOW RFI cow J1042 (5 yr-old Hereford-Angus cow in the spring of 2004; RFI adj = kg as fed/day; 2003 weight at weaning =787 kg). HIGH RFI cow E1245 (8 yr-old Hereford-Angus cow in the spring of 2004; RFI adj = 2.83 kg as fed/day; 2003 weight at weaning = 755 kg). Note: cow RFI was adjusted for conceptus weight
28 Long-term (1997 to 2006) ultrasound back fat thickness of cows that produced -RFI and +RFI progeny Ultrasound Back fat thickness, mm Progeny RFI <=-0.44 Progeny RFI >=0.44 PC W04 PC W98 PC PC PB W99 PB W05 PC PB PC W01 PC PB W03 PC W97 PB W00 PC W02 PB PB PB PB 1996/ / / / / / / / / / Months from January 1, 1997 W06
29 Long-term ( ) body weight of cows that produced -RFI and +RFI progeny Body Weight, kg Progeny RFI <= Progeny RFI >= 0.44 PC PC W06 PC PC PC PC PC W04 W05 PC W01 W98 W99 PC W02 W00 W03 PB PB PB W97 PB PB PB PB PB 1996/97 PB 1997/ / / / / / / / / Months from January 1, 1997

30 Relationship between RFIfat as a heifer and subsequent changes in body weight as a cow 700 PreCalf-2 Mar Swath Grazing Body weight, kg PB1 May PC1 Aug PreCalf-1 Feb PB2 May PC2 Oct PB3 May +RFI PC3 Oct begin swath grazing at ~3.5-yr old -RFI reduces winter feeding costs by 47% Cow age, mo

31 Relationship between RFIfat as a heifer and subsequent changes in body weight as a cow 700 PreCalf-2 Mar PreCalf-3 Mar PreCalf-4 Mar PC5 Oct Body weight, kg PreCalf-1 Feb PB2 May PC2 Oct PB3 May PC3 Oct PB4 May PC4 Oct backfat, 4.5 vs. 7.4 at 59 mo backfat, 10.0 vs at 68 mo 400 PB1 May PC1 Aug begin swath grazing at ~3.5-yr old +RFI -RFI Cow age, mo

32 Repeatability of RFI in heifers to cows Peter Lawrence, 2012, University College Dublin, Ireland RFI measured as a heifer Traits High Med Low sign. DMI, kg/day 12 mo of age 6.66 a 6.07 b 5.60 c *** 24 mo of age 8.62 a 8.12 ab 7.68 b * 36 mo of age NS RFI computed on post-weaned heifers offered grass silage ad libitum and 2 kg concentrate/hd/day, and grass silage ad libitum during 1st and 2nd parity Feed savings:1 kg DM/cow/d x $0.15/kg DM x 365 = $55/cow/yr
33 Selection for low RFI-fat will: Have no effect on growth, body size or slaughter weight Reduce feed intake at equal weight and ADG Improve feed to gain ratio by 10-15% Reduce net energy required for maintenance Reduce methane production by 20-30% Have no effect on carcass yield & quality grade

34 Selection for low RFI-fat will: Little if any effect on age at puberty No effect on calving pattern in first calf heifers No negative effect on pregnancy, calving or weaning rate Positive effect on body fatness/weight particularly during stressful periods Reduce feed costs - $ /hd/d feeders, $19-38 mil. - $ /hd/d in cows; $ mil. Effect on feed intake on pasture??
35 Multi-trait Selection indices Feedlot profitability Index (FPI): Increase genetic potential of market progeny for feedlot profit (Crews et al. 2003) FPI = 7.43 EBV RFI-fat EBV ADG EBV WT365 RFI-fat =bull s RFI adjusted for final off-test ultrasound backfat thickness, kg DMI/day ADG = bull s post-weaning average daily gain, kg/day WT365 = bull s 365-day weight, kg Also consider carcass grade fat thickness, ribeye area and marbling
36 Multi-trait Selection indices Maternal Productivity Index (MPI): consistently wean heavy calves over a sustained herd life, while controlling cow feed costs (Mwansa et al. 2002). MPI = $3.00 EBV WWTd + $2.70 EBV WWTm $0.49 EBV COWT + $2.39 EBV SURV3 WWTd = direct weaning weight (30%) WWTm = maternal weaning weight (26%) COWT = cow weight (17%) SURV3 = ability of a female to produce at least 3 calves given she became a dam (27%) Also consider heifer/bull RFI-fat adjusted, age at first calving, calving ease and birth weight
37 Biological Mechanisms Contributing to Variation in RFI Body composition (5%) Feeding Patterns (2%) Heat Increment (9%) Digestion (14%) Others (e.g. protein turnover, ion pumping, protein leakage, thermoregulation, stress (60%) Richardson and Herd, 2004 Herd et al., 2004 Activity (10%)
38 Relationship of feedlot RFI with fecal DM, urine and methane production in steers fed at 2.5x NEm. Trait HIGH RFI LOW RFI Sign. level RFI, kg DM/day <0.001 Metabolic BW ADG, kg/day DMI, kg/day % Fecal DM, g/kg DMI Urine, g/kg MWT Urine N, g/kg DMI CH 4, L/day % CH 4, % of GEI % LOW RFI: ME higher, HP lower, RE higher (kcal/kg MWT)

39 Feed intake tests favor later maturing heifers and bulls
/0.5 = -0.")
40 Estimated Breeding value A Simple Example kg DM/d 0.0 kg DM/d h RFI individual contemporary group average Accuracy=40% Bull RFI-p EBV = kg DM/day x 0.40 = -0.5 kg DM/day Cow RFI-p EBV = 0.00 kg DM/day X 0.40 = 0.0 kg DM/day Expected Progeny Difference = ( )/0.5 = kg DM/day
41 Relationship between heifer post-weaning RFIfat and their subsequent lifetime productivity Productivity, kg weaned/mating opportunity kg calf weaned/ mating opportunity 222 mating opportunities 86 heifers RFI-fat, kg DM/day kg calf weaned/ mating opportunity 224 mating opportunities 83 heifers No difference in calf birth weight, pre-weaning ADG and weaning weight