2018 Corn & Soybean Market Outlook & Strategies Home, Kansas
|
|
|
- Hannah McBride
- 5 years ago
- Views:
Transcription


1 2018 Corn & Soybean Market Outlook & Strategies Home, Kansas DANIEL O BRIEN EXTENSION AGRICULTURAL ECONOMIST
 Grain Market Analysis & Outlook for 2018 Corn & Grain Sorghum Soybeans Cattle Prices 2) 2018 Grain Marketing Strategies to consider")
2 Topics to be discussed.. 1) Grain Market Analysis & Outlook for 2018 Corn & Grain Sorghum Soybeans Cattle Prices 2) 2018 Grain Marketing Strategies to consider & focus on seasonal opportunities that may come Dow Jones Industrial Index Weekly, October 2015 February 13, 2018


3 U.S. Dollar Index Weekly, August 2015 February 12, 2018 U.S. Dollar Index & Cash Corn Prices Monthly Chart: January 1973 through February 2, Avg. Index # February 13, 2018


4 U.S. Dollar Index & Cash Soybean Prices Monthly Chart: January 1973 through February 2, Avg. Index # February 13, 2018
5

6 Corn & Sorghum Markets
7 U.S. Corn & Sorghum Supply-Use Prospects LARGE 14.6 billion bu 2017 U.S. Corn Crop Large Supplies & Stocks are limiting Feedgrain Price$ s Low Price$ s are supporting Corn Use o Livestock Feed 2017/18 = bln bu (10 year high vs bb in 2007/08) o Ethanol 2017/18 = bln bu (Record high vs bb last year) o Other FSI 2017/18 = bln bu (Record high vs bb in 2016/17) o Exports 2017/18 = bln bu (vs bb in 16/17 & in 15/16) U.S. Corn & Grain Sorghum Stocks.. Corn: Large Stocks & % Stx/Use o End Stocks 2017/ bln bu (2 nd highest since 1987/88) o % Stocks/Use 2017/ % S/U (Highest since 2005/06) Grain Sorghum: Tighter Stocks & % Stx/Use than Corn o End Stocks 2017/18 24 Mln bu (15-55 mb since 2008/09) o % Stocks/Use 2017/18 6.4% S/U (Historically tight )


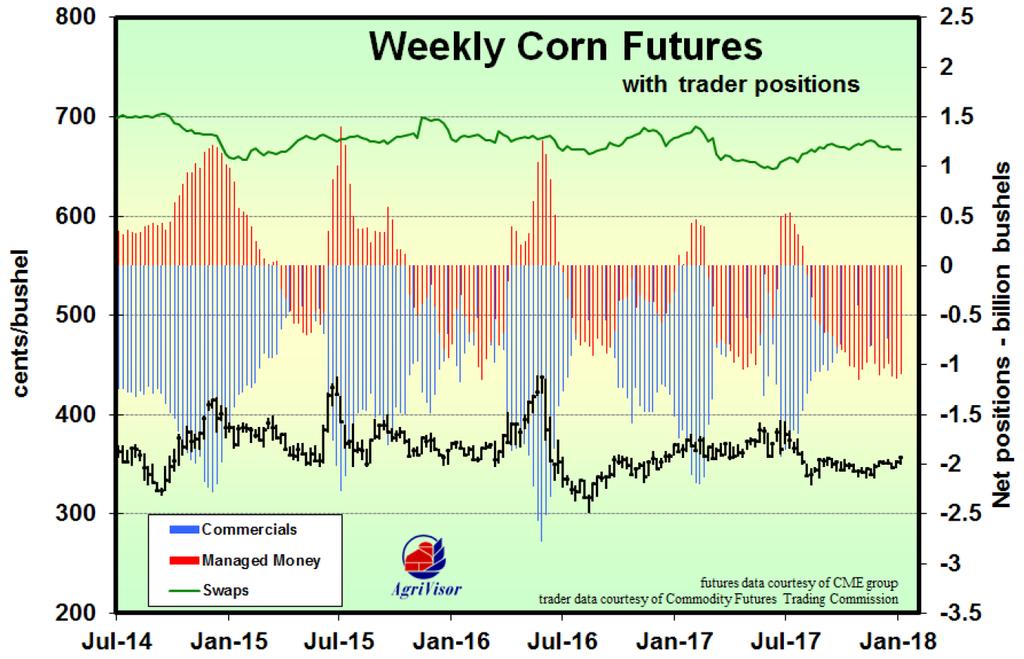
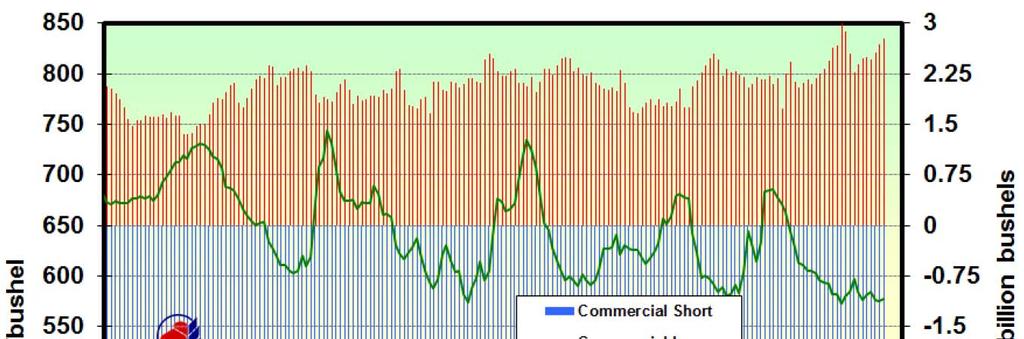
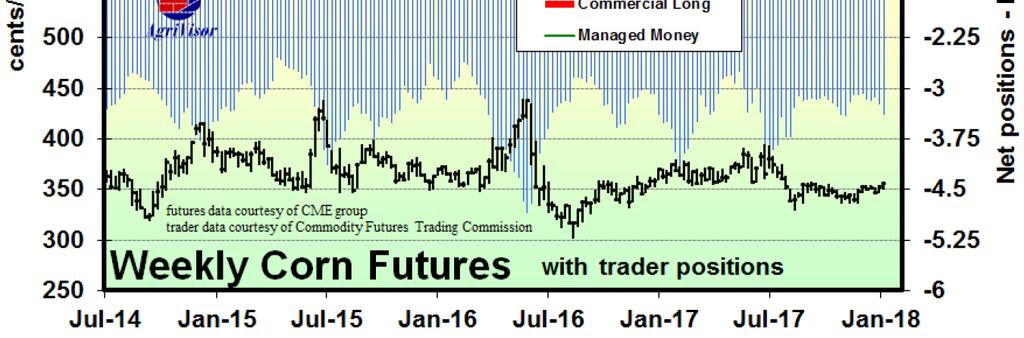
8 CME Corn Futures Weekly Chart: December 2008 January /13/2018 MAR 2018 $3.66 ¾ 2/13/2018 $2.90 $3.18 ¼ $3.01 $3.42 ¼ $3.67 CME Corn Futures Weekly Chart: December 2008 January /12/2018 MAR 2018 $3.66 ¾ 2/12/2018 $3.18 ¼ $3.01 $3.67
9
10 Corn Cash & Futures Prices ($/bu) Home, KS Local Elevators February 13, 2018 Price $/bu $7 $ /mo $6 $ /mo $5 $4 $3.67 $3.74 $3.82 $3.89 $3.96 $3.40 $3.49 $3.56 $3 $3.19 $3.28 $3.35 $2 $1 $1.85 $1.85 $0 Futures Low $ High $ Mktg Loan-Home, KS $0.43 under
11 $0.38 under
12 Kansas Corn Seasonal Cash $ Index Monthly: Long Term Average & New Crop MY 2017/18 Forecast 2017/18 Long Term
13 Grain Sorghum Cash & Corn Futures ($/bu) Home, KS Local Elevators February 13, 2018 Price $/bu $7 $ /mo $6 $ /mo $5 $4 $3.67 $3.74 $3.82 $3.89 $3.96 $3.15 $3.17 $3.32 $3 $3.12 $3.27 $2.87 $2 $1 $1.81 $1.81 $0 Futures Low $ High $ Mktg Loan-Home, KS $0.51 under

14 $0.51 under
15 Crop BUT still Large Supply Domestic Use & Exports % Stocks/Use & Prices


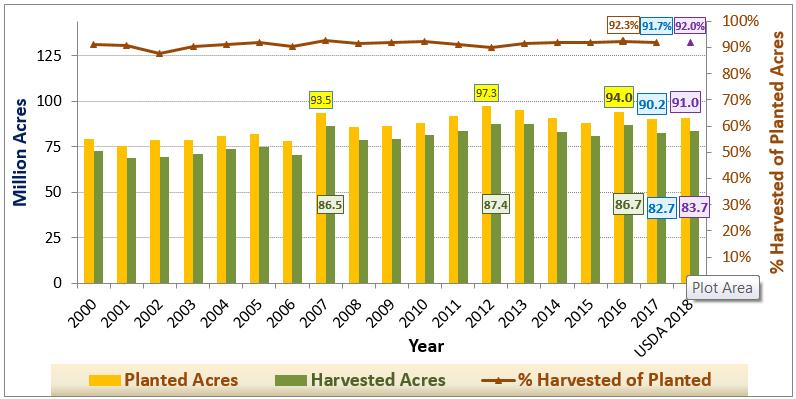
16 U.S. Corn Acreage For 2018??? UP 0.5 to 1 million acres


17 U.S. Corn Yields USDA 2017 USDA Forecast = bu/ac 2018 Trend Yield??? 170 bu/ac ( trend) U.S. Corn Production & Supplies 2018 Corn Crop??? U.S. Corn Production of bln bu?

18 U.S. Corn Use By Category

19 U.S. Corn Use By Category +6.0% +5.1% +2.2% 0.2% +3.8% Prices to decline


20 U.S. Corn Ethanol Use Weekly thru February 2, 2018 U.S. Ethanol Prodn, Stocks, & Trade Thru 2/2/2018

21 U.S. Corn Exports Weekly thru February 1, 2018


22 U.S. Corn Ending Stocks & % Stx/Use % End Stocks-to-Use , , ,731 1, ,295 2,352 2,472 6,000 5,000 4,000 3,000 2,000 1,000 0 Million Bushels Marketing Year


23 U.S. Corn % Stocks/Use vs Price$ U.S. Corn % Stocks/Use vs Price$ LESS Flexible $ responses Corn % Stx/Use has trended larger for 5 years running into low $ flexible areas Δ Supply > Δ Price$ MORE Flexible $ responses
24 World Corn (Maize) Production Regions


25 World Corn Supply, Use & Stocks World Crop BUT still Large Supply China EU Brazil FSU-12 So. Africa Mexico Argentina Canada


26 U.S. Corn Price$ vs World-China % S/U MY 1973/74 through New Crop MY 2017/18 Note impact of China Grain Stocks policies on World grain markets!! Total vs Accessible World Corn Stocks

27 Soybean Markets
28 U.S. Soybean Supply-Use 2017 U.S. Soybean Production & record HIGHS Large Soybean Stocks in U.S. & So. America** limit Price$ s Low Price$ s support Use in New Crop MY 2017/18 *** o Soy Crush 2017/18 = bln bu (Record vs bb 1 year ago) o Exports 2017/18 = bln bu (2 nd highest vs record bb 1 year ago) o Total Use 2017/18 = bln bu (2 nd highest vs bb 1 year ago) o SBM Use 2017/18 = 46.5 mln tons (vs in MY 2016/17 & 45.1 in MY 2015/16) U.S. Soybean Market Prospects Strong Use & Exports - BUT Large Stocks, & Weaker Prices U.S. soybean exports in 2017/18 to be historically large in spite of large 2017 South American Production (BUT declining #s) Depends on continued growth in import demand from China, EU, Southeast Asia, Mexico, & elsewhere (Threat of trade disputes!) Problems have emerged in fall-winter re: 2018 South American soybean crop risk (i.e., La Nina effects, etc.)
 o % Stocks/Use 2017/18 12.7% S/U (High vs 18.")
 o End Stocks 2017/18 6.0 mln bales (2.75 & 3.8 mb last 2 years) o % Stocks/Use 2017/18 33.6% S/U** (15.1% & 30.")
29 U.S. Soybean & Cotton Stocks.. Soybean: Large Stocks & % S/U o End Stocks 2017/ mln bu (High vs 574 mb in 2006/07) o % Stocks/Use 2017/ % S/U (High vs 18.6% in 2006/07) Cotton: Large 2017 Crop & Growing Stocks o Production 2017/ mln bales (17.2 & 12.9 mb last 2 years) o End Stocks 2017/ mln bales (2.75 & 3.8 mb last 2 years) o % Stocks/Use 2017/ % S/U** (15.1% & 30.2% last 2 years) CME Soybean Futures Monthly Chart: November 2008 December January 2, 2018 MAR 2018 $10.11 ¾ 2/13/2018 $10.12 $7.76 ¼ $8.53 $9.00 ¼


30 CME Soybean Futures Monthly Chart: November 2008 December January 2, 2018 MAR 2018 $10.11 ¾ 2/13/2018 $10.12 $8.53 $9.00 ¼


31 $0.80 under
32 $0.85 under


33 Soybean Cash & Futures Price$ s Home, KS Local Elevators - February 13, 2018 Price $/bu $16 $12 $8 $ /mo $ /mo $10.12 $10.22 $10.32 $10.34 $10.24 $10.19 $9.30 $9.58 $9.35 $9.18 $9.43 $9.20 $4 $4.92 $0 Futures Low Price$ High Price$ Mktg Loan-Home, KS
34 Kansas Soybean Seasonal Cash $ Index Monthly Prices: Long Term Average + New Crop MY 2017/18 MY 2017/18 Long Term Record Crop and Large Supply Record Use & Exports Stocks/Use & Prices


35 U.S. Soybean Acreage For 2018??? U.S. Soybean Planted Acres UP 0.5 to 1 million ac. U.S. Soybean Yields USDA 2017 = 49.5 bu/ac; 2018 Forecast = 48.4


36 U.S. Soybean Production & Supplies U.S. Soybean Use & End Stocks


37 U.S. Soybean Use & End Stocks U.S. Soybean Supply-Demand MY 2006/07 thru MY 2017/18


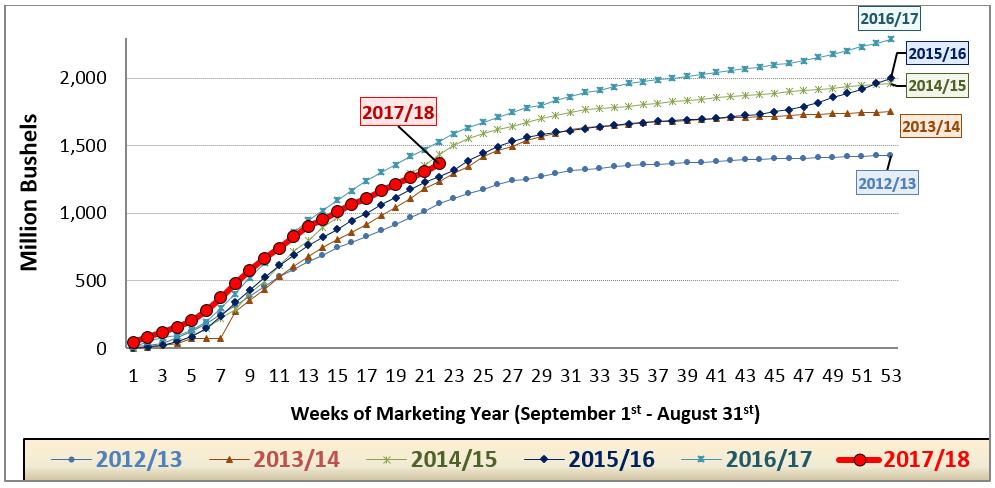
38 U.S. Soybean Exports Weekly through Dec. 21st


39 U.S. Soybean Ending Stocks & % Stx/Use % End Stocks-to-Use 15% 12% 9% 6% 3% 0% 5.4% 4.5% 4.5% 2.6% % 5.0% % % 10.8% ,000 2,500 2,000 1,500 1, Million Bu. Marketing Year

40 U.S. Soybean % Stocks/Use vs Price$ U.S. Soybean $ vs U.S. Stx-to-Use MY 1973/74 through Next Crop MY 2017/18


41 World Soybean Supply, Use & Stocks

42 World Crop U.S. Crop Foreign Crop Canada China Brazil** Argentina** Paraguay India South America Soybean Supply-Demand MY 2006/07 thru MY 2017/18


43 Beg. Stocks Production Total Supply Crush Total Use Trade End Stocks


44 Soybean Importer Purchases China 41.2 mmt in 7 years +13% /yr Million Metric Tons % /yr % /yr % /yr % /yr 26 China EU-28 SE Asia Mexico Rest of World 9.1 mmt in 7 years 2010/ / / / / / / /18 China Soybean Supply-Demand Trends MY 2006/07 thru MY 2017/18


45 U.S. Soybean$ vs World %Stx/Use MY 1973/74 through New Crop MY 2017/18 Forecast for 2018+??? Continued Demand Growth** Questions? Daniel O Brien Extension Ag Economist Blog: KSUGrains on Twitter & Facebook