Irrigation and Nitrogen Management
|
|
|
- Erik Hood
- 5 years ago
- Views:
Transcription
1 University of California Nitrogen Management Training for Certified Crop Advisers MODULE 4 Irrigation and Nitrogen Management Larry Schwankl, PhD UC Cooperative Extension, Kearney Ag Extension Station Allan Fulton UCCE Farm Advisor, Tehama, Glenn, Colusa, and Shasta Counties
2 Irrigation and Nitrogen Management Successful nitrogen management depends on efficient irrigation water management: Nitrate is mobile and moves with water. You can apply the right amount of N in the root zone, but N can leach past the root zone unless the correct amount of water is applied at the correct time. Inefficient irrigation may result in N-deficient crops and potentially add nitrates to groundwater.
3 Irrigation Efficiency Measure of how much of the applied water goes to reasonable and beneficial uses. The major beneficial use is to supply plant water needs and grow productive crops. Other beneficial uses include salt leaching and frost protection, but both of these can lead to N leaching if not carefully done. Non-beneficial uses or losses are: Deep percolation below root zone except the amount needed to manage salinity Tailwater runoff that is not reused

4 Irrigation Efficiency: Calculation Beneficially-Used Water Irrigation Efficiency (%) = x 100 Total Water Applied What is a realistic efficiency? 70% minimum eventually required by regulations 85-90% is an impressive efficiency to target

5 Irrigation Efficiency Different people arrive at different estimates for Irrigation Efficiency. Why? Field scale vs Watershed or basin scale Single irrigation vs Sum of several irrigations in a season
6 How Do We Become More Efficient Irrigators?
7 Achieving Efficient Irrigation Where to begin: Use readily available information to look for situations where the choice of crop, soils, and irrigation method do not match up well. Fertilizer bills Electricity, fuel, and water bills Production history

8 Soil texture and its influence on leaching 1. Sprinkler 2. Drip and microsprinkler 3. Flood 4. Furrow Greater chance of leaching
9 Infiltration and N Leaching Both light and heavy soil types can have a wide range of soil intake rates. Soil moisture, soil mineralogy, soil structure, and tillage are key elements. Cumulative Infiltration (inches) Panoche Clay Loam Time of Year Influences Pre Plant 1st Irrig. 2nd Irrig. 3rd Irrig Time in Hours
10 How Do We Become More Efficient Irrigators? Know how much water to apply
11 Irrigation Scheduling Determining how much water to apply - Quantify how much water has been used by the crop since the previous irrigation or rainfall - When the correct amount of water is applied at the proper time, potential for deep percolation and leaching of nitrate is minimized.


12 Irrigation Scheduling: Soil Monitoring Approach There are numerous soil moisture monitoring techniques, devices, and services available to growers. Feel Method, squeeze soil in hand to estimate its moisture level Sophisticated devices continuously monitor soil moisture and upload data to online databases growers can check.


13 Irrigation Scheduling: Soil Monitoring Approach: Drawbacks Most soil monitoring techniques tell when to irrigate, but not all provide how much to irrigate. Effectiveness is subject to representative placement of sensors and good understanding of the crop root zone.


14 Irrigation Scheduling: Plant Monitoring Approach Monitoring the plant itself for signs of water stress Relatively new approach, equipment and knowledge still developing
15 Irrigation Scheduling: Plant Monitoring Approach: Drawbacks Limited information, available for some crops & not for others Interpreting pressure bomb readings and crop stress levels for most CA crops is unexplored Methods tend to be labor intensive working toward automation Crop stress and readings tell you when to irrigate (plant is stressed) but not how much How much water is needed can be learned with experience or by coupling plant monitoring with other approaches (i.e. ET)


16 Irrigation Scheduling: Weather Monitoring Approach Climatic conditions drive the water use of plants. Monitor the weather and use it to estimate crop water use (evapotranspiration).


17 Irrigation Scheduling: Weather Monitoring Approach California has the CIMIS network to provide weather information and estimates of Reference Crop ET (ET of pasture grass).

18 Irrigation Scheduling: Weather Monitoring Approach Relates estimate to irrigation system design and performance Tells us both when and how much to irrigate
19 How Do We Become More Efficient Irrigators? Apply the correct amount of water with a good irrigation system

20 Sound Irrigation System Design Concepts Ability to measure applied water and thus control leaching Our ability to manage water improves if we have the ability to measure it.


21 Sound Irrigation System Design Concepts How much water is being applied? Measure with a flow meter Saddle Propeller Meter, the most common type of flow meter, attached by cutting through the pipe. It is sufficiently accurate for agricultural purposes. Saddle propeller meter attached to pipe


22 Sound Irrigation System Design Concepts How much water is being applied? Measure with a flow meter Electronic flow meter, known as a MagMeter. It is a very accurate type of meter, but locating it near elbows and forks can alter pressure and decrease accuracy. Debris in water can hinder propeller meters; installations with weeds and trash in the water need special flow meter devices.

23 Sound Irrigation System Design Concepts How much water is being applied? Irrigation system evaluation Water application rate and uniformity
 will penetrate the crop root zone depending on the irrigation set time Soil Nitrate Nitrogen (NO3-N) (ppm) 0 25 50 75 Soil Depth (inches) 0 21 42 84 126 Site 1 Site")
24 Irrigation System Evaluation: Application Rate A measure of the field-wide water application rate Most easily measured in pressurized irrigation systems Relates to how deep water (and nitrogen) will penetrate the crop root zone depending on the irrigation set time Soil Nitrate Nitrogen (NO3-N) (ppm) Soil Depth (inches) Site 1 Site 2


25 Rapid Assessment Step 1 Determine soil moisture depletion since last irrigation (ET)
26 Rapid Assessment Step 2 Measure Flow and Determine how much water has been applied (flow rate) Flow meters the best way - on all pumps Irrigation District information Pump test - discharge will change (often a lot) if groundwater level changes.
27 Rapid Assessment Step 2 Measure Flow and Determine how much water has been applied (inches) D = (Q 449) x T A D = inches of water applied Q = gpm (gallons per minute) flow rate T = hours irrigation set time A = acres in irrigation set *If flow is measured in cfs, no need to divide by 449 in equation
28 Rapid Assessment Step 3 Is the risk of deep percolation high? Compare the amount applied to the amount used since last irrigation. Leaching is likely to occur when runoff is minimal and applied water is much greater than crop use.
, Coefficient of Uniformity (CU), and Emission Uniformity (EU).")
29 Irrigation System Evaluation: Irrigation Uniformity A measure of how evenly water is applied to the field Given as percentage with 100 % being perfect Various measures including Distribution Uniformity (DU), Coefficient of Uniformity (CU), and Emission Uniformity (EU). Knowing the general concept is more important than the details about the different measurement methods of irrigation uniformity.
30 Importance of Irrigation Uniformity Poor irrigation uniformity means that portions of the field are getting less water than others. Most growers do not want to under-irrigate even a portion of the crop, so they irrigate to make sure the area receiving the least water gets enough. Some portions of the field receive too much water. Too much water leads to deep percolation losses (leaching of water). If nitrate is in the soil profile, it can be leached with the water. Poor irrigation uniformity makes N leaching more likely.

31 Importance of Irrigation Uniformity 140 Average DUs by Irrigation Method MIL Micro- Sprinkler Micro-Drip Impact Rotator Flood Hand Move Wheel Line Center Pivot # of Evals Average DU
32 Types of Irrigation Systems
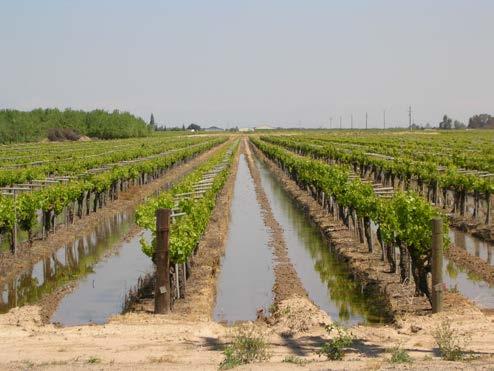
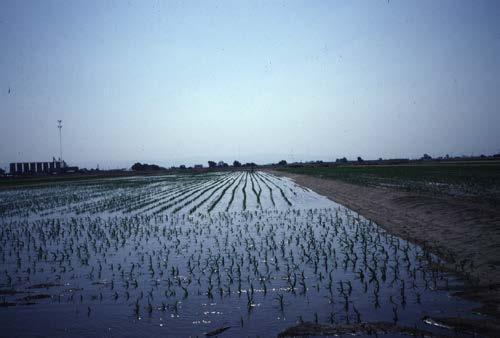
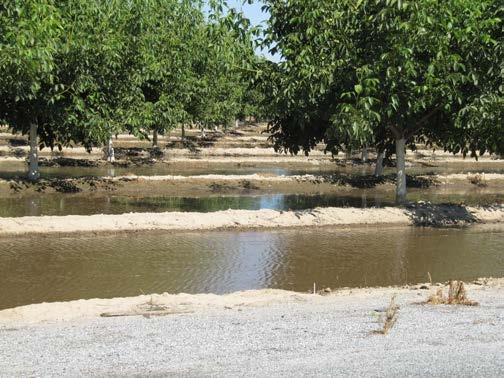
33 Surface Irrigation Furrow and border strip irrigation

34 Surface Irrigation: Furrow Irrigation Example Water flows field top to bottom in furrow irrigation. Blue segment represents water on field surface; pink is infiltration. More water has infiltrated at field head, where it has been present the longest.


35 Surface Irrigation: Furrow Irrigation Example cont d. Water is run off the field tail to allow enough to infiltrate there to satisfy the crops needs. The runoff should be collected and reused. End of irrigation event. Water has infiltrated field tail, and field head has received excess. This water goes to deep percolation, leaching any N present.
36 Surface Irrigation: Recognizing Non-Uniform Flood or Furrow Irrigation Total time water ran on an irrigation set Time it takes water to reach end of field 398 minutes 158 minutes = Advance Ratio = 2.5 Advance Ratio > 2 indicates reasonable uniformity


37 Surface Irrigation: Improvement with High Flow Rates Water losses can be from deep percolation and tailwater runoff. Losses from deep percolation and tailwater runoff are competing outcomes of surface irrigation management: Design steps that improve irrigation uniformity and reduce deep percolation probably increase tailwater runoof Design steps to reduce tailwater runoff probably cause more deep percolation and risk of N leaching

38 Surface Irrigation: Improvement with Shortened Field Length Shortening field length gets water across the field more quickly, resulting in less deep percolation.
39 Surface Irrigation: Improvement with Shortened Field Length Example Reduce field length Often the most effective option Also often the least popular option 1250 Field Fields Irrigation Amount


40 Surface Irrigation: Improvement with Increased Field Slope Example slope slope Irrigation Applied
 Narrow check (100 ) Irrigation Applied 5.1 4.")
41 Surface Irrigation: Improvement of Border Check Irrigation Increase the flow per foot of border check Field Study: Usually run 2 valves per check; make checks half as wide and run 1 valve at a time more flow per foot of check width Wide check (200 ) Narrow check (100 ) Irrigation Applied


42 Surface Irrigation: Improvement with Torpedoes Using a torpedo gets water across the field more quickly, resulting in less deep percolation.
43 Surface Irrigation: Improvement with Torpedoes Example Field study: Newly cultivated furrows, some torpedoed and some not Torpedoed Furrow Non-torpedoed Furrow Irrigation Water Applied


44 Surface Irrigation: Improvement by Reusing Tailwater Runoff Collecting and reusing tailwater runoff makes the best use of expensive and limited irrigation water. Water is collected and carried to a sump pump by underground pipelines, where it is pumped to a standpipe for use. A small pond is used to collect tailwater, which is then pumped back to the head of the field using a sump pump.


45 Surface Irrigation: What if these options for improvement are not practical or effective? A change in irrigation method may be needed Possibly target specific irrigation events (pre-irrigation of row crops) Alternatively, make a wholesale change in methods Often there will be a corresponding improvement in crop productivity when poorly performing irrigation systems are improved


46 Pressurized Irrigation Reduce the inherent control of the soils on irrigation efficiency Invest in irrigation hardware and sound irrigation system design to gain more management control of applied water

47 Pressurized Irrigation: Sprinkler How can sprinkler system performance be improved? Know the application rate We provide water use information in units of inches of water use (per day or per week..) Need to know the system application rate (in/hr) in order to know how long to run the system
48 Pressurized Irrigation: Sprinkler Application Rate Calculating system application rate: 96.3 x (nozzle discharge in gpm) i (in/hr) = Spacing along lateral (ft.) x Spacing between laterals (ft.)

49 Pressurized Irrigation: Sprinkler Application Rate Nozzle Discharge:

50 Pressurized Irrigation: Sprinkler Application Rate Nozzle Size (diameter): Where to find this information? 1. Engraved on side of brass/steel nozzle 2. For a worn nozzle, compare opening with drill bit sizing 3. Plastic sprinklers often color coded by manufacturer

, inserted into sprinkler")
51 Pressurized Irrigation: Sprinkler Application Rate Determining Pressure: Pressure gauge with Pitot tube attached (above), inserted into sprinkler opening (left)

52 Pressurized Irrigation: Sprinkler Application Rate Determining Pressure (another method):

53 Pressurized Irrigation: Sprinkler Application Rate Calculating Application Rate (another method): 1. Time how long it takes to fill pale of known volume 1. This is the application rate in gpm 1. Plug into formula to get application rate in in/hr


54 Pressurized Irrigation: Sprinkler Application Uniformity How can sprinkler performance be improved? Determine and improve sprinkler application uniformity
55 Pressurized Irrigation: Sprinkler Application Uniformity Determining uniformity with a catch can test. A consultant or mobile team can be hired to conduct this type of test and provide suggestions for improvement.


56 Pressurized Irrigation: Microirrigation Application Uniformity Irrigation uniformity can be a problem with microirrigation systems too. What causes non-uniformity? Poor microirrigation system design pressure differences too great


57 Pressurized Irrigation: Microirrigation Application Uniformity Pressure differences cause changes in rates of discharge, affecting uniformity: The discharge from a drip emitter is shown on the Y-axis. As pressure increases (X-axis), so does discharge. Similar to the drip emitter, the microsprinkler flow rate represented here increases as pressure increases.

 drippers (left) and microsprinklers")
58 Pressurized Irrigation: Microirrigation Application Uniformity How do system designers address pressure differences that cause non-uniformity? Pressure-compensating (PC) drippers (left) and microsprinklers (right) are used to equalize discharge when pressure is not constant.

59 Pressurized Irrigation: Microirrigation Application Uniformity What causes non-uniformity? Maintenance problems Clogging can lead to serious non-uniformity problems. Almost all clogging problems can be solved or prevented with good filtration and routine maintenance.


60 Pressurized Irrigation: Microirrigation Application Uniformity Maintenance Tips: Clean and flush filters regularly Flush lines regularly Automatic backflush system Silt and clay are small enough to make it through filters but often settle in the lateral lines of drip tape and tubing.


, and groundwater is more prone to")
61 Pressurized Irrigation: Microirrigation Application Uniformity Maintenance Tips: Monitor for leaks and breaks Check lines for chemical clogging at least twice per season Many of the most successful microirrigation system users check for leaks and breaks every time the system is turned on. This picture shows where a microsprinkler has been broken off. Check for bacteria or calcium buildup around emitters and nozzles. Surface waters are prone to organic problems (above right), and groundwater is more prone to chemical precipitation problems (above left).
62 Fertigation
63 Accounting for N in Irrigation Water Converting between Nitrate and Nitrate-N Nitrate reported as: nitrate (NO 3- ) or as nitrate-n (NO 3- -N) ppm (NO 3- ) = ppm (NO 3- -N) x 4.43 ppm (NO 3- -N) = ppm (NO 3- ) 0.23 Converting from ppm in irrigation water to lbs/ac-in ppm (NO 3- ) x = lbs N / ac-in ppm (NO 3- -N) x 0.23 = lbs N / ac-in Converting from ppm in irrigation water to lbs/ac-ft ppm (NO 3- ) x 0.62 = lbs N / ac-ft ppm (NO 3- -N) x 2.79 = lbs N / ac-ft
 through fertigation Fertigation")

64 Fertigation in Surface and Pressurized Systems Source of nutrients (very often N) through fertigation Fertigation (with anhydrous ammonia and UAN) is commonly used in sprinkler and microirrigation, but is also done in flood irrigation
65 Fertigation in Surface Systems Infiltration rate of soil controls uniformity:
66 Fertigation in Surface Systems: Example Irrigation started with clean water Distance along field - feet
67 Fertigation in Surface Systems: Example cont d. Liquid sulfur drip started when fresh water advance at 750. Sulfur begins to quickly move down the furrow. Liquid sulfur dripping Distance along field - feet
68 Fertigation in Surface Systems: Example cont d. Clean water advance at 800 Injected material advance at 500 Liquid sulfur dripping Distance along field - feet
69 Fertigation in Surface Systems: Example cont d. Liquid sulfur drip was started when fresh water advance was at 750. Sulfur caught up by 850. Liquid sulfur drip Distance along field - feet
70 Fertigation in Surface Systems: Flood Irrigation Example Fertigation Nitrogen Uniformity Added: Applied of application (lbs/ac) During entire irrigation When freshwater advance to 75% of field length When freshwater advance to 85% of field length *field length = 1200, avg. irrig. amt = 7.1 Improved the uniformity of fertilizer application and allowed a smaller amount to be applied per irrigation.
 as water applied by the")

71 Fertigation in Pressurized Systems Goals: Material injected into the drip system should be applied as evenly (uniformly) as water applied by the system. It takes time for water and injected chemical to move through a drip irrigation system. Target fertilizer in the root zone where crop can use it
72 Fertigation in Pressurized Systems: Uniformity Trees & vines: injections should last at least 1 hour for uniform application, and at least 1 hour of clean water irrigation should follow so that all fertilizer is delivered to the crop. Row crop drip: injections should be at least 2 hours in length, and there should be at least 2 hours of clean water irrigation following injection.
73 Fertigation in Pressurized Systems: Orchard Uniformity Example Water / chemical travel times through the pipelines and drip lateral lines for several vineyard and orchard field sites: Site Mainline and Submain Lateral Line Total Travel Travel Time (min.) Length (ft) Travel Time (min.) Length (ft) Time (min)

74 Fertigation in Pressurized Systems: Root Zone Targeting Example When during the irrigation do you inject (for different soil types)? Loam Surface Drip Silt Loam 2 hour injection near start of 27 to 36 hour Irrigation. N levels elevated at 30 in. 2 hour injection near end of 27 to 36 hour Irrigation N confined to top 10 in. 2 hour injection near start of 27 to 36 hour Irrigation N levels elevated at 30 in 2 hour injection near end of 27 to 36 hour Irrigation N confined to top 6 in. (Blaine Hanson, Fertigation with Microirrigation )

75 Fertigation in Pressurized Systems: Root Zone Targeting Example Silt Loam When during the irrigation do you inject? 2 hour injection near start of Irrigation *Microsprinklers 2 hour injection near end of Irrigation (Blaine Hanson, Fertigation with Microirrigation )
76 Other Issues Faced by California Growers


77 Salinity It is a fact that leaching is necessary to sustain crop production where salinity approaches crop tolerance. This is considered a beneficial water use. How do we leach to manage root zone salinity without leaching nitrogen fertilizers?
78 Salinity: Tips for Leaching Salts and Not Nitrate Leaching is not necessary every irrigation or perhaps even every season but only when crop tolerances are approached. Periodic soil and irrigation water testing will help determine when and how much leaching is needed. The amount of applied water must exceed ET, and the soil water content must exceed field capacity for leaching to occur. Leaching is most efficient in the winter when land is fallow or crops are dormant and should not coincide with critical periods of nitrogen uptake and fertilization.
79 Rainfall Rainfall can be a source of water for leaching. We have little control over the amount and timing of rainfall. Can we control the N available to be leached at the time of rainfall? Coordinate timing of N fertilizers with the period of highest crop demand Apply reasonable rates for crop production levels Minimize amount of N in the root zone going in to rainy season
80 Contributing partners: University of California Agriculture and Natural Resources web: ucanr.edu University of California Nitrogen Management Training for Certified Crop Advisers Course materials available at: ciwr.ucanr.edu/nitrogenmanagement California Institute for Water Resources University of California Agriculture and Natural Resources web: ciwr.ucanr.edu California Department of Food & Agriculture (CDFA) web: California Association of Pest Control Advisers (CAPCA) web: capca.com