Water Sustainability: A framework for implementing continuous improvement strategies
|
|
|
- Christopher Warren
- 5 years ago
- Views:
Transcription
1 Water Sustainability: A framework for implementing continuous improvement strategies Marty Matlock, PhD, PE, BCEE Executive Director, Office for Sustainability Professor of Ecological Engineering Biological and Agricultural Engineering Department University of Arkansas mmatlock@uark.edu

2 Everything is Connected 2

3 Everything is changing 3

4 We are all in this together 4

5 The trouble with water is everyone needs it.


6 Global Scarcity is developing Rockstrom et al Planetary Boundaries, 2009


7 Regional Scarcity is here now Hoekstra et al Global Monthly Water Scarcity, 2012

8 Human Activities Dominate Earth Croplands and pastures are the largest terrestrial biome, occupying over 40% of Earth s land surface 8
9 Agricultural Sustainability Challenges 1. In order to meet projected demands for food, feed, fiber and fuel from the land we must increase production (output per year) by 50 to 100 percent in the next four decades. 2. If we want to preserve biodiversity and other land-based ecosystem services we must freeze the footprint of agriculture. 3. Thus yield (output per area) must more than double in the next 40 years in the US and Europe. 4. Energy scarcity will drive innovation while limiting expansion of productivity. 5. Water scarcity will limit productivity globally.
10 Persistent vs Important Issues Persistent Issues Locally grown GMO crops Organic crops Important Issues Water use efficiency Soil erosion Soil organic carbon Natural Land use change biodiversity loss From Jason Clay, WWF
11 Why do retailers care about Sustainability? Production Processing Safety Distribution Security Stability Direct Mktg Wholesale Retail Consumption 11

12 US Ag Sustainability Initiatives

13 X629 (DRAFT) Framework for Sustainable Agriculture
14 Sustainability is Continuous Improvement 1. Define A. Define Sustainability for the Enterprise B. Define Key Performance Indicators C. Select Metrics for KPIs 2. Measure A. Benchmark KPI Metrics B. Set Goals for Each KPI C. Develop Strategy to Meet Goals 3. Implement A. Implement the Strategy B. Measure, Assess and Report Results C. Adapt Strategy to Improve Outcomes 14
15 Sustainability is Continuous Improvement 1. Define A. Define Sustainability for the Enterprise B. Define Key Performance Indicators C. Select Metrics for KPIs 2. Measure A. Benchmark KPI Metrics B. Set Goals for Each KPI C. Develop Strategy to Meet Goals 3. Implement A. Implement the Strategy B. Measure, Assess and Report Results C. Adapt Strategy to Improve Outcomes 15
16 Sustainability is Continuous Improvement 1. Define A. Define Sustainability for the Enterprise B. Define Key Performance Indicators C. Select Metrics for KPIs 2. Measure A. Benchmark KPI Metrics B. Set Goals for Each KPI C. Develop Strategy to Meet Goals 3. Implement A. Implement the Strategy B. Measure, Assess and Report Results C. Adapt Strategy to Improve Outcomes 16
17 Framework of Goals Aspirational Long Vision Management Strategic Tactical Operational Planning Horizon Short Breadth of Goal


18 Sector-Level Continuous Improvement Versus Site Certification KPI Metric Benchmark Year Continuous Improvement Approach Minimum Acceptable Performance Level (MAPL) Site Certification Approach
19 Sustainability Framework 1. Define A. Define Sustainability for the Enterprise B. Define Key Performance Indicators C. Select Metrics for KPIs 2. Measure A. Benchmark KPI Metrics B. Set Goals for Each KPI C. Develop Strategy to Meet Goals 3. Implement A. Implement the Strategy B. Measure, Assess and Report Results C. Adapt Strategy to Improve Outcomes 19
20 How to Move the Curve


21 Sustainability Framework 1. Define A. Define Sustainability for the Enterprise B. Define Key Performance Indicators C. Select Metrics for KPIs 2. Measure A. Benchmark KPI Metrics B. Set Goals for Each KPI C. Develop Strategy to Meet Goals 3. Implement A. Implement the Strategy B. Measure, Assess and Report Results C. Adapt Strategy to Improve Outcomes 21


22 Water KPIs: Not all water is equal Green water footprint volume of rainwater evaporated or incorporated into product. Blue water footprint volume of surface or groundwater evaporated, incorporated into product or not returned to other catchment or the sea. Grey water footprint volume to dilute/ absorb polluted water.

23 Virtual Water footprint Source:

24 [Hoekstra & Chapagain, 2008]

25 [Hoekstra & Chapagain, 2008]
26 A more accurate view Revised Data Total 17,149 L/kg 18,592 L/kg Green 16,774 17,388 Blue Based on global crop averages from Hoekstra et al 2011
27 Relative blue/green water use Global material averages, Mars fraction usage 100% 90% 80% 70% 60% 50% 40% 30% %GW %BW 20% 10% 0% Tomato Almond Cane Beet Mint Rice Wheat Carrot Corn Oat Dairy Pork Chicken Turkey Duck Barley Peanut Sunflower Lamb Beef Soy Pea Coffee Coconut Palm Cocoa
28 LCA of Water for Beef Life Cycle Assessment Framework Goal & Scope Definition Inventory Analysis Interpretation Direct Applications: * Product Development & Improvement * Strategic planning * Public policy making * Marketing * Other Impact Assessment
29 Unit Process: Heart of the LCA Outputs to nature Inputs from other processes Outputs to other processes Inputs from nature
30 Life Cycle Inventory Analysis Releases to environment Extractions from environment
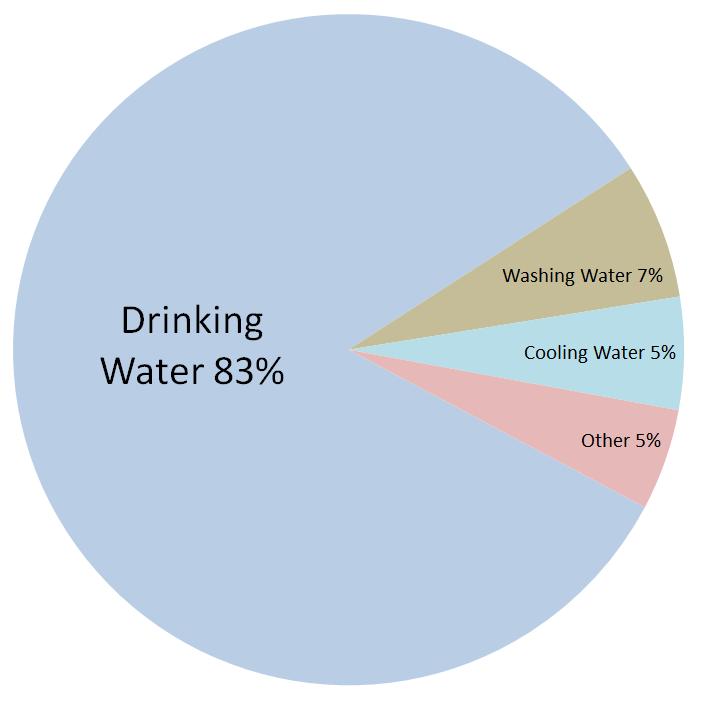
31 Water use impacts are driven by feed production Water impact (L of water in competition) is dominated by feed production Combining spatialized & non-spatialized impacts, the overall water footprint is 140 L water used per kg milk consumed.
32 Water required for dairy feed 350 L consumed (Blue water) / kg DM (region-nation wtd) Alfalfa Hay Alfalfa silage Corn grain Corn silage Crop - other Grass hay Grass silage Soybean meal R1 R2 R3 R4 R5 Water in competition per kg of crop for all crops studied, nation-wide production, split into dairy production regions

33 Pork Benchmark for Water


34 Field to Market: The Alliance for Sustainable Agriculture focuses on defining, measuring and advancing the sustainability of food, fiber and fuel production George Thom

35

36 How We Define Sustainable Agriculture Meeting the needs of the present while improving the ability of future generations to meet their own needs Increasing productivity to meet future food and fiber demands Improving the environment Improving the social and economic well-being of agricultural communities
37 Criteria for Key Performance Indicators of Sustainable Agriculture Key Performance Indicators (KPIs) are things we measure to inform decisions. KPIs should be: 1. Outcomes Based. 2. Science Driven. 3. Technology Neutral. 4. Transparent.
38 ENVIRONMENTAL KEY PERFORMANCE INDICATORS (KPIS) FOR AGRICULTURE Greenhouse Gas Emissions Soil Loss Energy Use Water Use Land Use Water Quality Nutrient Use Efficiency Habitat/Biodiversity Common US Initiatives: Cotton, Corn, Wheat, Rice, Potatoes US Poultry & Egg Federation National Pork Board Dairy Research Institute National Roundtable on Sustainable Aquaculture


39 Production system matters Grazing systems Water footprint: mostly green local Water footprint: green & blue local Mixed systems Water footprint: green & blue partly imported Industrial systems
 to \"water in")
 /")
40 So does geography Water consumed per kg corn From "water consumed" (evaporated / in product / released to other water basin) to "water in competition" The Water Stress Index (WSI) represents the competition for water, as a function of use/availability 40 water consumed (bluewater) / water availability


41 Improve Understanding of Feed Impacts 1. Common methodological approaches addressing key cross-sectoral issues in the application of LCAs to the livestock sector. 2. A set of sectoral specific guidelines for undertaking LCAs of greenhouse gas emissions.

42 Questions? Former Aral Sea, Central Asia