The GLAM crop model. Andy Challinor and Kathryn Nicklin
|
|
|
- Marvin Miller
- 5 years ago
- Views:
Transcription


1 The GLAM crop model Andy Challinor and Kathryn Nicklin
2 Introduction


3 Crop modelling methods Empirical and semi-empirical methods + Low input data requirement + Can be valid over large areas May not be valid as climate, crop or management change Process-based + Simulates nonlinearities and interactions Extensive calibration is often needed skill is highest at plot-level What is the appropriate level of complexity? Near to the yield-determining process on the spatial scale of interest (Sinclair and Seligman, 2000)
4 Combining crop and climate models annual + Country + district field Spatial scale Climate forecast season al monthly daily S e a m l e s s Weather generators Weather forecast Downscaling Meta-models, Empirical models Large-area models Yield Traditional crop models: DSSAT, CERES etc
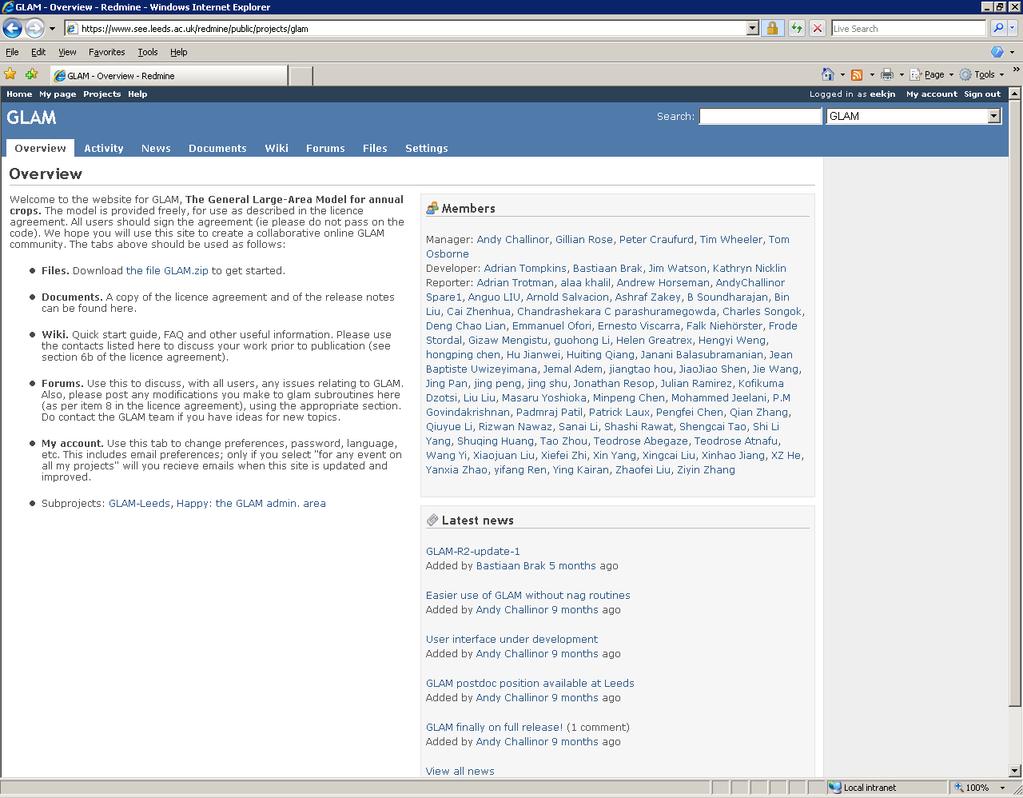
5 General Large Area Model for Annual Crops (GLAM) Challinor et. al. (2004) Aims to combine: the benefits of more empirical approaches (low input data requirements, validity over large spatial scales) with the benefits of the process-based approach (e.g. the potential to capture intra-seasonal variability, and so cope with changing climates) Yield Gap Parameter to account for the impact of differing nutrient levels, pests, diseases, non-optimal management etc.
6 Large-area crop modelling 1. A basis in observed relationships. Correlate weather/climate and crop yield at range of scales (Challinor et al., 2003) Beware of assigning causality (e.g. Bakker et al., 2005) => need process-based modelling 2. Appropriate complexity. processes => interactions => potential for error. (See e.g. Monteith, 1996). Simulate at appropriate level of organisation mechanisms near to the yielddetermining processes should be simulated (Sinclair and Seligman, 2000) 3. High fraction of observable parameters. Parameterisations are then directly testable (e.g. dl/dt, TE) Reduces risk of over-tuning Semi-empirical approaches as well as processes-based. e.g. Potgeiter (2005) related a plant water stress index to yield
7 GLAM (General Large-Area Model for annual crops) Process based crop model Specifically designed for use on large spatial scales - simulates climatic influences on crop growth and development - low input data requirements Typical climate model grid cell GLAM can be run on this spatial scale


8 GLAM Inputs and outputs INPUTS Daily weather data: OUTPUTS Crop yield: Wheat - Rainfall - Solar radiation - Min temperature - Max temperature Soil type CROP MODEL For each day of the growing season, a set of equations is solved. The simulated crop grows and develops. Maize Groundnuts Planting date Sorghum
9 General Large Area Model for Annual Crops (GLAM) d(hi)/dt Pod yield Biomass transpiration efficiency Root system Development Transpiration radiation stage temperature rainfall Leaf canopy RH C YG water stress Soil water Relatively simple => adaptable to other annual crops or climate change adaptation scenario
10
11 General Large Area Model for Annual Crops (GLAM): some parameters Thermal duration: Determines development rate o Predict weather extremes at sensitive stages (e.g. flowering) Transpiration efficiency to calculate biomass o Changes under elevated CO 2 Maximum rate of change of LAI: determines growth of leaves o Check model consistency by looking at Specific Leaf Area Yield gap parameter: time-independent site-specific parameter to account for the impact of differing nutrient levels, pests, diseases, non-optimal management etc. o Process-based: acts on LAI to determine an effective LAI o In practice, YGP can bias correct input weather data o It is not the sole determinant of mean yield, however
12 Model calibration
13 Potential and actual yields Yield potential
14 GLAM Calibration GLAM simulates the impact of weather on crop yields. It does not explicitly simulate the impact of other factors such as nutrient deficiencies, pests, diseases, weeds The yield gap parameter is a time-independent site-specific parameter that accounts for these factors. It also acts to bias correct weather Crop yield 1.00 Yield Gap Parameter =
15 GLAM The Yield Gap Parameter (YGP) You can choose how the yield gap parameter reduces simulated yields. Options include acting on: Crop yield Leaf area index Soil properties Roots Uptake of water Soil Properties Leaf Area Index Potential rate of transpiratio n Rate of transpiratio n Biomass Crop Yield Soil Water Stress Factor Harvest Index
16 GLAM The Yield Gap Parameter (YGP) You can choose how the yield gap parameter reduces simulated yields. Options include acting on: Crop yield Leaf area index Soil properties Roots Uptake of water Soil Properties Leaf Area Index Potential rate of transpiratio n Rate of transpiratio n Biomass YGP = 0.2 YGP = 1.0 Crop Yield Soil Water Stress Factor Harvest Index
17 GLAM The Yield Gap Parameter (YGP) You can choose how the yield gap parameter reduces simulated yields. Options include acting on: Crop yield Leaf area index Soil properties Roots Uptake of water Soil Properties YGP = 1.0 Leaf Area Index Potential rate of transpiratio n Rate of transpiratio n Biomass YGP = 0.2 YGP = 1.0 Crop Yield YGP = 0.2 Soil Water Stress Factor Harvest Index
18


19 GLAM The Yield Gap Parameter (YGP) You can choose how the yield gap parameter reduces simulated yields. Options include acting on: Crop yield Leaf area index Soil properties Roots Uptake of water Soil Properties YGP = 0.2 YGP=1.0 YGP = 1.0 Leaf Area Index Potential rate of transpiratio n Rate of transpiratio n Biomass YGP = 0.2 YGP = 1.0 Crop Yield YGP = 0.2 Soil Water Stress Factor Harvest Index
20 To what extent are mean yields determined by YGP? YGP values differ when calibrated on different input data; Hence it contains an element of bias-correction. However, does this mean that the mean yields are tuned to correct values by varying YGP? Colours show YGP: Black Green Red Symbols show accuracy in simulation of mean yield: Circles: within 5% Squares: within 10% Triangles: within 25% + : within 50% X : within 100%
21 Model performance
22 Model configuration for groundnut in India using observed gridded data Rainfall on 2.5x2.5 o grid (IITM) Radiation 0.5 deg. (CRU) and or IITM regional Tmax, Tmin CRU 0.5 deg. T, e and FAO 0.5 deg. soils data All data monthly interpolated except for rainfall.
23 Optimisation of global parameters for groundnut across India Thin IITM Thick - CRU Optimal values are within literature range (~ Pa) Optimal values are stable over space and input dataset provided C YG is calibrated UP solid GJ dashed AP dotted C YG can correct for (some) data input bias X IITM-calibrated UP CRU run
24 Optimisation II stability over time Optimal values are stable over time provided the full baseline period is used for detrending AP
 Observed values e.g. 0.74 (Azim-Ali, 1998), 1.00 (Hammer et. al.")
25 Model response to rainfall and radiation Yield (kg/ha) Irrigated GLAM RUE = 0.71, 0.99, 1.00 g/mj Rainfed GLAM RUE = 0.83, 0.63, 0.40 g/mj Rainfall (cm) Observed values e.g (Azim-Ali, 1998), 1.00 (Hammer et. al. 1995) g/mj UP, AP, GJ
26 General Large-Area Model for annual crops Results: all-india groundnut yield Challinor, A. J., T. R. Wheeler, J. M. Slingo, P. Q. Craufurd and D. I. F. Grimes (2004). Design and optimisation of a large-area process-based model for annual crops. Agricultural and Forest Meteorology, 124, (1-2)


27 GLAM Model performance GLAM was used to simulate groundnut yields in India. Run on a 2.5 x 2.5 grid Years simulated Observed weather data Groundnut yield (kg/ha) National Yield Statistics GLAM simulation Correlation = 0.76 RMSE = 69 kg/ha Year Challinor et al 2004
28 GLAM Model performance GLAM can capture the effects of sub-seasonal variability on crop yield. Rainfall time series for one of the grid cells in India: 1975 Total rainfall 394 mm Observed yield 1360 kg/ ha Simulated yield 1059 kg/ ha Challinor et al Total rainfall 389 mm Observed yield 901 kg/ha Simulated yield 844 kg/ha
29 Summary of model performance Filled = IITM Open = CRU UP AP GJ Taylor diagram (Taylor, 2001)
30 Case studies for lab class

31 GLAM lab class First download GLAM
32 GLAM lab class Then choose case study: Ghana China For details see (unique username and password needed) And decide whether to use a text edit or the beta version GUI See

33 Ghana Step 1: Decide on the grid cells/regions GLAM will be run for. Depends on: Available input data Scale of relationship between weather and yield Aim of the project Ghana GLAM will be run on 1 x 1 gridcells
34 Ghana Step 2: Collect and organise input data Daily weather data Rainfall, min and max temperature, solar radiation. Ghana - ERA-Interim data (reanalysis data from the ECMWF) - Global Precipitation Climatology Project (GPCP) rainfall

 rainfall Soil data Soil")


35 Ghana Step 3: Collect and organise input data Daily weather data Rainfall, min and max temperature, solar radiation. Ghana ERA-Interim data (reanalysis data from the ECMWF) Global Precipitation Climatology Project (GPCP) rainfall Soil data Soil hydrological properties (can be found from soil texture): R. Evans et al 1996 Saturation limit: maximum amount of water in the soil. Drained upper limit: water held after thorough wetting and drainage Lower limit: any remaining water can not be extracted. Ghana Soil texture information from FAO soil map of the world Data averaged onto model grid

36 Ghana Step 4: Collect and organise input data Planting date information Exact planting date or start of intelligent sowing window Ghana Literature (e.g. Naab et al 2005) Observed yield data Crop yield (kg/ha) = Production (kg) Cultivated area (ha) Ghana District level data from Charles Yorke (Ghana Met Agency) Calculate yield data for model grid cells Remove technology trend Crop yield (kg/ha) Year 1997 Original Detrend ed
37 Ghana Step 5: Check parameter values are appropriate for local cultivars. Step 6: Run GLAM in calibration mode to find the yield gap parameter (YGP) for each grid cell. Step 7: Run GLAM using these YGPs compare simulated yields to observed yields. Yield (kg/ha) Crop yield Yield Gap Parameter = 1.00 Yield Gap Parameter = 0.80 Yield Gap Parameter = 0.05 Observed Yields Year