Nguyen Lam-Dao Thuy Le-Toan Armando Apan Juliane Huth Phung Hoang-Phi. VAST, Vietnam CESBIO, France USQ, Australia DLR, Germany VAST, Vietnam
|
|
|
- Theodora Greer
- 5 years ago
- Views:
Transcription


1 The 33rd Asian Conference on Remote Sensing Pattaya, November 26-30, 2012 RICE MONITORING IN THE MEKONG DELTA, VIETNAM Nguyen Lam-Dao Thuy Le-Toan Armando Apan Juliane Huth Phung Hoang-Phi VAST, Vietnam CESBIO, France USQ, Australia DLR, Germany VAST, Vietnam


2 Contents 1. Introduction 2. Data and method used 3. Results 4. Conclusions 2
3 Introduction Research projects: RICEMAN: Rice & Mangrove monitoring in Southern Vietnam (TerraSAR-X & ENVISAT-ASAR, ) Radar data Rice crop monitoring using new generation synthetic aperture radar (SAR) imagery (ENVISAT-ASAR, ) Utilisation of SAR data for rice crop monitoring (ERS2-SAR, ) 3 Optical data
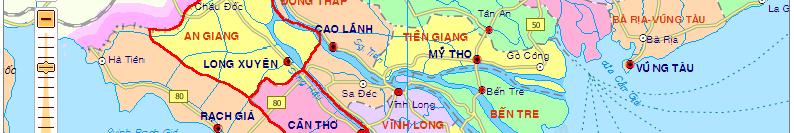
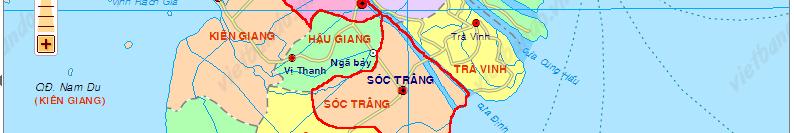

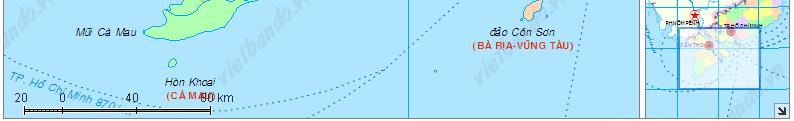
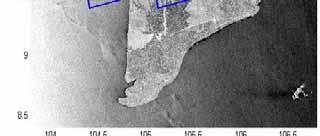
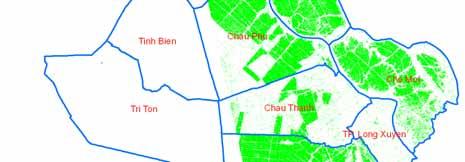
4 Introduction: Mekong Delta and study sites 4 Optical data


; No effects of")
5 Introduction Why Remote Sensing? Satellite remote sensors can provide us synoptic measurements on large areas, near real time and low cost comparing to other traditional techniques. Why Radar RS? Radar data All weather capability (small sensitivity of clouds, light rain); Day and night operation (independence of sun illumination); No effects of atmospheric constituents (multi- temporal analysis); 5 Etc. Optical data

6 Introduction: Spaceborne SARs 6 Satellite Years Agency Frequency - Polarisation Resolution - Swath Special ERS ESA C - VV 25 m Interferometry 100 km (with ERS-2) JERS NASDA L-HH 25 m 100 km Region. mosaic available ERS ESA C - VV 25 m Interferometry 100 km (with ERS-1) RADARSAT CSA C - HH m km Multi-incidence ENVISAT - ASAR ALOS - PALSAR 2002 ESA C - HH/VV/HV m km JAXA L - Polarimetric m km Multi-incidence Multi-incidence TerraSAR-X 2007 DLR X-Polarimetric 1 m Interferometry 1day RADARSAT CSA C - Polarimetric < 10 m Multi-incidence New satellites: COSMO-SkyMed, RISAT, ALOS-2 & Sentinel-1 (2013)
7 Introduction Why Radar RS for Rice? Growing mainly in tropical regions; Rice: staple food; Population growth and Climate change Food security. Operational System for Rice Crop Inventory 7


8 Introduction Why Radar RS for Rice in Mekong Delta? 8 Size of rice field ranging from small (0.5 2 ha) to large; Sowing dates are different from field to field (1-2 weeks); Different rice cropping systems from one area to another; Cultural practices (sowing, transplanting); Seeds.


9 Rice growing stages The sowing-transplanting period; The growing period: 1. Vegetative stage, 2. Reproductive stage, 3. Ripening stage; Fallow. 9


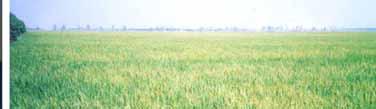
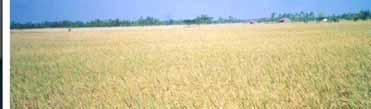
10 10 Pictures of rice growing stages
11 Physical basis of the radar backscatter from rice fields Before sowing: very low radar backscattering; During the vegetative phase: steady increase of the radar response; At the end of the ripening: slight decrease of the o After the harvest: low radar backscattering. 11
12 Previous studies 12 Methods for rice mapping: Visual interpretation; Unsupervised classification; Maximum likelihood classifier; Artificial neural network classifier; Knowledge-based classifier; Temporal change measurement; Objected-oriented classifier; Single-date mapping algorithm; PCA based method. Methods for yield estimation: Agro-meteorological model (AMM); Statistical model.


13 Objectives 24/03/07 17/02/2007 To evaluate the use of SAR data in rice mapping and yield estimation, towards an operational system for rice crop inventory in the Mekong Delta, Vietnam. 13


 Rice cropping")


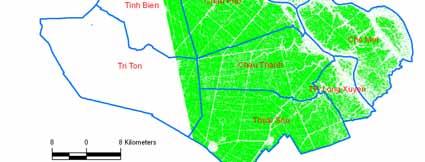
14 Study area: An Giang, Mekong Delta In 2011, An Giang: 3,843,600 ton; MD: 23,186,300 ton; VN: 42,324,900 ton (GSO, Vietnam) Rice cropping system: 1, 2 or 3 crop seasons Affected by flood: Strong Distance to HCMC: 200 km Local support: AGU, CLRRI 14
15 Rice cropping systems Rice cropping system Single rice crop Double rice crop Rice season Traditional rice (rain-fed) Summer Autumn Autumn Winter (rain-fed) Winter Spring Summer Autumn (irrigated) Triple rice crop Winter Spring Summer Autumn - Autumn Winter 15 Main rice-based cropping systems
16 Rice seasons Rice crop Planting Harvesting English name Local name Winter Spring Dong Xuan Nov./Dec. Mar./Apr. Summer Autumn He Thu Apr./May Jul./Aug. Rainy season Thu Dong (Autumn Winter) Jul./Sep. Oct./Dec. Mua (Traditional rice) Jul./Sep. Nov./Jan. 16 Main rice seasons


")
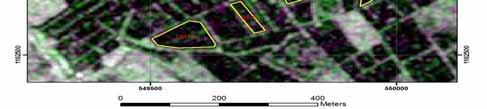
17 Methods Sample rice fields 17 Sample rice fields in Cho Moi (An Giang)


18 18 Ground data collection at Cho Moi district
19 SAR data used TerraSAR-X data: - Band: X - Wavelength: 3.1 cm - Polarisation: HH&VV - Resolution: 3 m (SM) ENVISAT ASAR data: - Band: C - Wavelength: 5.6 cm - Polarisation: HH&VV - Resolution: 30 m (APP) No. Sensor-Mode Date of image No. Sensor- Mode Date of image No. Sensor-Mode Date of image 1 ASAR APP 13-Jan ASAR APP 22-Feb TSX SM 31-Jan-11 2 ASAR APP 17-Feb TSX SM 19-Aug TSX SM 11-Feb-11 3 ASAR APP 24-Mar TSX SM 30-Aug TSX SM 22-Feb-11 4 ASAR APP 28-Apr TSX SM 10-Sep TSX SM 16-Mar-11 5 ASAR APP 2-Jun TSX SM 24-Oct TSX SM 27-Mar-11 6 ASAR APP 07-Jul TSX SM 04-Nov TSX SM 07-Apr-11 7 ASAR APP 15-Sep TSX SM 15-Nov TSX SM 29-Apr-11 8 ASAR APP 20-Oct TSX SM 26-Nov TSX SM 10-May ASAR APP 24-Nov TSX SM 18-Dec TSX SM 01-Jun ASAR APP 29-Dec TSX SM 29-Dec-10
20 Results Rice backscatter analysis HH/VV (db) Dec-06 Feb-07 Apr-07 Jun-07 Aug-07 Oct-07 Dec-07 HH/V VV (db) Aug-10 Oct-10 Dec-10 Feb-11 Apr-11 Jun Temporal variation of average polarization ratio HH/VV of ASAR APP (left) and TSX SM (right) for sample rice fields in Cho Moi
21 Results Rice backscatter analysis of TSX SM ( ) tán xạ ngược (db) Hệ số t TĐ2010_CM ĐX2011_CM ĐX2011_ TL tán xạ ngược (db) Hệ số t TĐ2010_CM ĐX2011_CM ĐX2011_TL _ Số ngày sau sạ/cấy Số ngày sau sạ/cấy HH/VV (db) TĐ2010_CM ĐX2011_CM ĐX2011_TL Số ố ngày sau sạ/cấyấ 21 O charts of HH (UL), VV (UR) & HH/VV (LL) data
22 Results Rice backscatter analysis ( ) 12.0 Hệ số tán xạ ng gược (db) Cây hàng năm 1 Cây hàng năm 2 Nông thôn 1 Nông thôn 2 Lúa 1 Lúa 2 Sông 1 Sông 2 Đô thị 1 Đôthị /12/ /01/ /02/ /03/2011 Thờigian 22 HH&VV ratio of land use / land cover classes
23 Rice mapping ( ) Using single-date TSX SM image taken at the middle of crop season (i.e. Oct for Autumn Winter crop in Cho Moi) HH/VVratio>5dB Ratio value (db) Rice pixels in samples (%)
24 Results Rice backscatter analysis of ASAR APP (2007) Effect of water / no water Backscattering coefficient (db) Days after sowing Backscatterin g coefficient (db) Days after sowing WS SA AW WS0 SA0 AW0 WS SA AW WS0 SA0 AW HH H/VV (db) Days after sowing WS SA AW WS0 SA0 AW0 o charts of HH (UL), VV (UR) & HH/VV (LL) data
25 Rice mapping (2007) Using single-date ASAR APP image taken at the middle of crop season (i.e. Feb for Winter Spring crop in An Giang) -4.0 HH/VVratio>3dB d B Sigma 0 of HH/VV Data of Land Use Classes /01/07 17/02/07 24/03/07 Date Urban1 River1 Forest2 Rural1 Crop LDB5
 11/02/2011 (c) 22/02/2011 26")
 31/01/2011, 11/02/2011 and")
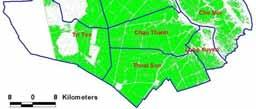
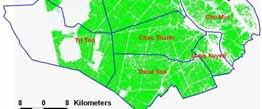
26 Rice mapping (TerraSAR-X, 2011) (a) 31/01/2011 (b) 11/02/2011 (c) 22/02/ (d) 31/01/2011 and 11/02/2011 (e) 31/01/2011 and 22/02/2011 (f) 31/01/2011, 11/02/2011 and 22/02/2011
27 Rice mapping (TerraSAR-X, 2011) Date of TSX SM image Estimated area (ha) Statistical data (ha) 31/01/ /02/ /02/ /01/2011 and 11/02/ /01/2011 and 22/02/ /01/2011, 11/02/2011 and 22/02/ Percentage difference (%) 27
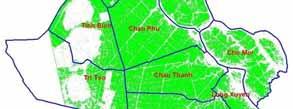
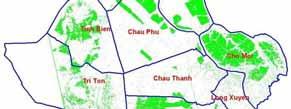
 Statistical data (ha) Percentage difference (%) 13/01/2007 141388 193242-26.")
13/01/2007 and 17/02/2007 (e)13/01/2007, 17/02/2007 and 24/03/2007 13/01/2007, 17/02/2007")
28 Rice mapping (ASAR, 2007) (a) 13/01/2007 (b) 17/02/2007 (c) 24/03/2007 Date of ASAR APP image Estimated area (ha) Statistical data (ha) Percentage difference (%) 13/01/ /02/ /01/2007 and 17/02/ (d)13/01/2007 and 17/02/2007 (e)13/01/2007, 17/02/2007 and 24/03/ /01/2007, 17/02/2007 and 24/03/


29 Rice maps in An Giang from ASAR APP ( ) WS 2007 crop WS 2008 crop WS 2011 crop 29 SA 2007 crop AW 2007 crop AW 2010 crop


")
30 30 Rice cropping system map (ASAR, 2007)
 31")

")
31 Rice map from radar and optical data (2010) 31 AW2010, An Giang province (ASAR APP, 09/10/2010) AW2010, An Giang province (SPOT 4, 06/10/2010)
 Rice Statistical data (ha)")
 Xuan Thang 760 877-13.")

32 Commune Name Rice from TerraSAR-X (ha) Rice Statistical data (ha) Percentage error (%) Rice mapping (2011) Xuan Thang Tan Thanh Winter Spring 2011 crop in Thoi Lai (using 29/12/2010 & 31/01/2011 TSX SM)
33 33 Rice yield estimation
34 Statistical model based method TSX, ASAR Data Ground-truth data σ o of sampling fields In situ rice yield Regression analysis * Regression equation Estimated rice yield distribution maps Rice/None-rice maps Estimated rice production Statistical model (multiple linear regression analysis)
35 TSX SM data used (2010) Image Date of image Number of days No. acquisition after sowing 1 30/08/ /09/ /10/ /11/ /11/ List of TSX SM HH&VV image acquisition date and days after sowing in Autumn-Winter 2010 crop in Cho Moi
36 Correlation between HH/VV ratios and sample rice yield Image Case combination r 2 1 1, 2, 3, 4, , 3, 4, , 2, 3, , 3, 4, , 2, 3, , 2, 4, , 3, , 3, Case Image combination r , 2, , 3, , 3, , 2, , 4, , 4, , 4, , 2, AW 2010 Crop in Cho Moi

 SM 10/09/2010 (19)")
 Y Ra = 0.0008*Ra 1-0.")

,")


37 AW 2010 Crop, Case 1 A distribution map of estimated rice yield in AW 2010 crop at Cho Moi district using five- date polarisation ratios: SM 30/08/2010 (8) SM 10/09/2010 (19) SM 24/10/2010 (63) SM 04/11/2010 (74) SM 15/11/2010 (85) Y Ra = *Ra *Ra *Ra *Ra *Ra r 2 = 0.795, se y = 018t 0.18 ton/ha Where: Y Ra : rice yield (kg/m2), Ra 1 : polarisation ratio of first date image, Ra 2 : polarisation ratio of second date image, Ra 3 : polarisation ratio of third date image, Ra 4 : polarisation ratio of four date image, Ra 5 : polarisation ratio of five date image, r 2 : the coefficient of determination, se y : the standard error for the y estimate. 37


38 AW 2010 Crop, Case 7 Y Ra = *Ra *Ra *Ra r 2 = 0.781, se y = 0.16 ton/ha where Y Ra : rice yield (kg/m2), Ra 1 : polarisation ratio of first date image, Ra 2 : polarisation ratio of second date image, Ra 3 : polarisation ratio of third date image, r 2 : the coefficient of determination, se y : the standard error for the y estimate. 38 A distribution map of estimated rice yield in AW 2010 crop at Cho Moi district using there-date polarisation ratios: SM 10/09/2010 (19) SM 24/10/2010 (63) SM 15/11/2010 (85)
39 Percentage error by commune derived from two cases Commune name Estimated Agency Percentage production data Error (Ton) (Ton) (%) Commune name Estimated Agency Percentage production data error (Ton) (Ton) (%) Long Kien My Luong town Long Giang My An Kien Thanh Long Dien B Tan My Long Dien A Cho Moi town Total Case 1 (five-date data) Long Kien My Luong town Long Giang My An Kien Thanh Long Dien B Tan My Long Dien A Cho Moi town Total Case 7 (three-date data)
40 Rice yield estimation from ASAR APP (2007) Multiple linear regression analysis were performed using LINEST function: Rice crop r 2 HH VV HH/VV WS SA
41 Rice yield estimation (2007) The regression equations between in situ rice yield and polarisation ratios of sampling fields at Cho Moi district in WS & SA 2007 crop using LINEST function: WS Scop crop: Y Ra = Ra Ra Ra r 2 = 0.675, se y = 0.38 ton/ha SA crop: Y Ra = Ra Ra Ra r 2 = 0.833, se y = 011t 0.11 ton/ha Y Ra : rice yield (kg/m 2 ), Ra 1 : polarisation ratio of first date image, Ra 2 : polarisation ratio of second date image, Ra 3 : polarisation ratio of third date image, r 2 : the coefficient of determination, se y : the standard error for the y estimate.
 Rice crop")

 WS 2007 131,595")

42 Rice yield map in Cho Moi (2007) Rice crop Statistical data (Ton) Estimated Production (Ton) Percentage error (%) WS , , SA ,256 81, Summer Autumn 2007 rice crop
43 THE USE OF SAR DATA FOR RICE CROP MONITORING A CASE STUDY OF MEKONG RIVER DELTA, VIETNAM Agrometeorological model based method Triple Crop Rice The approach consists in coupling ERS-SAR data and the ORYZA rice production model in order to simulate plant growth and thus the final yield; the selected rice fields were represented the various rice cropping systems; rice field located in Ke Sach district was represented for triple crop rice fields. Its estimated yield of HT crop in 1997 was 4,432 kg/ha. The statistical average yield of HT crop in 1998 was 4,802 kg/ha for Ke Sach district.
44 THE USE OF SAR DATA FOR RICE CROP MONITORING A CASE STUDY OF MEKONG RIVER DELTA, VIETNAM Agrometeorological model based method Double Crop Rice selected fields located in My Xuyen district to predict the rice yield of M crop. Their estimated yield of 5,460 kg/ha for both fields. According to the statistical data in 1995 and 1998, the average rice yields of M crop in My Xuyen district were 3,912 kg/ha and 3,372 kg/ha respectively; The rice yields of fields named P4M1_1 in Soc Trang town and P4M1_2 in Ke Sach district were estimated for TD crop of double crop rice (HT-M). Their predicted yields were 4,886 and 4,562 kg/ha respectively. The statistical average rice yields were 4,147 kg/ha (1995), 4,105 kg/ha (1998) in Soc Trang town and 3,987 kg/ha (1995), 3,634 kg/ha (1998) in Ke Sach district.
45 THE USE OF SAR DATA FOR RICE CROP MONITORING A CASE STUDY OF MEKONG RIVER DELTA, VIETNAM Agrometeorological model based method Single Crop Rice The yield of long-duration rice was predicted from the fields P5M1_1 and P5M1_2 situated in Vinh Chau and Thanh Tri, respectively. Their productivity was 4,237 kg/ha for P5M1_1 and 4,274 kg/ha for P5M1_2. While the statistical data of average yields in Vinh Chau and Thanh Tri were 3,328 (1995), 1,952 kg/ha (1998) and 2,938 (1995), 2,948 kg/ha (1998) respectively; It can be noted that the provincial average rice yields in the year 1998 were 4,521 kg/ha (DX crop), 4,348 kg/ha (HT crop) and 2,873 kg/ha (M crop).
46 Conclusions 46 The radar backscattering behaviour of rice is much different from that of the traditional rice plant; The temporal changes of radar backscattering of HH and VV are different during rice growing stages; HH/VV ratio of the single-date Envisat-ASAR APP and TerraSAR-X SM image acquired in the middle period of the crop season is a good rice classifier; The results using ASAR APP and TSX SM data acquired at a single date have provided a high accuracy of planted rice areas, and three acquisition dates are sufficient to mapping cropping systems during a year (triple crops); The study also pointed out that t at tleast tthree-date t SAR data (TerraSAR-X XSM, Envisat-ASAR APP) can be used to estimate the rice yield and finally rice production by using statistical model (multi linear regression analysis). Result of predicted rice yield of the SA1997 crop based on agro-meteorological model in the study site of Soc Trang was reasonable. Butitisnecessaryto is to have ground data for accuracy assessment of estimated rice yields.
47 Further works Using various SAR and optical RS datasets, i.e. PALSAR-2, VNREDSat-1 for rice mapping and yield estimation in the Mekong Delta, Vietnam; AsiaRiCE. 47
48 Acknowledgement The paper presents results of research projects which were funded by: The European Space Agency (ESA); The Ministry of Education and Training (MOET, Vietnam); The Ministry of Science and Technology (MOST, Vietnam) and the Federal Ministry of Education and Research (BMBF, Germany) RICEMAN project. The ERS2-SAR and ENVISAT/ASAR data used in these studies were provided by ESA; and TerraSAR-X data was supplied by DLR. 48


49 49