Haney Test and PLFA. Ray Ward Ward Laboratories, Inc Kearney, NE Guiding Producers Today to Feed the World Tomorrow
|
|
|
- Roger Nash
- 5 years ago
- Views:
Transcription
1 Haney Test and PLFA Ray Ward Ward Laboratories, Inc Kearney, NE Guiding Producers Today to Feed the World Tomorrow


2 Soil Testing for Soil Health Rick Haney PhD, USDA ARS, Temple, TX


3 Nature s Way Grows a skin for living systems Cycles nutrients Diverse, no monoculture Seeks balance Integrated Has R & D experience Builds plant root networks


4 How we do it Strip off the soil s skin Destroy organic matter Increase erosion Increase inputs Waste water Disrupt root network

5 This is your great great great greatgreat great great great grandfather s technology

6 Why are we still using it???


7 Our Ancestors didn t have these:

8 What if they would have? How different would farming be today?


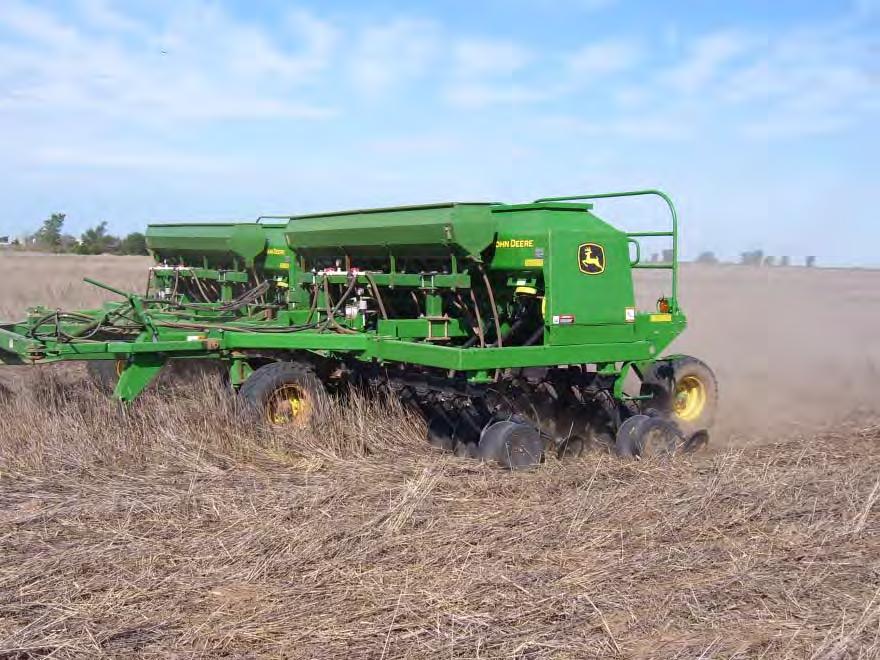
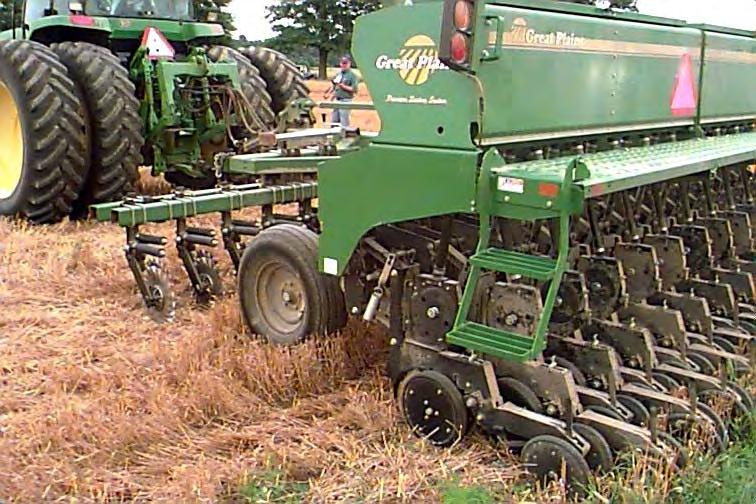
9 What can we do? Plant Increase Organic Matter Try Increase Water Conservation Increase Nutrient Cycling No Till Cover Crops

 not")
10 Conserve soil moisture with transpiration (growing plant) not evaporation (bare soil)


11 We can GROW soil fertility with Cover Crops


12 We can GROW microbial and organic chemical diversity with plant roots

13 Traditional Soil Testing Methods Soil N, P, K Soil ph Recommendations % Organic matter Where s the soil biology?
14 We can Test Soil in Nature s image We can change our thinking We can include soil biology Common soil testing methods are outdated and too focused on highly buffered chemical analysis Current methods do not reflect the complex elegance of the natural system which is driven by organic carbon in presence of water
15 Soil Health Tool Measure soil health by asking our soil the right questions: What is your condition? Are you in balance? What can we do to help?


16 We can Unlock the Secrets in the Soil 2,000,000 lbs soil in 0 6 inches 40,000 lbs Soil Organic C 4,000 lbs Organic N 2,000 lbs Organic P 1,000 lbs Microbes


17 New Soil Testing Methods Soil N, P, K Soil Organic N and P Microbial Activity Water Extractable C C:N balance


18 Microbial Activity Soil bacteria and fungi 1,000,000 10,000,000 per gram of soil

19 Soil Biology is a Complex Integrated Living System Organic carbon in water drives the system Soil microbes take in O 2 and release CO 2 Soil microorganisms have been in R&D for millions of years.


20 Microbial Activity A Living Body

21 Research History 1994

22 Soil Microbial Activity (respiration)
23 New Soil Testing Methods Soil N, P, K Soil Organic N and P Microbial Activity Water Extractable C C:N balance


24 Soil Organic Matter is the House microbes live in, Water Extractable Organic Carbon is the Food they eat. House 2% SOM, 12,000 ppm C Food ppm C from water extract = microbial food


25 5.96 % Soil Microbial Activity 6.4 % 4.6 % 3.0 % 1.0 % Maine Wyoming Alfalfa Wyoming Native Idaho Texas
26 New Soil Testing Methods Soil N, P, K Soil Organic N and P Microbial Activity Water Extractable C C:N balance
27 We have been missing half the plant available N Soil Water Extract 4147 soil samples 2M KCl 1965 Bremer Nitrogen lbs/acre lbs N 37 lbs N NH4+NO3 Organic N If plants could not take up organic compounds herbicides would not work Liz Haney 0
28 New Soil Testing Methods Soil N, P, K Soil Organic N and P Microbial Activity Water Extractable C C:N balance


29 Balance High C:N >20 :1 calculates no N and P mineralization As C:N is lowered N and P mineralization increases but is dependent on soil microbial activity Organic N and P release Organic C:N
30 New Soil Testing Methods Soil N, P, K Soil Organic N and P Microbial Activity Soil Health Calculation Water Extractable C C:N balance


31 Overall health of your soil system. Combines several independent measurements of your soil s biological and chemical properties. Varies from 1 to over 50. Soil Health Calculation Track the effects of your management practices over the years. Used to calculate cover crop input
32 Soil Health Score Calculation: Solvita CO2 divided by water extractable C:N + Organic C divided by Organic N divided by divided by / /10 = = 5.13
33 Soil Health Score Calculation: Solvita CO2 divided by water extractable C:N + Organic C divided by Organic N divided by divided by / /10 = = 12.14


34 Soil Test Integration Extractable Organic C Solvita 1 day CO 2 % MAC Organic N:P Soil Health Calculation > 7 Extractable Organic N Organic C:N Inorganic N, P

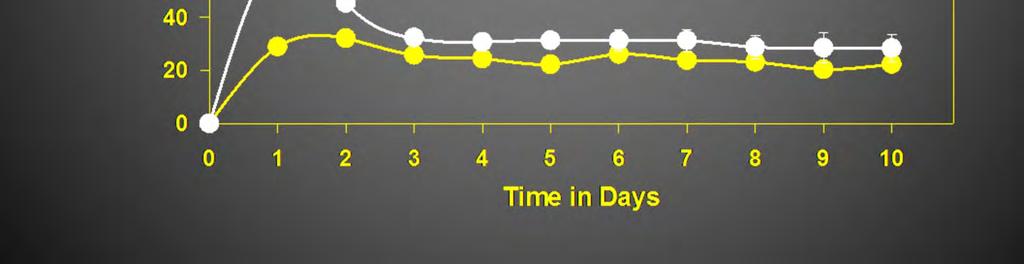
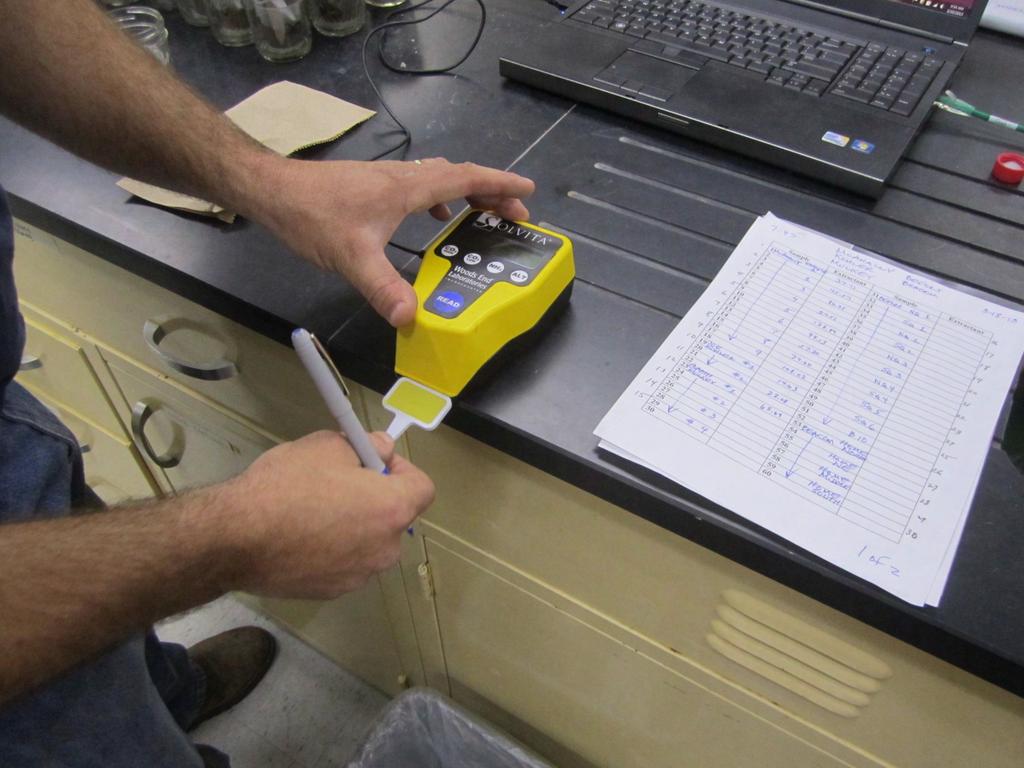
35 Solvita 24 hr CO2 C Test

36 Solvita paddle
37


38 Soil Extraction H3A and Water What does the plant root really see? WATER and a complex mixture of plant root exudates along with microbial derived enzymes and nutrients The below ground root system flows with elegance and complexity We extract soil with highly disruptive acidic or alkali solutions and call it plant available
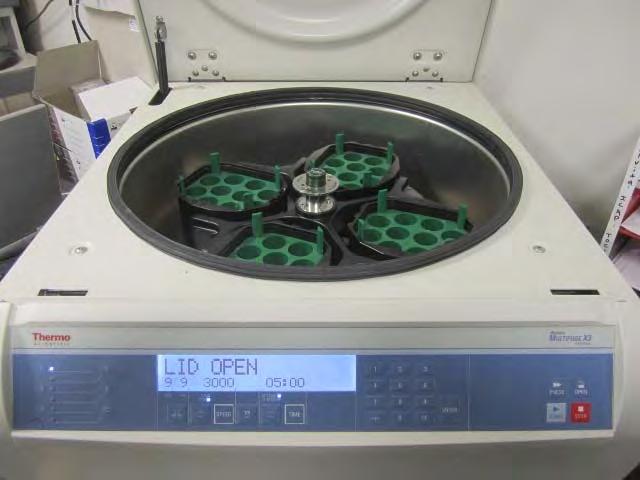
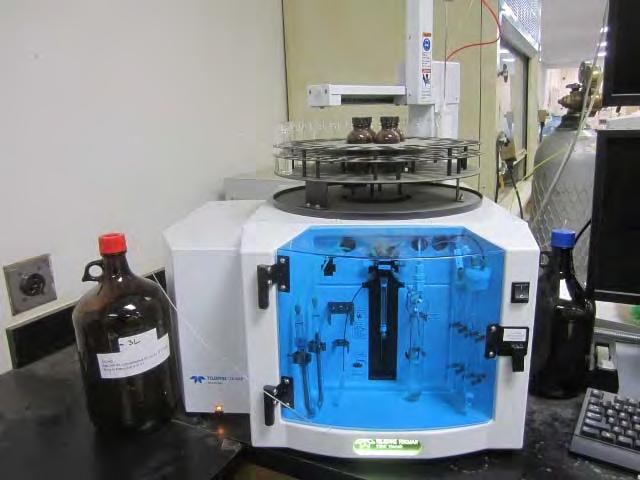
39 Haney Water Soluble Test Just extract with DI water. 4 grams of soil and 40 milliliters of water Shake 10 minutes Centrifuge for 5 minutes Filter Analyze for nitrate, ammonium, organic carbon, and total nitrogen
40 H3A Test A soil extractant that mimics organic acids produced by living plant roots to temporarily change soil ph to increase nutrient availability. Organic acid is excellent food for microbes and the soil ph soon returns to normal ph. Malic acid 1.2 g/2l Oxalic acid 0.6 g/2l Citric acid 1.0 g/2l Lithium citrate 2.6 g/2l (Buffer solution)
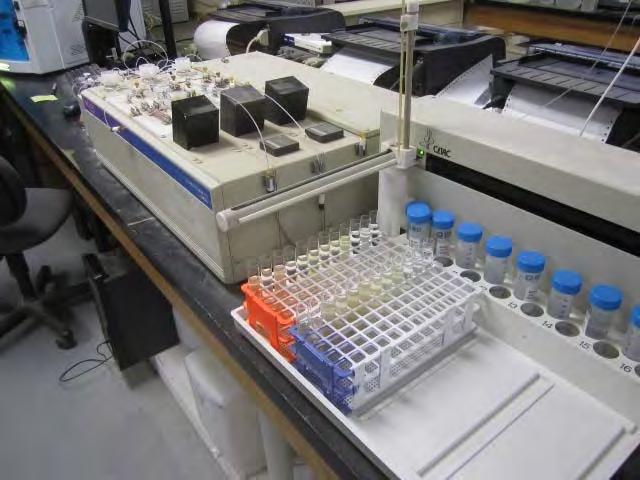
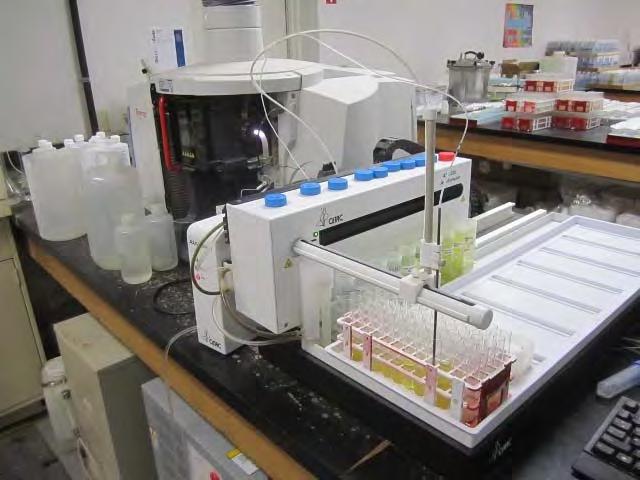
41 Sample Analysis 4 grams each 40 grams
42
43
44
45
46

47 Soil Health Tool Results Excel file via Plant available NPK and fertilizer calculator Soil Health Nitrogen Phosphate Explanation sheet pdf

48 Nitrogen: from both Inorganic and Organic N pools Phosphate: from both Inorganic and Organic P pools. Converted to P2O5 Potassium converted to K2O Tab 1 NPK Nutrient value per acre: Current fertilizer prices multiplied by the nutrients present in your soil.

49 Tab 2 Soil Health

50 Tab 3 Nitrogen

51 Tab 4 Phosphate
52 Mehlich P 3 FIA vs Haney P ICAP Mehlich P Haney P
53 Potassium Comparison NH4AC K Haney K
54 Potassium NH4Ac test = Exchangeable K H3A test = Plant acid extract Difference = More cations are replaced with NH4Ac than with plant acid extract
55 Sulfur Comparison Ca P S Haney S
56 Zinc Comparison DTPA Zn Haney Zn
57
58 PLFA, Muir silt loam Property May (wht) Nov (CC) Microbial Biomass Diversity Index Bacteria Gram Gram Fungi Mycorrhizal Protozoa
59 Ratings for Muir silt loam Property May (wht) Nov (CC) Microbial biomass Aver Sl below aver Diversity index Sl above Excellent Fungi:Bacteria Sl below Very good Predator:Prey Very poor Excellent Gram+:Gram Gram+ Balanced
60 PLFA, Muir silt loam Property May (wht) Nov (CC) Fungi:Bacteria Ratio Predator:Prey Ratio All Prey Gram+:Gram Ratio
61 PLFA, NH3 vs No NH3 Property No NH3 NH3 Microbial Biomass Diversity Index Bacteria Gram Gram Fungi Mycorrhizal Protozoa
62 PLFA, No NH3 vs NH3 Property No NH3 NH3 Fungi:Bacteria Ratio Predator:Prey Ratio All Prey All Prey Gram+:Gram Ratio
63 Fungi:Bacteria Ratio *A low relative number indicates a community dominated by bacteria. While not uncommon, this could be caused by lower organic inputs from plant residues and cellulose or excess nitrogen leading to a lower C:N ratio that favors bacterial growth. This could also be the result of relatively drier conditions, higher ph values, or increased land disturbance through tillage, grazing, or compaction.
64 Fungi:Bacteria Ratio *A ratio of 0.15 to 0.20 indicates a more balanced fungal and bacterial community. This can indicate a relatively neutral soil ph, adequate moisture, and a steady supply of carbon and nitrogen for both functional groups. A balanced community may also indicate a mature system that is adapted to current management schemes and environmental conditions.
65 Fungi:Bacteria Ratio A value above 0.30 indicates a community dominated mostly by fungi. This is likely the result through a combination of no till, relatively high soil moisture, high carbon inputs, and a relatively low to neutral soil ph.
66 Predator:Prey Ratio This ratio is also expressed as protozoa to bacteria. Protozoa feed on bacteria which helps release nutrients, especially nitrogen. A higher ratio indicates an active community where base level nutrients are sufficient to support higher trophic levels or predators. However, this ratio will always be a relatively low number because the prey will greatly outnumber the predators.
67 How to Sample Try to collect all of your samples for comparison on the same day. This reduces changes that may take place if moisture or temperature fluctuates between sampling times. Use a standard core sampler but DO NOT use any form of lubricants.
68 How to Sample Take 10 cores 0-6 inches deep next to the plants or near the roots. Combine and mix the cores in a bucket. Place the composite sample into a plastic Ziploc bag or a paper soil sample bag, DO NOT use cloth bags.
69 How to Sample Add any sample identification information you need to the sample bag and place in a cooler. Mark each sample BIOTESTING to ensure proper handling on our end. We would like samples to remain near original soil temperature, if left unfrozen. Ice packs can be used if sampling during hot weather.

70 Diverse Cover Crop

71 Nutrient Crop Mining CORN Nutrient lb/bu 200 bu/a Nitrogen, N Phosphorus, P2O Potassium, K2O Sulfur, S Zinc, Zn

72 Nutrient Content of Corn Residue Nutrient lbs per ton Nitrogen, N 18 Phosphorus, P2O5 4 Potassium, K2O 30 Sulfur, S 3

73 Crop Nutrient Removal, lbs/bu SOYBEAN Nutrient lb/bu 60 bu/a Nitrogen, N Phosphorus, P2O Potassium, K2O Sulfur, S Zinc, Zn

74 Nutrient Content of Soybean Stubble Nutrient lbs per ton Nitrogen, N 15 Phosphorus, P2O5 2.4 Potassium, K2O 12 Sulfur, S 5

75 Nutrient Crop Removal, lbs/bu WHEAT Nutrient lb/bu 60 bu/a Nitrogen, N Phosphorus, P2O Potassium, K2O Sulfur, S Zinc, Zn

76 Nutrient Content of Wheat Straw Nutrient lbs per ton Nitrogen, N 12 Phosphorus, P2O5 2.3 Potassium, K2O 29 Sulfur, S 4