Remote sensing applications in natural resources mapping and management An Indian Context
|
|
|
- Samuel Dennis
- 5 years ago
- Views:
Transcription


1 Remote sensing applications in natural resources mapping and management An Indian Context International Workshop on Operational Mapping/Monitoring of Agricultural Crops in South/Southeast Asian Countries Research Needs and Priorities, May 2 4, 2017, New Delhi S.K.Choudhari and G.P. Obi Reddy Natural Resource Management Division, ICAR, New Delhi ICAR-National Bureau of Soil Survey & Land Use Planning, Nagpur
2 BACKGROUND By 2025 India s population is expected to reach 1.45 billion (UN, 2006). It is necessary that food production in India must increase by 5 mt annually to ensure food and nutritional security (Kanwar, 2000). Globally, about 1900 million hectares of land is affected by land degradation (UNEP, 1999) and about 2.6 billion people in more than 100 countries are affected due to land degradation (Adams and Eswaran, 2000). Hence, sustainable management of land resources assume a greater significance in view of climate change, droughts, floods to ensure livelihoods and food security. Land resource management involves inventory, characterization, analysis and generation of different types of spatial data for appropriate site specific interventions to manage land resources on sustained basis. Applications of RS and GIS in management of land resources are increasing rapidly due to great strides made in space-borne remote sensing satellites in terms of spatial, temporal, spectral and radiometric resolutions
3 An overview of remote sensing applications in natural resources mapping and management Digital terrain analysis for landform mapping Land resource inventory and mapping Harmonization of wastelands and degraded lands Mapping extent and severity of salt affected soils Mapping and assessment of soil erosion Development of soil reflectance libraries Monitoring and management of natural resources
4 RS Data in Natural Resources Mapping


5 Digital terrain analysis using SRTM 90m DEM


6 RS Applications in Soil Resource Mapping at 1:250,000 Scale Landsat TM used in physiography mapping at national level
")


7 Temporal (FCC) IRS-1D LISS-III Nagpur Area


8 Remote sensing applications at different scale of soil mapping Soil units in different scales of mapping at Nagpur


9 Landsat ETM data used in in Soil Resource Mapping at 1:50,000 Scale


10 IRS-P6 LISS-III data in Soil resource mapping at1:50,000 scale


-")
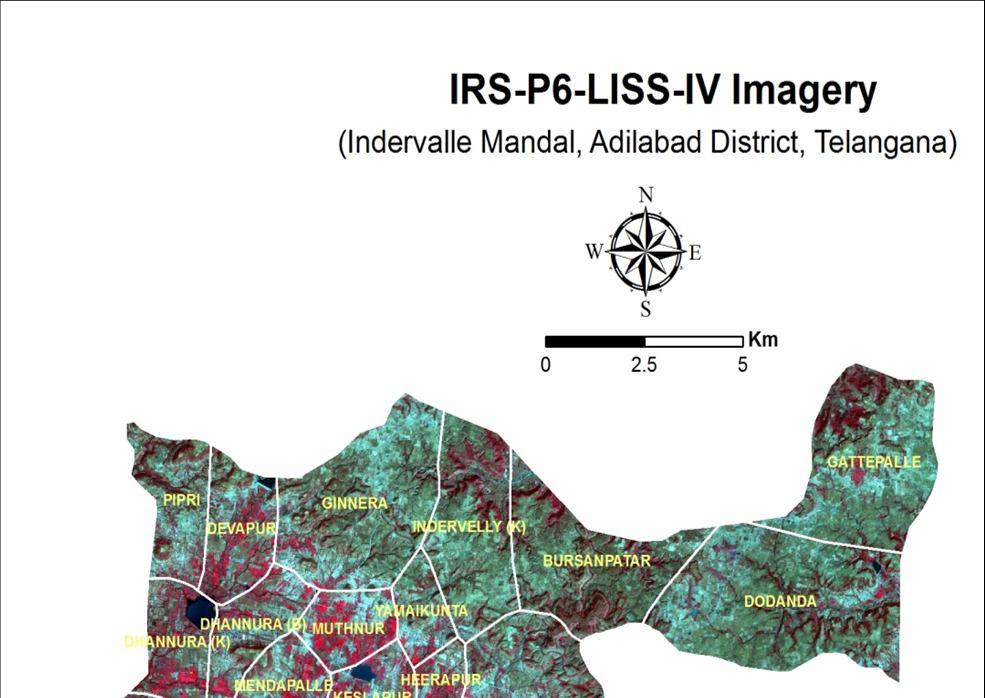
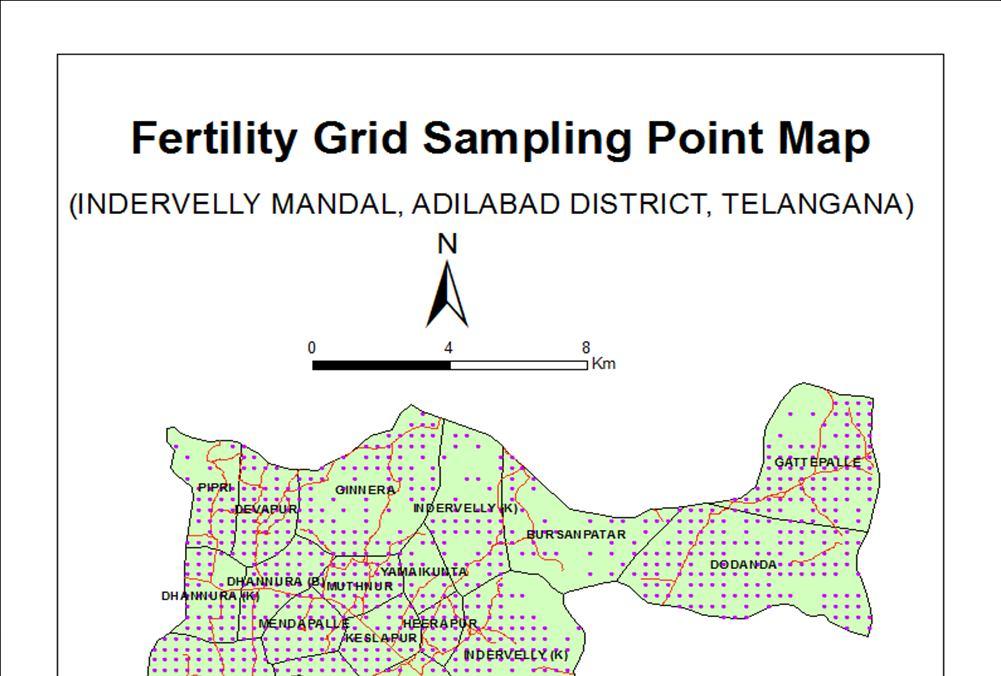
11 IRS-P6 LISS-IV data IN Detailed soil mapping (1:12,500 scale)- Village level


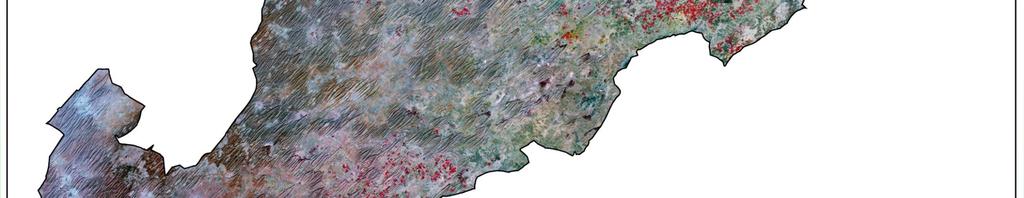
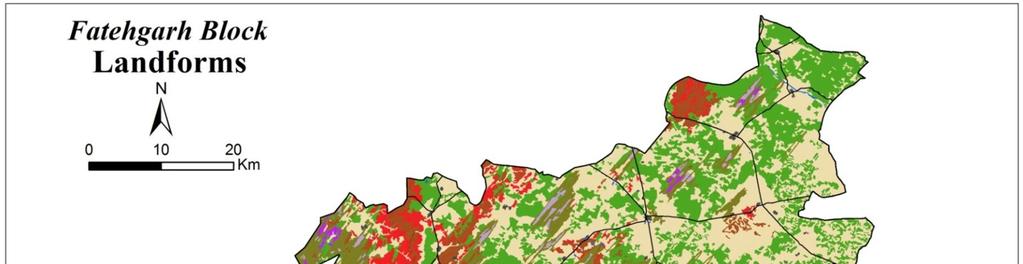
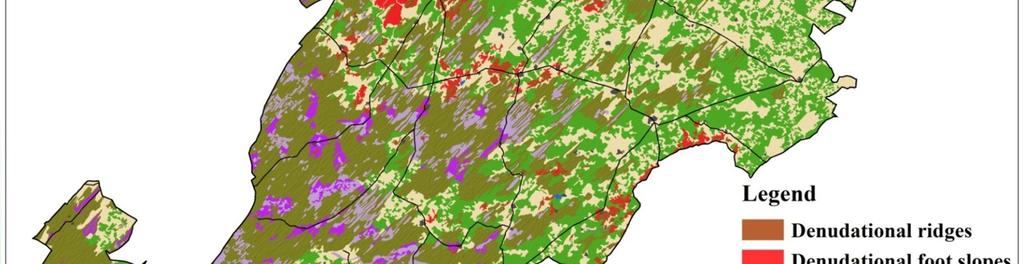
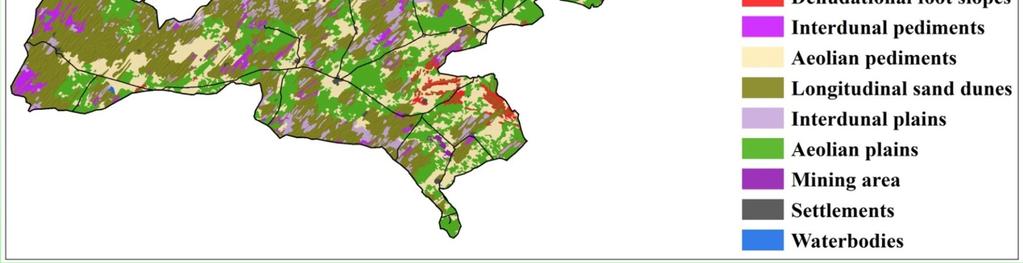
12 IRS-P6 LISS-IV data in landforms mapping at 1:10,000 scale


13 IRS-P6 LISS-IV data in landforms mapping at 1:10,000 scale

14
15 Sentinel-II data in landforms mapping at 1:10,000 scale


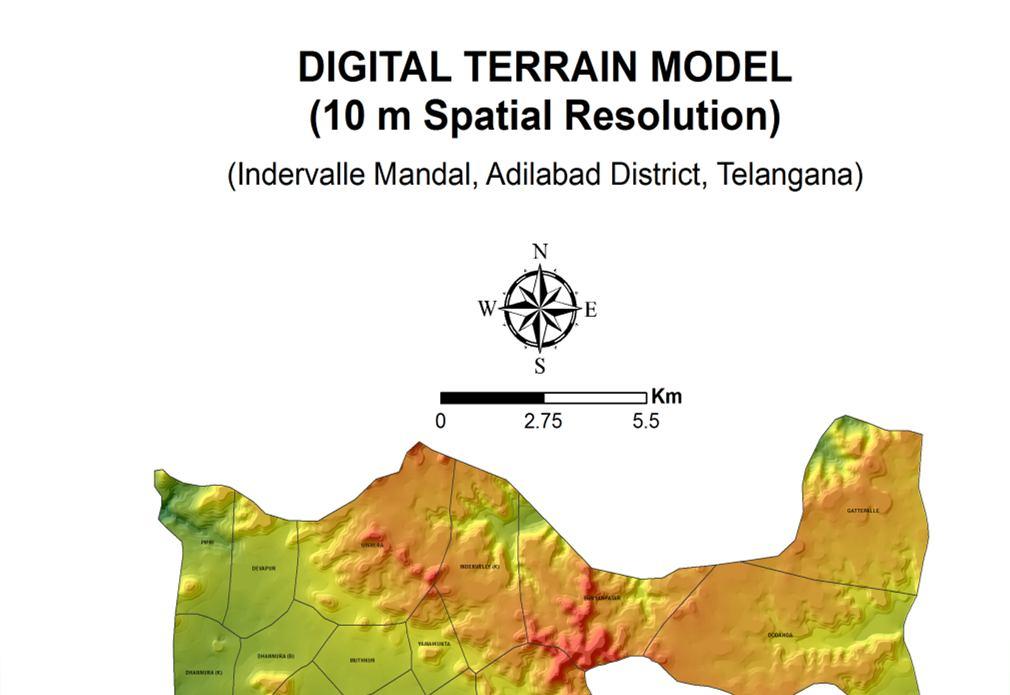

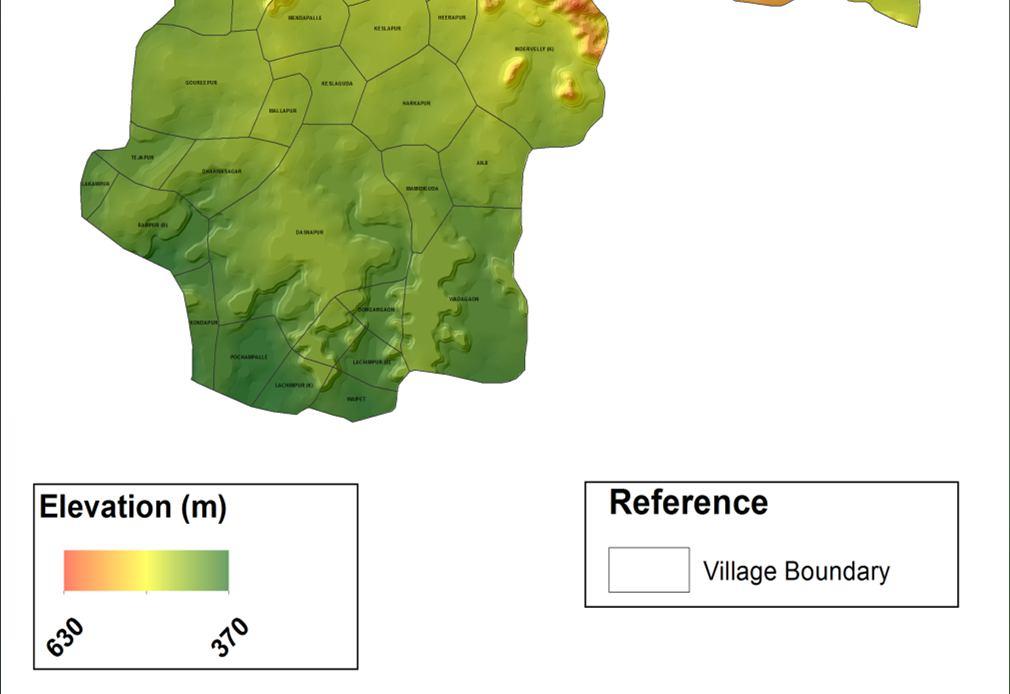
16 IRS-P6 LISS-IV and Cartosat-I DEM data in landforms mapping at 1:10,000 scale


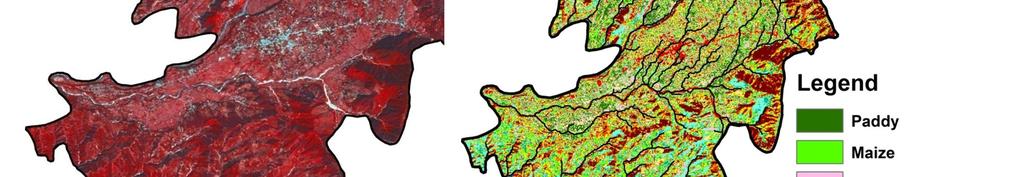
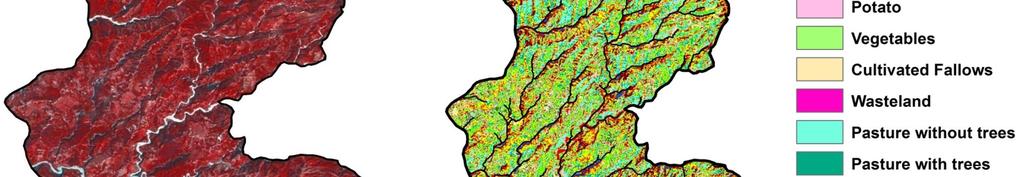
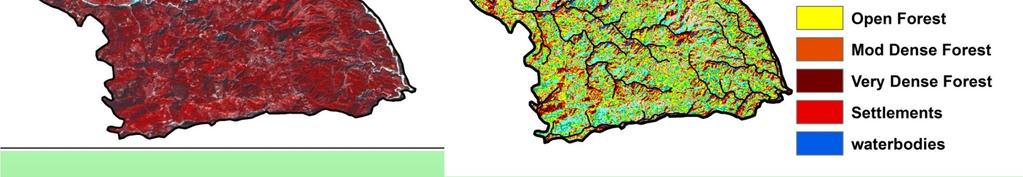
17 IRS-P6 LISS-IV data in LULC mapping at 1:10,000 scale


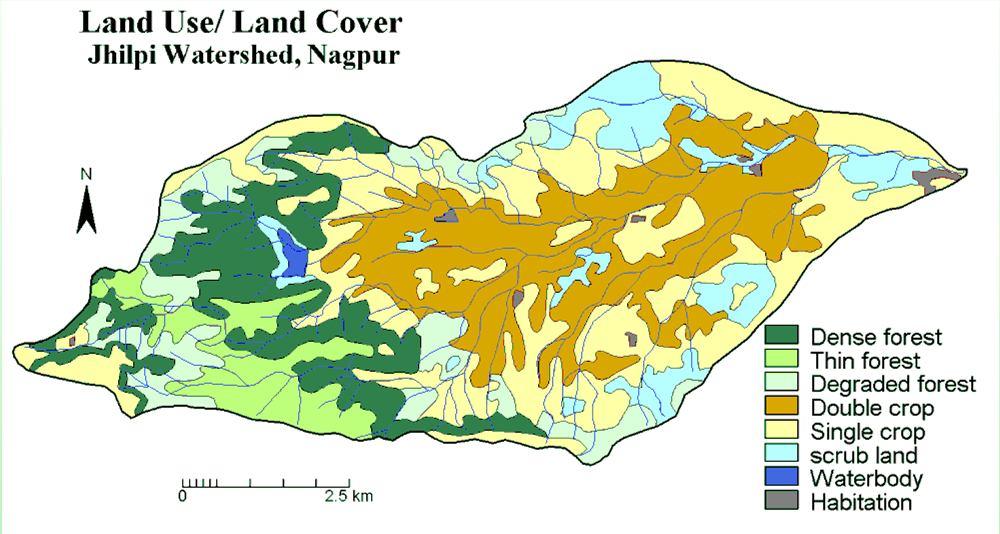
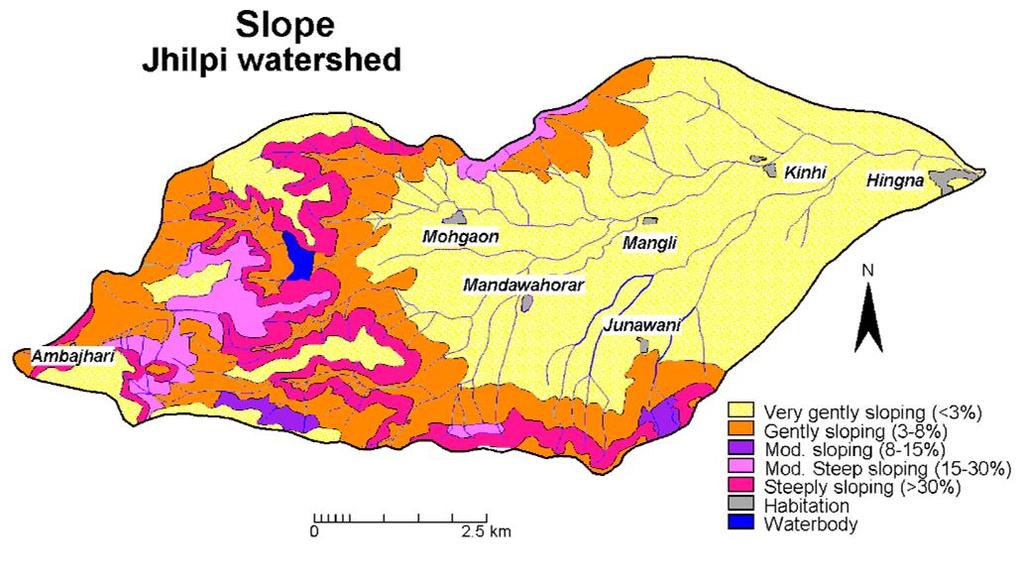
18 IRS-IC LISS-III Watershed Data in Soil characterization resource mapping at watershed level


 + LISS IV (5.")
19 Use of Fused Cartosat PAN + LISS IV Data in LRI Fused Cartosat PAN (2.5m) + LISS IV (5.8 m) Data in19
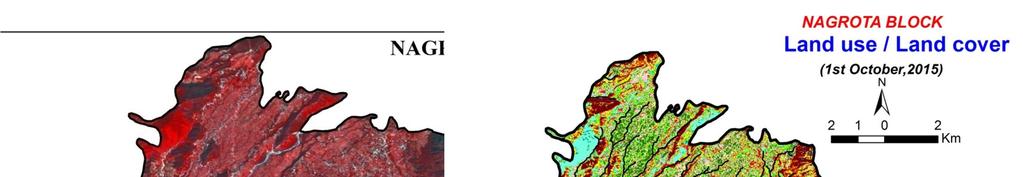
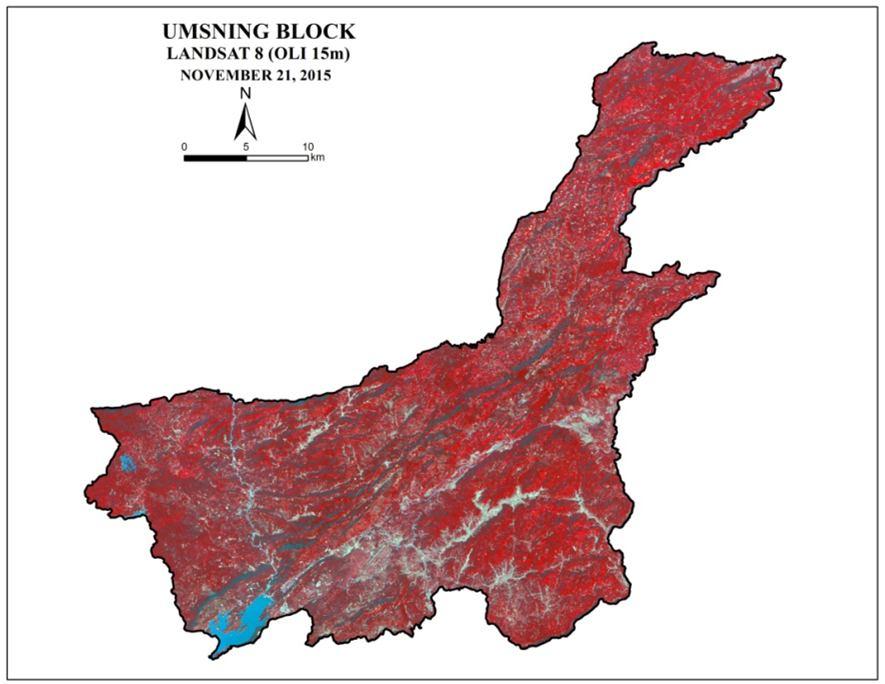
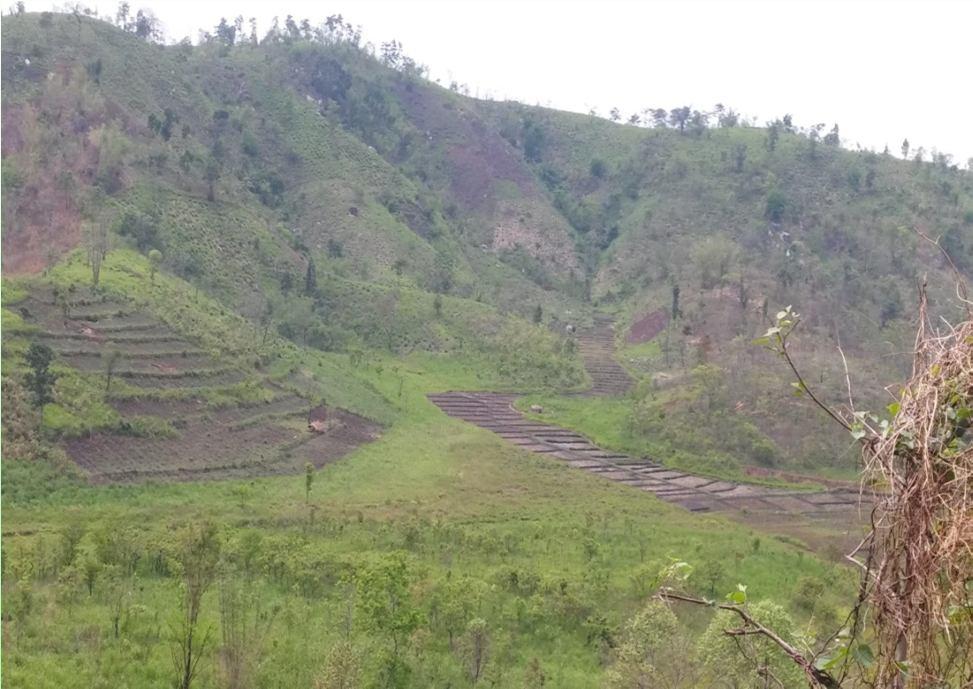
20 Landsat-OLI data in LULC mapping at 1:10,000 scale
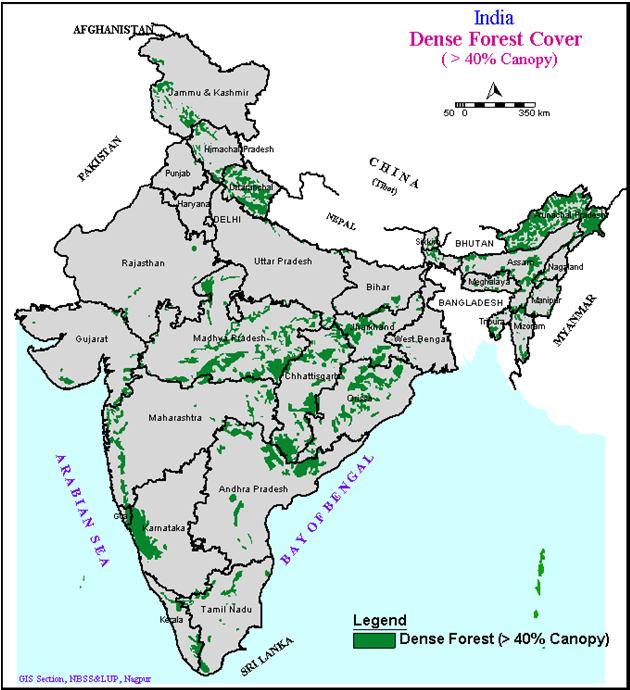
21 Harmonization of degraded and wastelands of India Total area under Dense forest : Mha 11.35%)

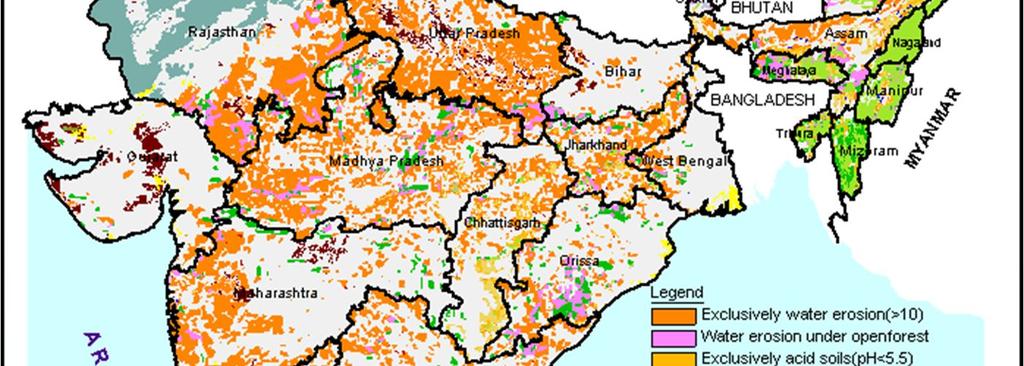
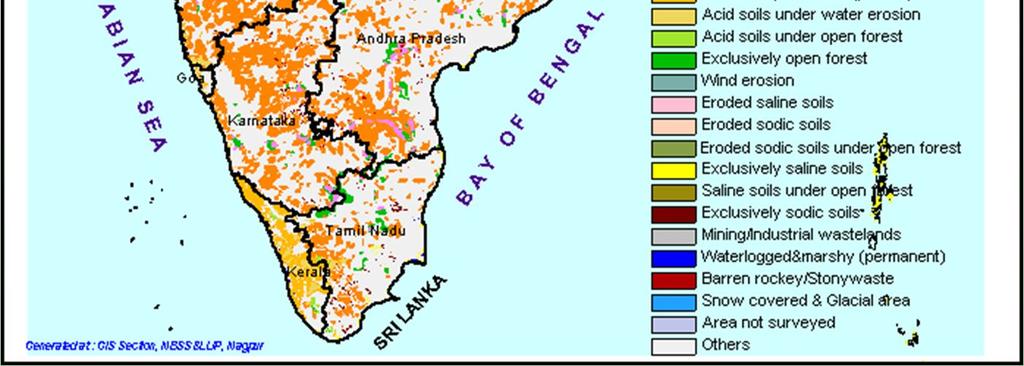
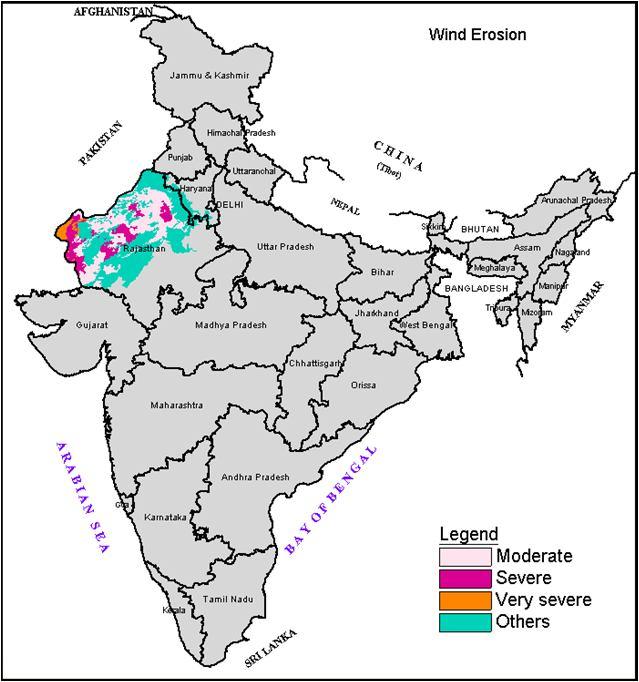
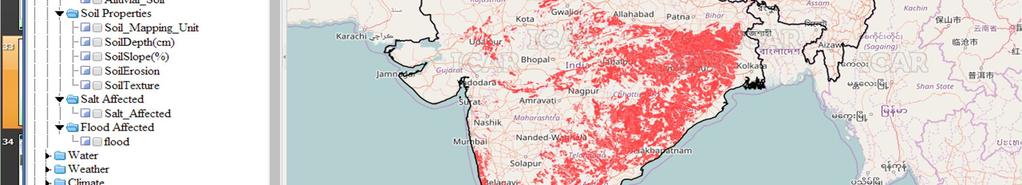
22 Land degradation map of India Degraded and Wastelands Mha

23 Status of land degradation in irrigated and rainfed areas in India


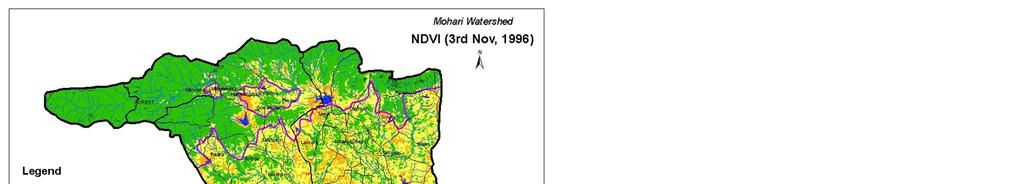
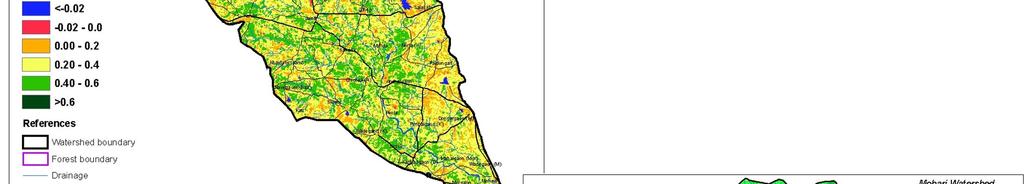
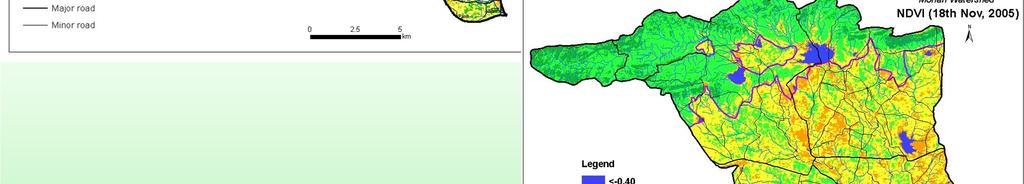
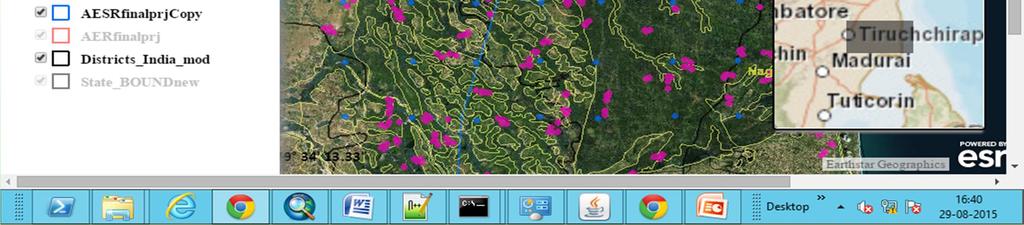
24 Temporal Satellite Data in mapping of land degradation at 1:10k


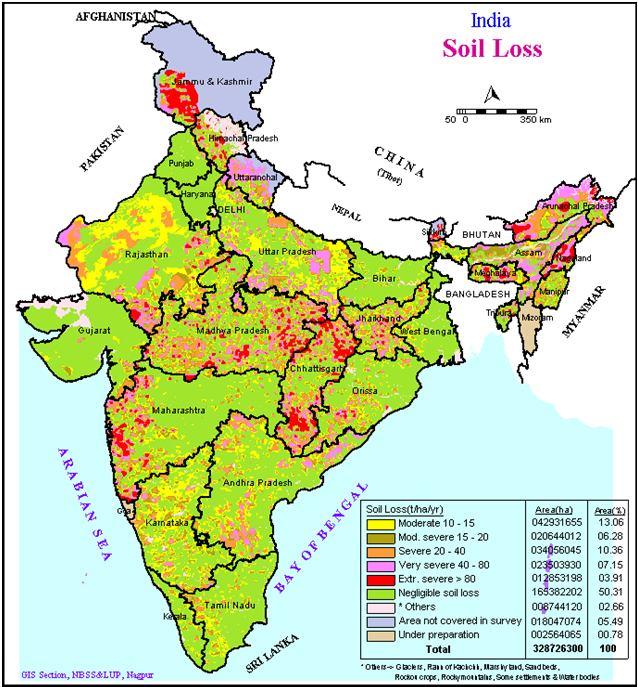
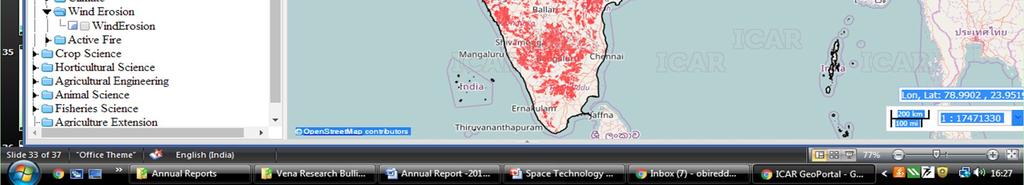
25 Temporal Satellite data in Assessment of Soil Erosion

26 Land degradation at 1:50,000 scale in collaboration with NRSC

 with FCC. Band 1 (0.45-0.52 µm) Band 2 (0.52-0.6 µm) Band 3 (0.63-0.69 µm) Band 4 (0.76-0.90 µm) Band 5 (1.55-1.75 µm) Band 6 (10.40-12.")
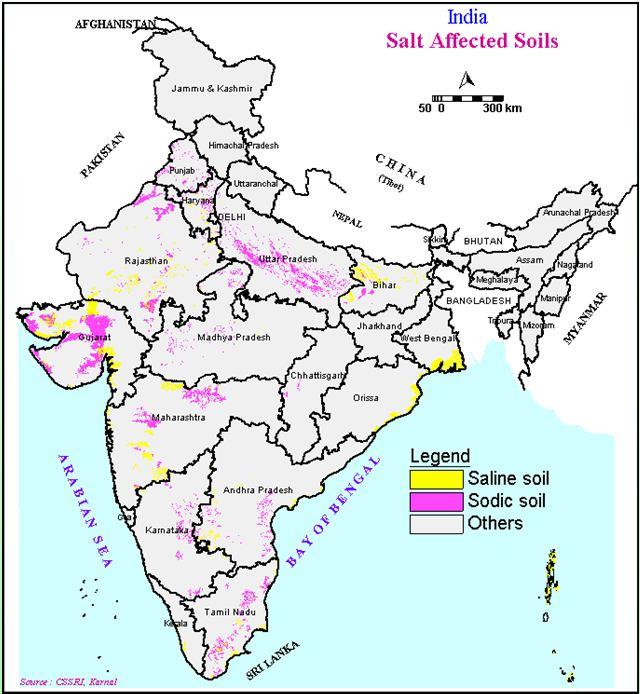
27 Mapping of Salt affected soils in IGP Satellite data acquired between 1st March and 15th April has been found most appropriate for mapping salt affected soils in the Indo-Gangetic plains. October - November image is suitable for differentiation between poorly drained and well drained soils. Similarity of tone of salt affected soils and sandy soils on satellite data has been resolved with integration of thermal remote sensing data ( µm) with FCC. Band 1 ( µm) Band 2 ( µm) Band 3 ( µm) Band 4 ( µm) Band 5 ( µm) Band 6 ( µm)


28 Spectral Reflectance Libraries of Indian soils
29 RS Data in in Natural Resources Monitoring


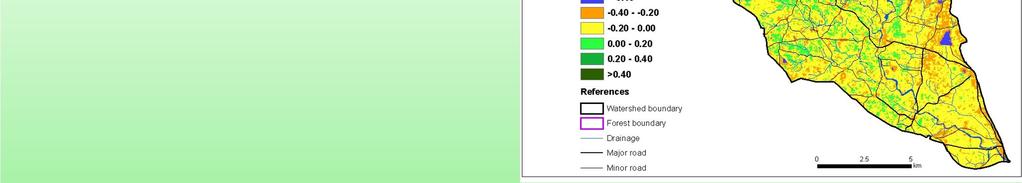
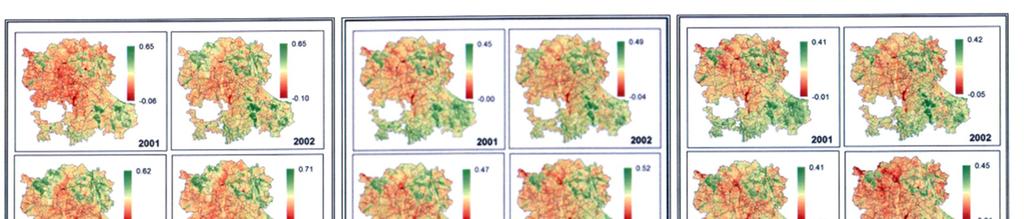
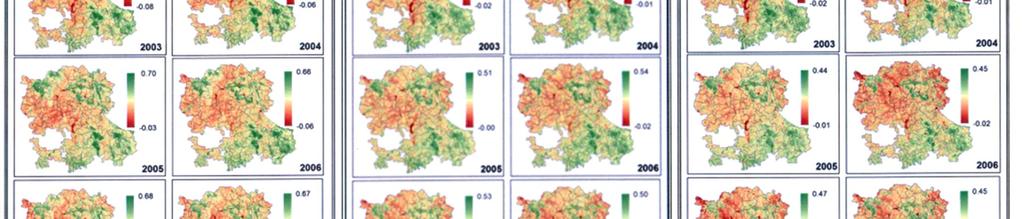
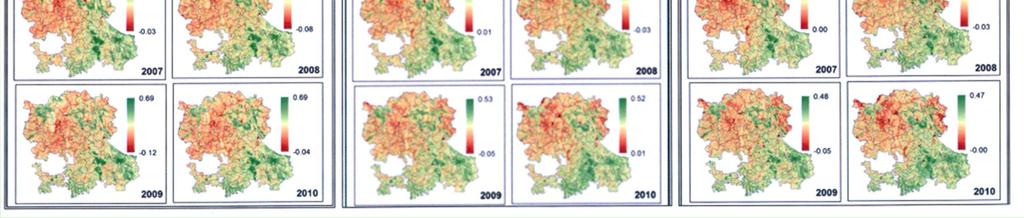
30 Crop status monitoring NDVI Profiles of part of IGP Year 2010 Day 1 (Julian date) NDVI profile shows moderately cropped areas Source: MODIS 250m data

")

31 Crop status monitoring Day 129 (Julian date) NDVI profile shows current fallows

 NDVI")

32 Crop status monitoring Day 241 (Julian date) NDVI profile shows moderately cropped area
33
34
35


36 Monitoring of Prolonged water logging Changing water logged scenario from 1992 to 2005 in coastal region of A.P.
37 RS Data in Natural Resources Management

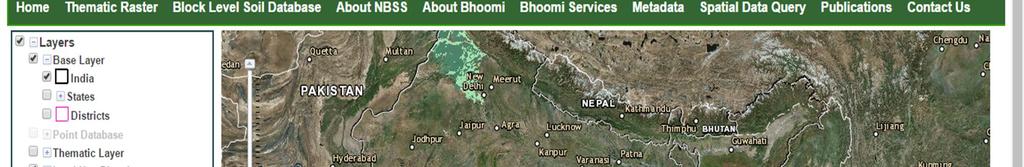
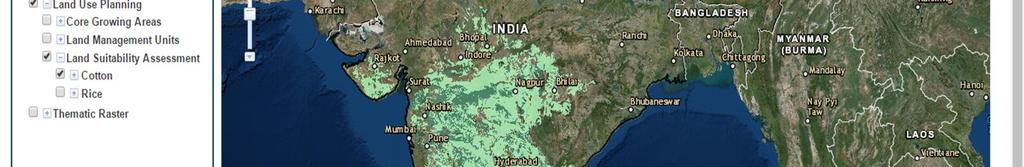
38 State Soil based thematic database for crop planning 38


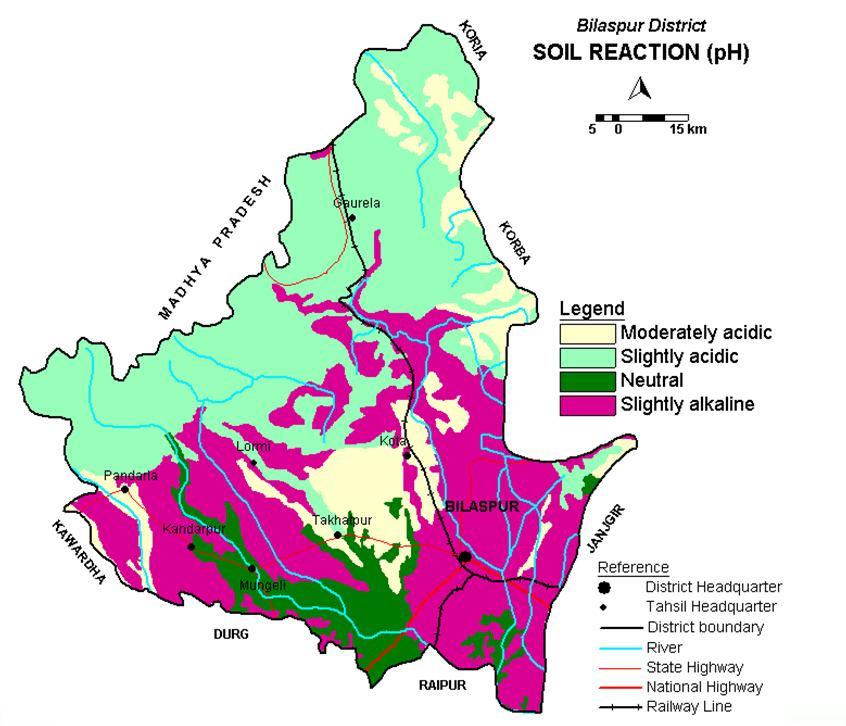
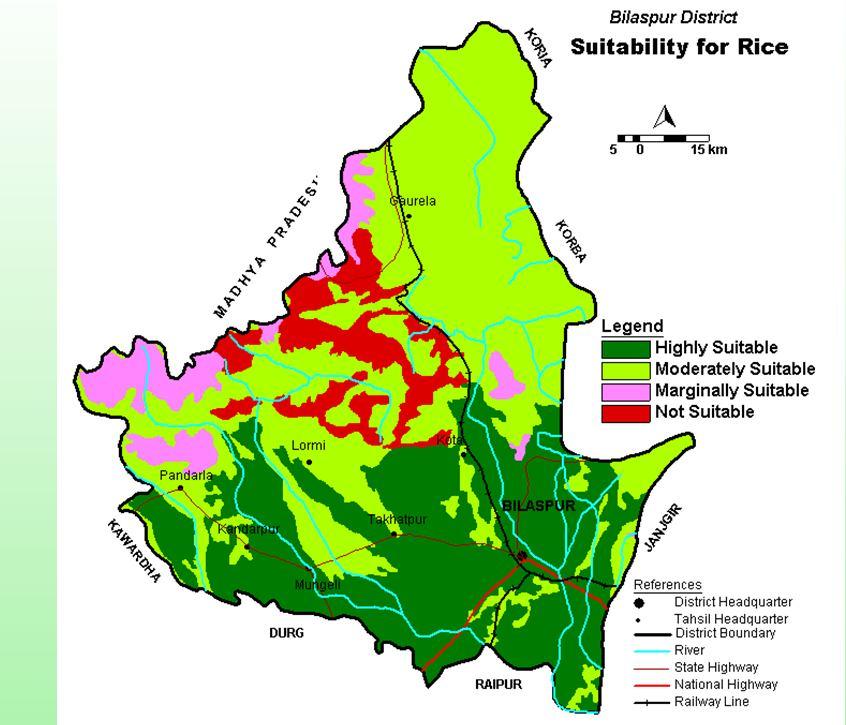
39 Soil resource data for crop planning

40 Soil-site suitability for cotton in part of Akola District

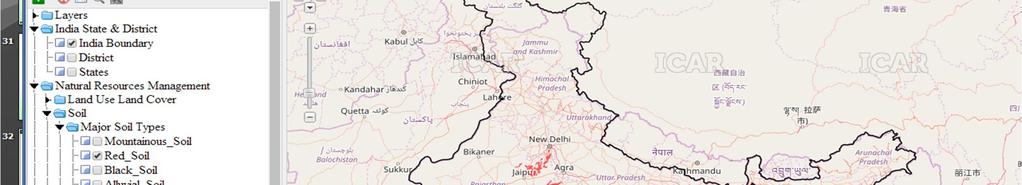
41 Red Soils in India

42 Alluvial Soils in India


43 Soil Nutrient Database
44
45 Way Forward Advance space technology need to be used extensively in mapping of land resource to develop reliable databases for sitespecific agricultural land use plans at national, state, district, block level Develop National Level institutional mechanism to periodically monitor the crop types and intensities to utilize in National, State, District, Tehsil level agricultural land use planning. Temporal Remote Sensing data need to be used in developing climate smart agriculture applications especially in rainfed agriculture Identify the national and international institutions and Research Partners to carryout the collaborative projects in space based applications in Indian agriculture Exchange scientific knowledge and expertise in the field of remote sensing technologies as a part of capacity building


46