Agriculture and Rice Research: Neglected Public Goods With Unmatched Return to ODA
|
|
|
- Gyles Nichols
- 5 years ago
- Views:
Transcription
1 Agriculture and Rice Research: Neglected Public Goods With Unmatched Return to ODA V. Bruce J. Tolentino, Ph.D. Deputy Director-General International Rice Research Institute (IRRI) International Conference on Asian Food Security Singapore, August 21-22, 2014
2 Founded 1960 by Ford and Rockefeller Foundations, and Philippines; Currently 1,350 staff from 34 nations; HQ at UPLB; scientists in rice-growing countries;
3 Autonomous, non-profit organization, with international status by treaty; Funding: governments, philanthropies. IRRI is unique!


4 IRRI s mission Reduce poverty and hunger, improve health, ensure environmental sustainability through rice science.


5 oldest food crop; Rice: the global staple staple for billions (~ 50% of world, >70% of poor)

6 The green revolution 1960s-70s yields ~1.5 tons/ ha. Today yields 4+ tons/ ha. +

7 1 billion hungry people Rice price crisis!

8 Most hungry people are in Asia Source: FAO
9 People Consumption per capita like in kg/person rice! Global, per = 65 kg person Thailand = 140 kg Myanmar = 228 kg Philippines = 120 kg Vietnam = 215 kg
10 600 Additional global rice needs: 8-10 MMT/ year Asia Africa Americas Rest of World
11 %/yr Growth in global rice yield has slowed Source of raw data: FAO, 2013


12 Worsening resource scarcity Land Labor Water


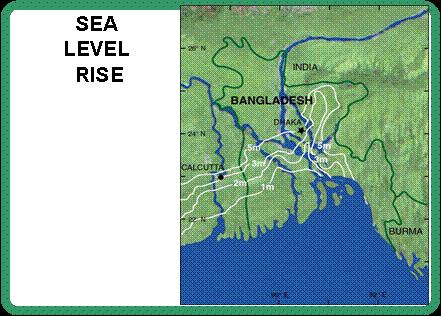

13 Climate change WILL reduce rice productivity


14 Rice systems must become more resilient to: Drought Submergence Salinity Heat Adaptation


15 Rice systems must become more efficient in Water use Fertilizer uptake Mitigation


16 Climate-friendly rice salinity drought heat submergence
17 To ensure food and nutrition security for all today, and also for future generations, we must invest in agricultural R&D. Basic agricultural R&D is a public good, appropriate for Official Development Aid (ODA).

18
19 ODA commitments to all LDCs in selected sectors and total, (real US dollars per capita) Health Food Aid Total ODA (right axis) Agriculture Debt Relief Rice 1995 Science for 2000 a Better 2005 World
20 ODA to agriculture, millions of 2006 dollars
21 ODA to agriculture as a share of total ODA

22 Agriculture s share of total ODA

23 Global real ODA to agriculture
24 Pre-history: food price crisis Index of real international food prices, ( =100) Source: K. Anderson (2006), Reducing Distortions to Agricultural Incentives: Progress, Pitfalls and Prospects. < Data shown are an index of export prices in US dollars for all major traded agricultural products, deflated by the MUV index which is the unit value of manufactures exported from France, Germany, 24 Japan, UK and US, with weights based on those countries exports to developing countries.

25 Relative to other things, food cheap, yet barely affordable to the poorest Major food riots, Jan Apr March 13, 2002 World: Many Hungry Mouths Around 815 million people percent of the world's population -- suffer from hunger and malnutrition, mostly in developing countries, said Jacques Diouf, head of the United Nations Food and Agriculture Organization. 25
26 OECD DAC ODA for Agriculture (Jan 2014 data) 2008 reference level = 100 Food price crisis = a wake-up call! YEAR Australia Belgium Canada Denmark Germany Netherlands Norway Sweden Swiss UK USA OECD
27 Total funding for CGIAR (15 Centers) 2008 to 2013 ($M) Via CGIAR channels Bilateral Other centre income Total CGIAR
28 OECD DAC Agri ODA (US$m) Sub-Sectors Agricultural development 921 1,783 2,600 2,994 2,606 Emergency food aid 3,908 3,373 2,742 2,870 2,448 Agricultural policy 1,221 2,348 1,952 1,713 1,778 Food security programs 1,885 2,280 1,743 1,460 1,731 Rural development 1,661 2,116 3,176 1,872 1,639 Agricultural water resources 1, ,233 1,337 1,590 Agricultural land resources Agricultural financial services Agricultural research Livestock Industrial crops/export crops Agricultural co-operatives Agricultural services Agricultural inputs Agricultural extension Fishery development Plant and post-harvest protection Other (15 other sub-sectors) 2,185 2,060 2,146 2,466 2,334 TOTAL 15,866 17,387 Rice 17,843 Science for 16,821 a Better 17,616 World
29 Return on agricultural research: 40% ++ Returns to investment in agricultural research typically exceeds 40% a best bet for eradicating global poverty and hunger; For every $1 invested, at least $9 worth of additional food is produced in developing countries.
30
31
32

33 Impact of IRRI Research IRRI delivered benefits of US$1.46 billion per year and boosted rice yields by an average of 11.2%. Average benefits (per ha., per year): Philippines: US$52/ha. Indonesia: US$76/ha. Vietnam : US$76/ha.

34 A US$20 investment in rice research will lift one person out of chronic poverty.
35 Visit us! IRRI HQ, Los Banos, Philippines