Efficiency, Productivity and Profitability Changes in the Indian Food Processing Industry: A Firm Level Analysis
|
|
|
- Helen Cross
- 5 years ago
- Views:
Transcription
1 Efficiency, Productivity and Profitability Changes in the Indian Food Processing Industry: A Firm Level Analysis Navreet Kaur Senior Research Fellow, Guru Nanak Dev University,Amritsar Dr. Kuldip Kaur Professor, Punjab School of Economics, Guru Nanak Dev University, Amritsar Abstract This paper analyses efficiency and productivity changes in 50 firms of food manufacturing industry during the time period of 1988 to 2011.The firms included belong to different sectors of food processing which are mainly Sugar, Bakery Products, Beer and Alcohol, Dairy Products, Processed Food and Vegetable Oil and Products. The nonparametric Data Envelopment Analysis (DEA) approach is used to compute the Malmquist Total Factor Productivity (TFP) change, which has been further decomposed into efficiency and technical change. Profitability has been calculated with two different measures. Analysis has been done over four time periods that is 1988 to 1993, 1994 to 1999, 2000 to 2005 and 2006 to Based on the findings, the paper gives suggestions that can be used by policy makers and food processors in making decisions regarding various technical and managerial aspects to improve productivity and efficiency. Keywords: Technical Efficiency, Total Factor Productivity, Profitability, Food Processing, Data Envelopment Analysis. potential source for driving the rural economy as it brings about synergy between the consumer, industry and agriculture. It is widely accepted that the food processing sector is the most appropriate sector for creating jobs for rural poor, and thus reducing the burden on agricultural sector for creation of their livelihood. As non-farm sector is gaining importance, food industry can be seen as major part of non-farm sector. A well developed food processing industry is expected to increase farm gate prices, reduce wastages, ensure value addition, promote crop diversification, generate employment opportunities as well as export earnings. With proper investment in food processing, technical innovation and infrastructure for agriculture sector, India could well become the food basket of the world. (Meeta P, 2007) Introduction In a country like India where more than half of the population is dependent upon agricultural sector, the Industry based on this sector for raw materials, is of utmost importance. This industry is also important from the Food Security point of view. India's strong agricultural base and accelerating economic growth holds a significant potential for the Food Processing Industry that provides a strong link between agriculture and consumers. Food processing is the transformation of raw ingredients into food, or of food into other forms. Food processing typically takes clean, harvested crops or butchered animal products and uses these to produce attractive, marketable and often long shelf-life food products. Food and food products are the largest consumption category in India, with a market size of USD 181billion. Domestically, the spending on food and food products amounts to nearly 21% of the gross domestic product of the country and constitutes the largest portion of the Indian consumer spending more than a 31% share of wallet. Going forward, the Indian domestic food market is expected to grow by nearly 40% of the current market size by 2015, to touch USD 258 billion by (FICCI-EY Report, 2009) The level and structure of the Indian food processing industry reflects that food production is mainly constrained due to the following reasons 1. Lack of comprehensive national policy on food processing sector. 2. Unavailability of trained manpower. 3. Expensive food machinery and packaging technologies. Food processing industry in India is increasingly seen as a 264
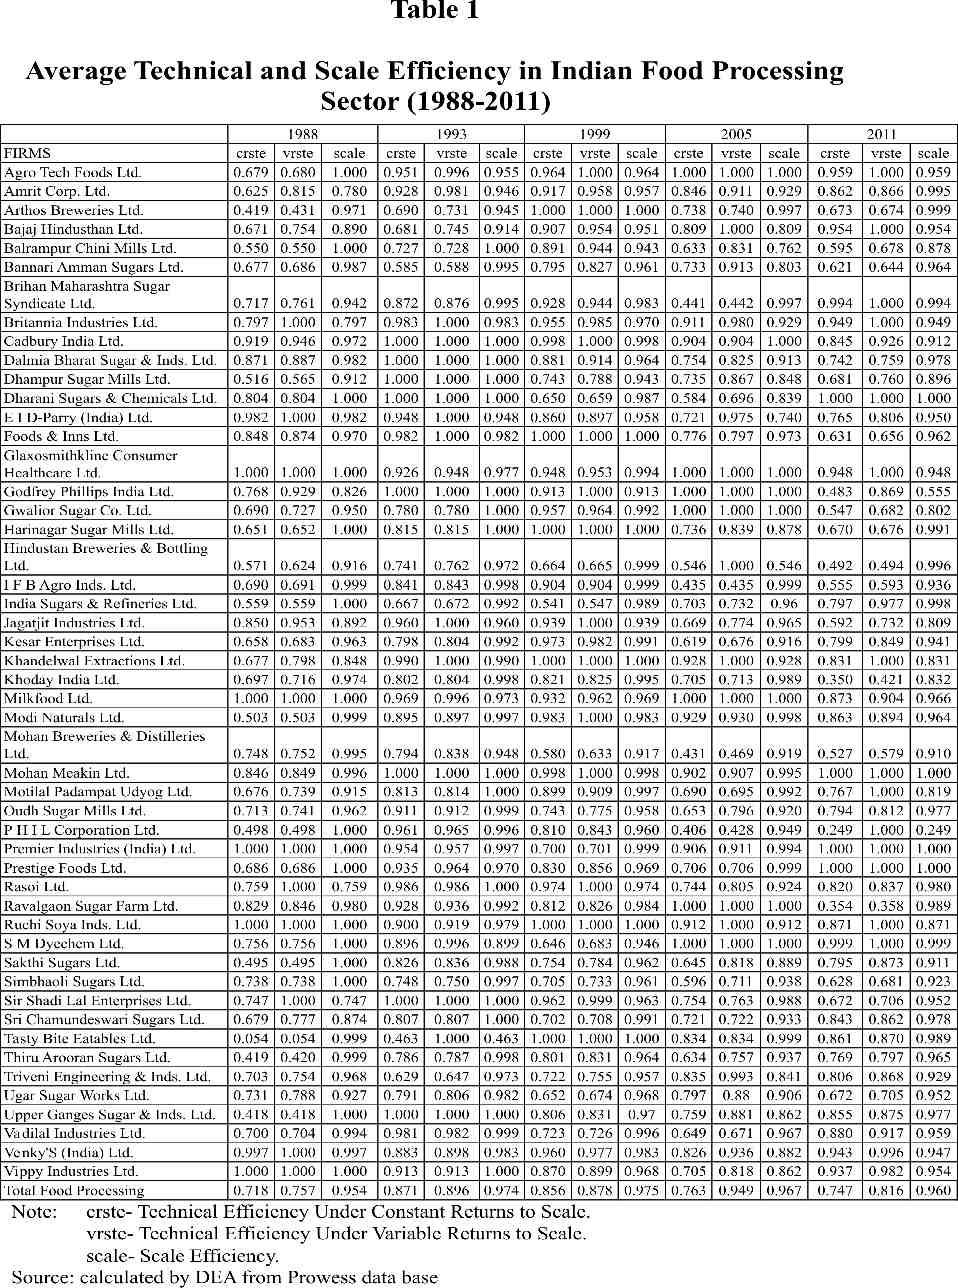
2 4. Constraints in raw material production. Data Base and Methodology 5. Inadequate infrastructure facilities The study is based on cross sectional data from all the 51 firms under food processing industry taken from Prowess data base and various reports published by Centre for Monitoring Indian Economy (CMIE). Average Technical and scale efficiencies have been calculated at five periods of time i.e. 1988, 1993, 1999, 2005 and Efficiency change and total factor productivity has been calculated at four points of time i.e. from , , and Three inputs and one output have been used. The inputs used are net fixed capital, expenses and raw material. The output variable is net sales. These variables can be defined as follows: 6. Less access to credit 7. Inconsistency in central and state policies. (FICCI Survey 2010) Food processing accounts for about 14% of manufacturing GDP, i.e. Rs. 2,80,000 crore, and employs about 13 million people directly and 35 million people indirectly. Its employment intensity can be seen by the fact that for every Rs. 1 million invested, 18 direct jobs and 64 indirect jobs are created in organized food processing industry only. ( GOI Report, 2011) Fixed Capital The food processing sector in India covers a wide range of food items such as meat and meat products, fish and fish products, fruits and vegetables, vegetable oils and fats, milk and milk products, grain milling, animal feed, confectionery products, bakery products, sugar processing, among others. The 50 firms included in the present paper belong to different sectors of food processing which are mainly from Sugar, Bakery Products, Beer and Alcohol, Dairy Products, Processed Food and Vegetable Oil and Products. Considering much important role of Food Processing Industry in India, this study evaluates the performance of various firms of the food processing industry in India in terms of TFP and efficiency change over the period of 1988 to 2011, in order to give some suitable suggestions to reap the benefits from this industry. Fixed capital comprises depreciated value of all fixed assets owned by the firm as on the closing day of the accounting year. Raw Material Raw material is the major input used by the firm. In food processing industry it constitutes raw agricultural produce of respective food unit, like food, spices, edible oils, vegetables, chemicals, ice and packing materials, etc. Expenses All the expenses of firm are included in this. Basically a sum of depreciation, interest payment, rent, wages of employees, cost of raw material, etc is used to estimate the expenses of a firm. Objectives Net Sales With this background, the main objectives of this study are as follows: Net sales or total revenue is the key item and it is derived by deducting goods returned, allowances and discount from the gross amount received from sales. 1. To evaluate the performance of Food Processing Industry in India in terms of efficiency. The main analysis applied for computing the firm level efficiency is Data Envelopment Analysis (DEA) Model. DEA is a performance assessment tool useful for calculating patterns of dynamic efficiencies. The DEA methodology was initiated by Charnes, Cooper, and Rhodes (1978) whose work was largely based on the frontier concept pioneered by Farrell (1957). Thus, the DEA is a methodology directed to frontiers rather than central tendencies (Seiford and Thral 1990). The original model developed by Charnes, Cooper and Rhodes (CCR model) was applicable when technologies were characterized by constant returns to scale (CRS) and all firms operated at an optimal scale (Coelli, Prasada, and Battese 1998). But, imperfect competition may cause a Decision Making Unit( DMU) not to operate at optimal scale (Coelli 1996). Therefore, an input-oriented variable returns to scale (VRS) Data Envelopment Analysis 2. To calculate the productivity changes in Food Processing Sector in India by calculating total factor productivity. 3. And finally to analyze the profitability changes in the food processing industry in India. 4. To draw some conclusions and policy implications on the basis of the findings. The study has been divided into five sections in total including the present one which is introductory in nature. Section III discusses data base and methodology used in the study. Next section presents the main results and discussions from the analysis. Sections V and VI draw conclusions and policy implications. 265
3 model. It has also increased from in 1988 to in 2011 but with similar trends in the middle years. The average scale efficiency in Indian food processing firms is estimated to be in 1988 and it has increased in all the years except in 2005 but it has reached at in The efficiency scores in the food processing industry vary significantly across different firms and over time. It is also evident that the average technical efficiency scores for the food processing industry as a whole have experienced declining trends during the whole study period. The average technical efficiency during 1988 i.e. the pre-liberalization period is low due to various restrictions on Indian industry. Though it has increased during 1993 i.e. the liberalization period, but after that in the post- liberalization period it has again declined. This phenomenon may be because of high gestation lag in capital investment. However, the scale efficiency has shown increasing trends in almost all the periods. This implies that market liberalization has facilitated the investment in capital and also its capacity utilization. Model extended by Banker, Charnes, and Cooper (BCC Model) in 1984 has been used for measuring technical and scale efficiency. For estimating the TFP change in the Indian food processing industry, the Malmquist productivity index is used. The Malmquist productivity index was introduced by Caves, Christensen, and Diewert (1982) based on the distance functions developed by Malmquist, which is defined as the ratio of two output distance functions. In other words, the Malmquist TFP index measures the TFP change between two data points by calculating the ratio of the distances of each data point relative to a common technology. The Malmquist TFP index and efficiency scores have been obtained by using the Data Envelopment Analysis Program (DEAP) software (version 2.1) developed by Coelli (1996). The Malmquist TFP index measures the productivity changes over period t to period t+1. This output-based index explains the change in productivity level in given level of inputs. The TFP change in a firm occurs either due to technological progress (i.e., shift in the production frontier), or due to efficiency improvements in the firm (Hossain and Bhuyan 2000). A productivity value index larger than one indicates a productivity improvement and a value less than one indicates productivity decline. The relevance of returns to scale analysis in business decision-making is a well researched area (Kang and Kwon 1993; Segoura 1998; Butler and Li 2005). The analysis provides information about production performance and helps to determine the effectiveness of resource utilization. Table 2 indicates that number of firms operating under decreasing returns to scale has increased from 21 firms in 1988 to 38 firms in In 1988, 20 firms were operating under constant returns to scale, but in 2011 this number has decreased to 4. Majority of the firms have moved towards decreasing returns to scale during These results clearly indicate that liberalization process might have caused over-capitalization and hence capacity might not have been fully utilized as returns are increasing at decreasing rate. This finding has also been supported by the previous results of technical and scale efficiency, which have shown that after market reforms efficiency has increased at nominal rate. Profitability of the firms has been calculated with two measures so there are two profitability ratios P1 and P2. P1 is defined as net profits as per cent of net sales and P2 is defined as net profits as per cent of total assets. Results and Discussion Performance of food processing industry in India Food processing is an emerging sector of Indian economy and is growing at a rate of more than 10 percent per annum. The majority of the food processing units in the country are unorganized and are facing various kinds of challenges in the fast changing global scenario. The performance of Indian food processing industry is measured in terms of technical and scale efficiency (Table 1). The technical efficiency is the product of its scale efficiency and pure technical efficiency estimated under the assumption of constant returns to scale. The values of efficiency indices equal to unity imply that the industry is on best practice frontier, while values below unity show that the industry is below the frontier or technically inefficient. Analysis of the data shows that the average estimated technical efficiency score is in 1988 under the CRS model and it has increased to in 1993 which shows the immediate effects of Industrial reforms on industrial performance but after that i.e. in 1999 and 2005 it has decreased and reached at in So if we look at the whole period,technical efficiency has increased slightly from to in 2011 but it has shown decreasing trends after 1993 and similar is the case with technical efficiency scores under the VRS Productivity Changes in the Food Processing Industry Table 3 shows the estimated average annual rate of productivity and efficiency changes in the Indian food processing industry during the four different time periods which are , , and The Malmquist TFP index measures the productivity changes over period t to period t+1. This output-based index explains the change in productivity level in given level of inputs. The TFP change in a firm occurs either due to technological progress (i.e., shift in the production frontier), or due to efficiency improvements in the firm (Hossain and Bhuyan 2000). A productivity value index larger than one 266
4 efficiency and productivity. With the advent of industrial policy reforms in 1991, firms have shown slighter improvement in profitability but after that the profitability of firms has shown declining trends. indicates a productivity improvement and a value less than one indicates productivity decline. Results revealed that during the study period, most of the firms of the food processing industry experienced positive change in Total Factor Productivity with varied magnitude. The overall TFP change in the Indian food processing industry has increased from in to in Out of 51 firms only 21 firms have shown increase in TFP in 2011 as compared to 38 firms in So, the contribution of technological progress and efficiency change in various firms of food processing has shown mixed trends. There can be many reasons behind the low profitability of firms, some of which are India's problematic infrastructure, lack of proper storage facilities which leads to wastage of raw produce and last but not the least is inflation and changing commodity prices which hamper the growth and profitability of firms in this sector. Conclusions The food processing sector is the most appropriate sector for creating jobs for rural poor, and thus reduces the burden on agricultural sector for creation of their livelihood. This is due to their familiarity with the agricultural sector which would make it easier to train and place them in food processing enterprises. But the level of food processing in the country is at its initial stage and only a small quantity of agricultural produce is processed. The growth in the Indian food processing industry is mainly constrained due to lack of productivity enhancing technologies and limited resource utilization. Therefore, technology is the key to enhance growth and efficiency in the food processing sector. Profitability Changes in the Food Processing Industry Profitability of the sample firms has been calculated with two measures. Profitability ratio P1 is defined as net profits as per cent of net sales and P2 is defined as net profits as per cent of total assets. Further depending upon the values, profitability has been divided into three ranges i.e. low, medium and high. Low range comprises of firms having profitability ranging up to 1%, medium range consists of firms having profitability ranging from 1.1% to 5% and high range consists of firms having profitability ranging from 5.1% to 10% or above. The analysis suggests that the efficiency scores in the food processing industry vary significantly across different firms and over time. It is also evident that the average technical efficiency scores for the food processing industry as a whole have experienced declining trends during the whole study period. However the scale efficiency has slightly improved. This implies that market liberalization has not properly facilitated the enhanced investment in capital goods which could have resulted in greater capacity utilization. The analysis of returns to scale suggests that most of the firms have moved from Increasing returns to scale towards Constant returns to scale and Decreasing returns to scale. This result clearly indicates that additional investment in the food processing firms with increasing and constant returns to scale will give encouraging and profitable output, whereas firms with decreasing returns to scale need significant reorientation and modernization of the production process. Table 4.1 presents the profitability (P1) of Food industry in India. Results revealed that in 1988, 18 out of 50 firms are highly profitable. Of the total, 20 firms i.e. 40% firms lie in medium range and 24% firms have low profitability. But in 1993 there is a slighter improvement in profitability as percentage of firms under low range has decreased from 24% in 1988 to 20% in 1993 and under medium range it has increased from 40% in 1988 to 46% in But there after the profitability of firms has declined i.e. 48% belong to low range of profitability in 2011 as against 20% in 1993 and remaining 52% are equally divided in medium and high ranges. Similarly table 4.2 presents the profitability (P2) of Food industry in India. Results revealed that in 1988, 44% firms are highly profitable. Out of the total firms, 17 firms i.e. 34% firms lie in medium range and 22% firms have low profitability. But in 1993 (similarly as P1) there is a slighter improvement in profitability, as percentage of firms under low range has decreased from 22% in 1988 to 18% in 1993 and under medium range it has increased from 34% in 1988 to 42% in However, again the profitability of firms has declined i.e. 44% firms belong to low range of profitability in 2011 as against 22% in 1993 and remaining 56% firms belong to medium and high ranges as 30% and 26% respectively. The food industry has experienced positive change in TFP with varied magnitude across different firms. Out of 51 firms only 21 firms have shown increase in TFP. So the contribution of technological progress and efficiency change in various firms of food processing has shown mixed trends and this needs attention for sustainable growth of the food processing sector. So, the results of profitability of Food Processing Industry have somehow shown consistency with the above results of Results of profitability analysis revealed that firms have shown little improvement in terms of profitability with the 267
5 Data Envelopment Analysis, Management Science, 30.(9), pp advent of economic reforms but after that firms have shown declining trends. After economic reforms government has focused on food processing industry but still investment in this sector is very low. Coelli, T. (1996), A guide to DEAP Version 2.1: A Data Envelopment Analysis (computer) program (CEPA Working Paper 96/08), University of New England, Australia: Centre of Efficiency & Productivity Analysis, Department of Econometrics. Policy Implications The study provides empirical evidence on efficiency, productivity and profitabiliy changes for different firms of the food processing industry over a period of more than two decades. Results have shown that firms with higher efficiency and productivity seem to be more attractive for investment. Given the contribution of the food processing industry for diversification of employment from primary sector to secondary sector, the government may plan a relief package for inefficient firms to enhance their performance. This sector is directly attached to agriculture sector, so, its improvement will help in reducing many problems related to agricultural sector like disguised unemployment. Government intervention in raw material sourcing for food processing units is quite critical, and policy reforms should be made to allow direct participation of food processors in procuring their raw material from the farmers, thus eliminating the middle men. FICCI (2009), A Report on Processed Food & Agribusiness: Opportunities for Investment in India, Mumbai, India. FICCI (2010), A Report on Bottlenecks in Indian Food Processing Industry, Mumbai, India. Kachru, R.P (2006), Agro-Processing Industries in IndiaGrowth, Status & Prospects, Indian Council of Agricultural Research, New Delhi, India. Meeta, P (2007), Emerging Environment for Agribusiness & Agro-Industry Development in India, Food and Agricultural Organization of the United Nations, New Delhi, India. Mehta, GS (2012), Agro-Processing Industry in Uttar Pradesh: Emerging Structure and Development Potentials, Giri Institute of Development Studies, Lucknow, India. Food processing industry should be seen as priority sector because India having access to vast pool of natural resources and growing technical knowledge base, has strong comparative advantage over other nations in this industry. The development of infrastructure facilities like cold chain, road facilities and most important continuous supply of power will strengthen the food processing industry. The food processing industry is all set to drive Indian economy to higher growth, only need is to pay due attention on technological development of field, and generation of skilled manpower. Therefore, to fully leverage the growth potential of the sector, current challenges that are being faced by the industry need to be properly addressed and steps need to be taken to remove the bottlenecks hampering the sectoral growth. Rais, Mohammad, Shatroopa Acharya and Neeraj Sharma (2013), Food Processing Industry in India: S & T Capability, Skills and Employment opportunities, Journal of Food Processing and Technology, Vol. 4, Issue 9, pp Ray, S.C. (2002), Did India's Economic Reforms Improve Efficiency & Productivity? A Non-parametric Analysis of the Initial Evidence from Manufacturing, Indian Economic Review, Vol.1, No. 37, pp Sharma, S.K. and S. Sehgal (2011), Total Factor Productivity of Manufacturing Sector in India: A Regional Analysis for the State of Haryana, International Journal of Management & Business Research, Vol. 1, No. 4, pp Bibliography Ali, Jabir, Surendra P. Singh and Enefoik Ekanem (2009), Efficiency and Productivity Changes in the Indian Food Processing Industry: Determinants & Policy Implications, International Food and Agribusiness Management Review, Vol. 12, Issue 1, pp Soni, Bhavana, Mohit Gupta, Hotam Singh Chaudhary and Anita Garg (2013), Updates on Agro based Food Processing Industry in India, International Journal of Scientific and Engineering Research, Vol. 4, Issue 9, pp Balakrishnan, P., K. Pushpangadan and M.S. Babu, (2000), Trade Liberalization and Productivity Growth in Manufacturing: Evidence from Firm Level Panel data, Economic & Political Weekly, 35(41), pp Banker, R.D., A Charnes & WW Cooper (1984), Some Models of Estimating Technical and Scale Efficiencies in 268
6 269

7 Venky's india ltd. 270
 271")
8 Table 3 Efficiency Change, Technological Progress and TFP change in Indian Food Processing Industry ( ) 271
9 272