Greenmarket/GrowNYC Healthy Exchange Project 2015 Highlights
|
|
|
- Brianne Randall
- 5 years ago
- Views:
Transcription

1 Greenmarket/GrowNYC Healthy Exchange Project 2015 Highlights

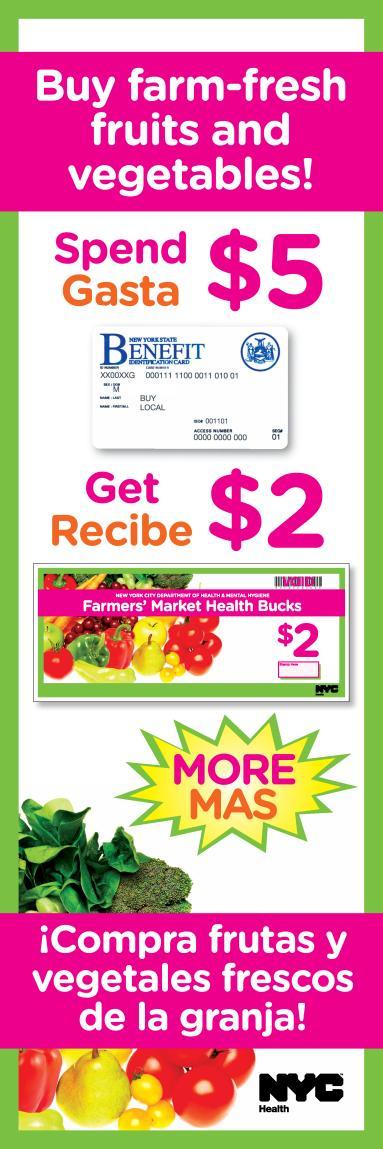
, Health Bucks, the")

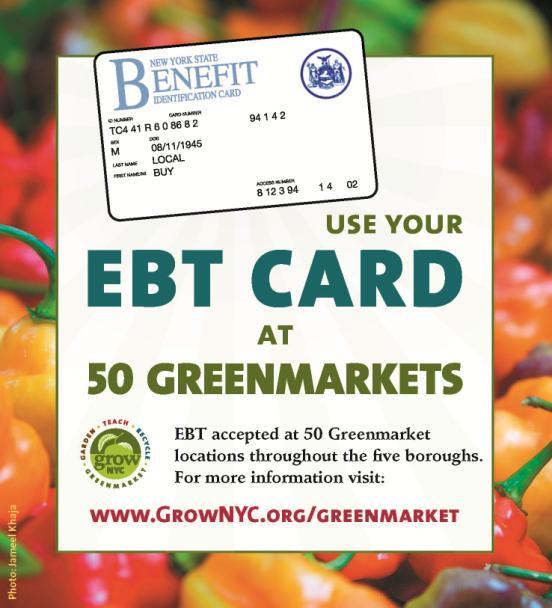
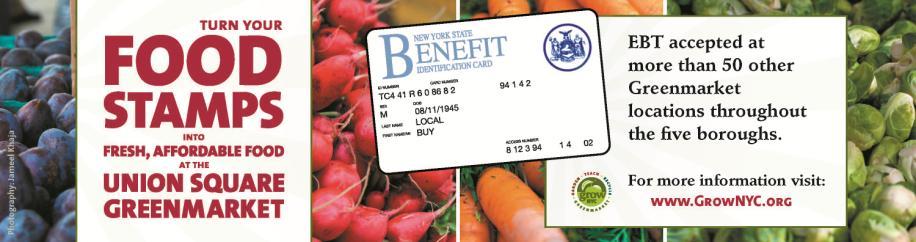
2 GrowNYC s Healthy Exchange Project provides the framework for making healthy, regional food accessible to all New Yorkers by overseeing GrowNYC s work to promote and accept SNAP (Supplemental Nutrition Assistance Program), Health Bucks, the Farmers Market Nutrition Program (FMNP) Checks, WIC Vegetable and Fruit Checks, Greenmarket Bucks and the Greenmarket Seniors project
3 Project Funding Sources Greenmarket Stand Fees 21% Foundations 23% Farmer and Customer Token Processing Fees 15% New York City Council 41%
 contributed an additional $60K in Health Bucks sales at the Elmhurst Hospital and Jackson Heights")
4 Token Sales SNAP sales totaled over $918K, an increase from $894K in 2014 Debit-Credit Sales totaled over $973K, an increase from $837K in 2014 Health Bucks Greenmarket distributed over $298K in Health Bucks as SNAP incentive Wholesome Wave s Fruit and Vegetable Prescription Program (FVRx) contributed an additional $60K in Health Bucks sales at the Elmhurst Hospital and Jackson Heights Greenmarkets WIC + WIC + brought a combined $15K in WIC Vegetable and Fruit check and incentive sales to the Corona and Elmhurst Greenmarkets We are currently looking to secure 2016 funding for WIC + Greenmarket Seniors Senior project growing 33 senior tours this year (aiming for 70 next year) Partnered with Emblem Health to complete 7 presentations and cooking demonstrations in senior centers
 that assists farmers and markets")
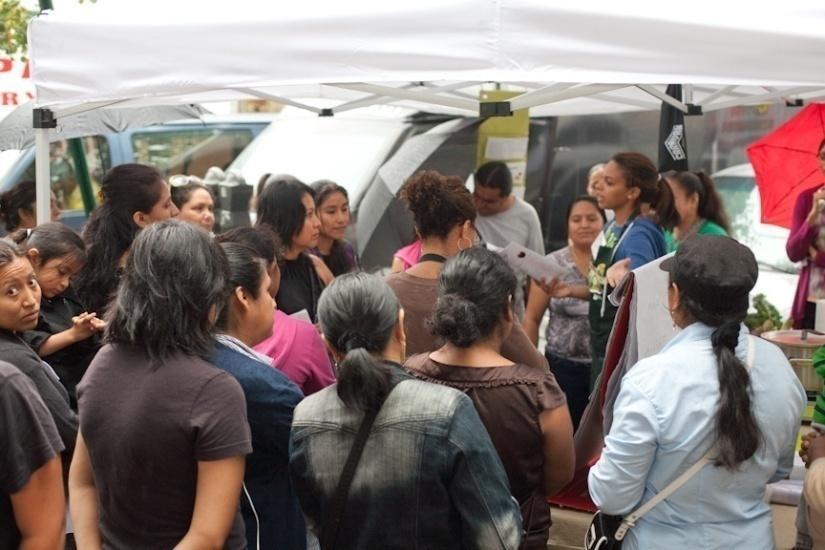
5 SNAP Screenings Greenmarket worked with New York City Coalition Against Hunger, Met Council, SEEDCO, and the Food Bank for NYC to have regular SNAP Screenings in 15 Greenmarkets Combined they completed over 600 screenings at Greenmarkets in 2016 MarketLink MarketLink is a program of the National Association of Farmers Market Nutrition Programs (NAFMNP) that assists farmers and markets with accepting SNAP and other electronic payments Founded in 2013 in partnership with the United States Department of Agriculture, MarketLink has helped more than 3,000 farmers and markets accept electronic payments - including more than $1m in SNAP sales Greenmarket and Youthmarket received a combined 32 ipads and iphones and 3 year data packages for each device for free from MarketLink, a $95,000 value MarketLink funding is available for both farmers and farmers markets in 2016 Consulting Healthy Exchange Project Staff worked with the Jersey City Department of Health and Human Services to consult for 3 Jersey City farmers markets helping them to set up and launch a SNAP program in their markets


6


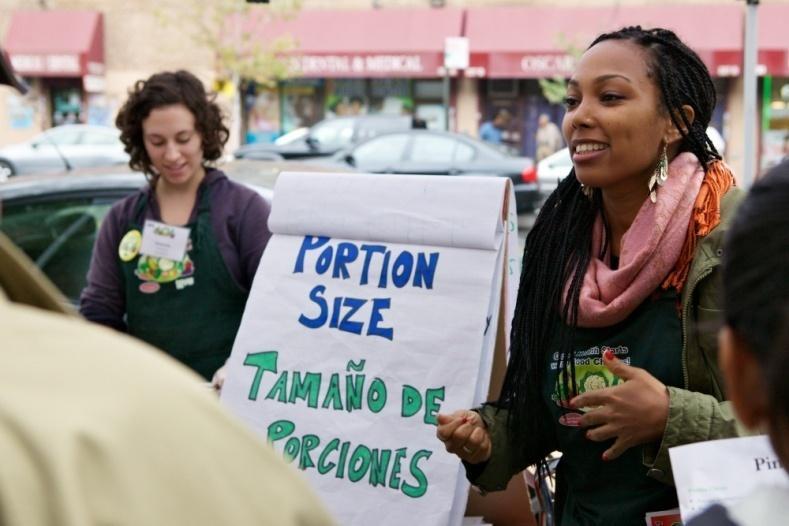
7 In 2015 Stellar Markets reached 25,917 Greenmarket shoppers via nutrition demonstrations

8 Greenmarket Affordable Eats Every Monday at the Union Square Greenmarket GrowNYC hosts a cooking demonstration that shows customers how to feed a family of four for less than $5 per person Ingredients are sourced directly from the market and displayed by producer and actual cost so that shoppers can replicate the meal at home Cornell Cooperative Extension Staff and volunteers from Cornell Cooperative Extension s Farmers Market Nutrition Education Program perform cooking demonstrations at Greenmarkets using seasonal ingredients Encourages consumption of locally-grown fruits and vegetables and promotes proper use of FMNP checks In 2015, Cornell served five Greenmarkets, completing 239 nutrition classes with 16,757 participants


9


10

 In 2015 Greenmarket led 33 senior tours with approximately 650 participants; Greenmarket aims to lead 70 tours and presentations")
11 Established in the fall of 2012, Greenmarket Seniors aims to improve nutrition, enhance social interaction, and benefit the overall physical and emotional health of New York City s older adults through interactive, educational tours of farmers markets During market tours, seniors are provided with an orientation around the types of benefits accepted in the market including SNAP, Health Bucks, and the Farmers Market Nutrition Program (FMNP) In 2015 Greenmarket led 33 senior tours with approximately 650 participants; Greenmarket aims to lead 70 tours and presentations in 2016
12 SNAP Sales Total Number of Greenmarkets $1,000,000 Annual Greenmarket SNAP Sales vs. Number of Greenmarkets that Accept SNAP 60 $900,000 $800, $700, $600, $500,000 $400,000 $300, $200,000 $100,000 $ # of Greenmarkets that Accept SNAP # of Greenmarkets not Accepting SNAP Total Greenmarket SNAP Sales 10 0
13 $500,000 Greenmarket SNAP Sales History by Borough $475,366 $450,000 $400, $350, $300, $250, $200,000 $150,000 $100,000 $143,562 $158,657 $114, $50,000 $26,491 $0 Bronx Brooklyn Manhattan Queens Staten Island
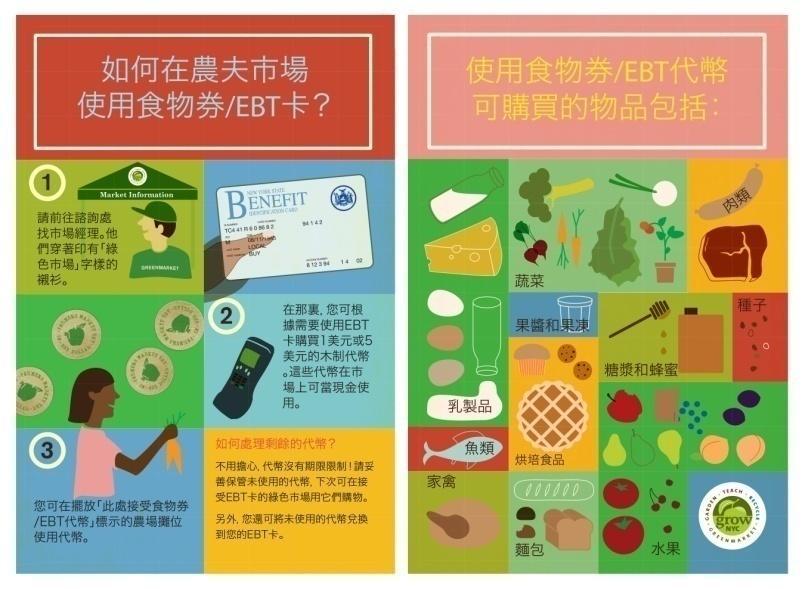
14 How Customers Spent their SNAP Benefits in 2015 Baked Goods, Grains, Beans 12% Syrup, Preserves, Honey 7% Vegetables, Food Producing Plants and Seeds 47% Dairy 8% Fish 3% Orchard/Fruit 16% Meat, Poultry, Eggs 7%
15 60000 SNAP Customer Transaction History $ $18.00 $ $14.00 $12.00 $ $8.00 $ # of transactions # of customers avg. transaction amount $4.00 $2.00 $0.00
16 2% 2% 8% 2015 Number of SNAP Shopper Visits More than 15 Visits Visits 6-10 Visits 2-5 Visits 51% 1 Visit 37%
17 12% of SNAP customers contributed to over 50% of total SNAP sales in 2015 Frequent and Loyal Shoppers are Important! $1,000, Number of Customer Visits as a Percentage Contribution to SNAP Sales $900, $800, Visit, 14% $700, $600, Visits, 34% $500, $400, Visits, 21% $300, $200, Visits, 12% $100, $0.00 More than 15 Visits, 19% 2015 SNAP Sales
18 $4,500,000 Federal Benefits Spent in Greenmarkets Since 2009 $4,000,000 $3,500,000 $3,000,000 $2,500,000 $2,000,000 $1,500,000 Health Bucks SNAP WIC V & F FMNP $1,000,000 $500,000 $
19 $12,000,000 SNAP in Greenmarkets Project Impact Since 2005 $10,000,000 $8,000,000 Additional Economic Activity Created*, $4,049,359 $6,000,000 Combined Health Buck Distribution, $1,190,428 $4,000,000 $2,000,000 Combined SNAP Sales, $5,125,771 $0 *The U.S. Department of Agriculture estimates that for every dollar spent on SNAP, $1.79 in economic activity is generated, mostly in local communities.