1903 Plant density studies in San Joaquin Valley upland cotton
|
|
|
- Daniel Sharp
- 5 years ago
- Views:
Transcription
1 1903 Plant density studies in San Joaquin Valley upland cotton Mr. Steve D. Wright, University of California Cooperative Extension, Tulare, CA Mr. Robert B. Hutmacher, University of California Cooperative Extension, Tulare, CA Mr. Gerardo Banuelos, University of California Cooperative Extension, Tulare, CA Mr. Mark P. Keeley, University of California Cooperative Extension, Tulare, CA Mr. Dan Munk, University of California Cooperative Extension, Tulare, CA Mr. Ron Vargas, University of California Cooperative Extension, Tulare, CA Mr. Brian H. Marsh, University of California Cooperative Extension, Tulare, CA Mr. Tome M. Duvall, University of California Cooperative Extension, Tulare, CA Mr. Raul Delgado, University of California Cooperative Extension, Tulare, CA The objectives of these tests were to determine best time of planting and the optimum plant densities. Several studies were initiated from 1996 through 2001 in the San Joaquin Valley (SJV) to develop information on sensitivity of growth, lint yield and fiber quality responses to planting dates and planting density. Varieties included two non-acala Upland and one Acala that represented a range of growth habits and maturity. The studies were conducted at two locations for each year, one in a clay loam soil in the central SJV, the other in a sandy loam soil in the southern SJV. Among the variables evaluated, the largest yield responses within any variety were planting date; with the earlier (March to April) planting dates consistently out-yielding May plantings. Planting density effects on yields were greatest in March and April plantings, where higher plant populations tended to reduce yields, particularly in the Acala variety. Under lower yield conditions or with later planting dates, higher plant populations generally had little impact or even slightly improved yields. Studies were conducted in 2002 and 2003 to compare different plant densities in single row 76.2-cm bed cotton near Visalia, California. Single row densities of 178,000 or 205,000 plants per hectare significantly reduced yields compared to 116,000. In 2003, there were not significant differences between single row 76.2-cm cotton with densities of 74,000 to 198,000 plants per hectare. Introduction The objectives of these studies were to determine best time of planting and the optimum plant densities. Prior to 1996 the first legal planting date had been March 20. In some years because of cold weather, hail damage, or too dry or too wet soil conditions, growers are unable to plant early and plant as late as May. The main factors influencing yield potential when considering replanting are: average plant density, amount of skips, amount of chilling injury, seedling disease, weed pressure, and loss of yield potential due to late replanting. Replant decisions are difficult because one must consider the loss in time and the additional replanting cost of approximately $123 per hectare. The unpredictability of weather conditions compounds this decision. Information was required to determine what plant density was needed to give optimum yields for different planting dates and also to determine when it was too late to make it profitable to plant cotton. Methods and Materials In 1996 and 1997 Acala Maxxa was planted at six different dates from March 20 through May 30. Cotton was planted at 200,000 plants per hectare and then thinned to different densities. Within each planting date densities of 50,000, 100,000, 150,000, and 200,000
2 plants per hectare were maintained. Plant map data was collected. Lint yield and quality data was collected. In general later planted cotton resulted in almost no bolls. Studies were conducted in a complete factorial design with four different densities. Plot size was four, cm rows by m, replicated 3 times at the West Side Research and Extension Center and Shafter Field Station. The two center rows were machine harvested. A 76.2-cm study was also conducted in Merced County. Plot size was four rows by 9.14 m, replicated three times. Two 3.05-m sections from the center rows were hand harvested. In season and final plant monitoring data including height, number of nodes, vegetative nodes, percent bolls at position 1, 2, and 3 and greater, 95 percent fruiting zone, percent retention of first five fruiting branches and number of nodes per plant were evaluated. Yield data and small 7.25-kg samples were collected. Samples were ginned at Shafter to determine gin turnout and lint percent. Fiber samples were sent to die Textile Research Center in Texas for HVI quality analysis. Standard grower practices were implemented to manage the fields with the exception of not applying Mepiquat chloride growth regulator at the West Side location. Mepiquat chloride was applied at the Shafter site. Aldicarb was applied as a sidedress to control lygus, mites, and aphids. Glyphosate was applied as a harvest aid in 1997 at the West Side Research & Extension Center to control regrowth at 8 NACB and Tributyl phosphorotrithioate + Ethephon as a defoliant on individual treatments as they matured. High lygus counts (>7) affected early squaring in 1996 at the West Side causing low fruit retention in all treatments. The field experiments were again set up in 1999, 2000 and 2001 at two locations in the San Joaquin Valley of California (CA): West Side site (clay loam soil, western Fresno County, CA) high soil water holding capacity soil with deep rooting possible, good fertility. Shafter site (sandy loam soil, northern Kern County, CA) low to moderate soil water holding capacity soil with slow infiltration after mid-season, tendency for compaction problems. Experiment variables were: planting date (early to mid-april versus early May plantings), planting density (100,000 versus 185,000 plants/ha), varieties (1 Acala and 2 non-acala Upland varieties), two growth regulator treatments (standard University of CA guidelines versus approach that gives guidelines for more within-season applications). Details of treatments are shown in Table 1. A split plot experimental design was used, with three field replications. Final plant mapping was done on 15 plants per treatment, and all plots were machine-harvested, ginned at our research gin, and sampled for fiber quality HVI analyses.
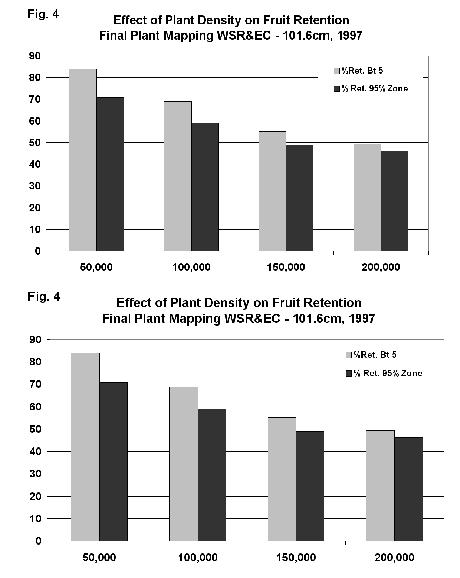
3 Treatment descriptions in Upland cotton management studies ( ) List of Treatments Used Nucotton-33B Varieties Maxxa GC-204 & GC varieties used Planting Date (CPCSD, Approved Acala, high fiber quality, full-season growth habit) Early to mid-april (Delta Pine, non-acala Upland, mid- to full-season variety) Early to mid-may (Germains, non-acala Upland, early to mid-season) 2 dates used Plant Density 40,000 plants/ac 75,000 plants/ac 2 densities used Growth Regul. Management Univ. CA mgmt. guidelines (based on fruit retention, vigor at 1st flower) Maximum internode distance method used (length of 4th-5th main stem internode measured for decisions at about 10 nodes, 15 nodes, nodes) 2 approaches Large scale studies were conducted in 2002 and 2003 to compare different plant densities in single row 76.2-cm cotton near Visalia, California. Acala cotton variety Phytogen 72 was planted on April 12, 2002 and on April 8 in The plot size for both years was 15.2 meter by meters, replicated four times. The studies were harvested on October 17 and 18 in 2002 and November 17 in The studies had six plant populations. For 2002, the single row had 116,000, 185,000, and 205,000 plants per hectare. The single row had 74,000, 106,000, 146,000, and 198,000 plants per hectare. In 2002, the trial received two applications of mepiquat chloride at 9 nodes and 13 nodes. Treatments were split with half of the treatment receiving the standard rate as determined by plant based measurements and the other half receiving a higher rate. In 2003, the trial received one application of mepiquat chloride at 9 nodes. By adding mepiquat chloride the 20 row plots were split into 10 row plots. In 2002, the first 10 rows of the 20 row plot received liters of mepiquat chloride at 9 nodes and the last 10 rows received liters at 9 nodes. Then at 13 nodes the first 10 rows received liters of mepiquat chloride and the last 10 rows received liters of mepiquat chloride. In 2003, the different plant population treatments were split with the first 10 rows received liters of mepiquat chloride and the last 10 rows received liters of mepiquat chloride. Results and Discussion cm Results from There was a clear advantage of not planting after April 15 on both the 76.2 and cm sites and not increasing plant populations above 100,000 plants per hectare on the cm sites. Higher plant populations, > 100,000, increased management, increased plant height, lowered retention and lowered lint yield. At Westside the 50,000 and 100,000 plants per hectare gave significantly higher yields than 150,000 or 200,000. Numerically 50,000 plants uniformly spaced gave the highest yield at Westside in both years (Fig. 1, 3, 4). At Shafter there was not a significant yield difference between plant populations, however numerically 100,000 plant per hectare gave the highest yields in both years (Fig. 2).
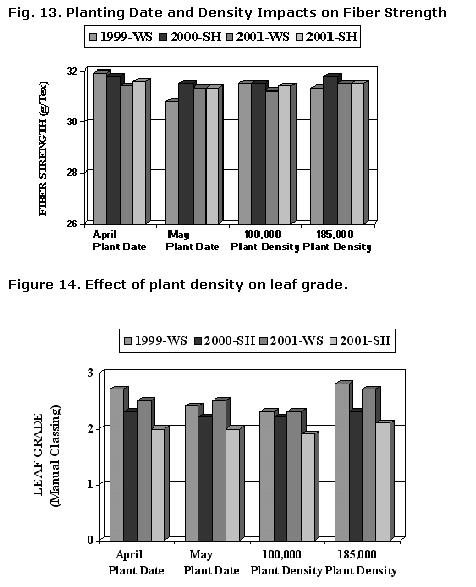
4 101.6 cm Results from Plant mapping measurements were made to assist in explaining the influence of management variables (planting date, density, variety choice, and growth regulator management) on crop yield responses. Figures 5 and 6 illustrate some of the general responses averaged across all three varieties. Key findings include: Later planting dates (May versus April) resulted in taller plants, with fewer fruiting branches and reduced bolls per plant (later plantings develop during warmer weather but have less total developmental time. Higher plant populations tend to produce taller plants with fewer total bolls and fruiting branches (more competition between plants for limited resources. The earliestmaturing variety was the short-season Upland GC-204/251, followed by Nucotton-33B. Maxxa was the latest-maturing. Total fruiting branch number was proportional to earliness, but average number of bolls/plant was much higher on both of the smaller-boll size non- Acala Uplands. Variations between varieties were seen in the degree of planting date and density effects on lint yield. Benefits of the earlier (April) planting dates over early May planting dates were quite consistent, and were observed most years in both sites and with all three varieties. Situations where yield improvements with the earlier (April) planting date were numerically greatest were: 1) with longer season varieties such as Maxxa and Nucotton-33B; 2) when fall weather conditions were cooler; and 3) under high yield conditions at the West Side site. Reductions in lint yield at the higher plant population (185,000 plants/ha) were generally greater in the Acala variety Maxxa than in either of the non-acala varieties. Plant population effects on lint yield were less consistent than those observed in prior University of CA studies, which were all done on an Acala variety, and generally showed peak yields at about 100,000 plants/ha with significant yield reductions at higher populations. In the non- Acala Uplands, higher populations tended to reduce yields mostly with earlier planting dates under high yield conditions. Higher populations gave similar or slightly better yields generally under lower vigor, lower yield conditions and with later planting dates (Figures 7,8,9) at the Westside site and (Figures 10,11,12) at the Shafter site. Total years/sites, but some generalizations are apparent. Later planting dates and higher density plantings both tended to significantly decrease fiber micronaire. Variety differences in average micronaire values were large, but patterns of influence of planting dates and densities were similar across varieties. Fiber strength was slightly higher in earlier planting dates, but plant populations did not have a consistent impact on strength (Figure 12). Measurements that provide some indication of leaf or trash were highly variable with variety and year, but were consistent in showing higher values with higher plant populations (Figure 13). Most other primary fiber quality parameters (length, uniformity, color grade, uniformity) were less affected by planting date or population than micronaire, strength or some measure of leaf or trash (Figure 14.) 76.2 cm Results In 2002, weed control was not a major problem in field due to past work. Black nightshade was treated with prythiobac sodium and annual morningglory was treated with prometryn. The grower wished he had used a glyphosate tolerant variety which would have made weed control easier.
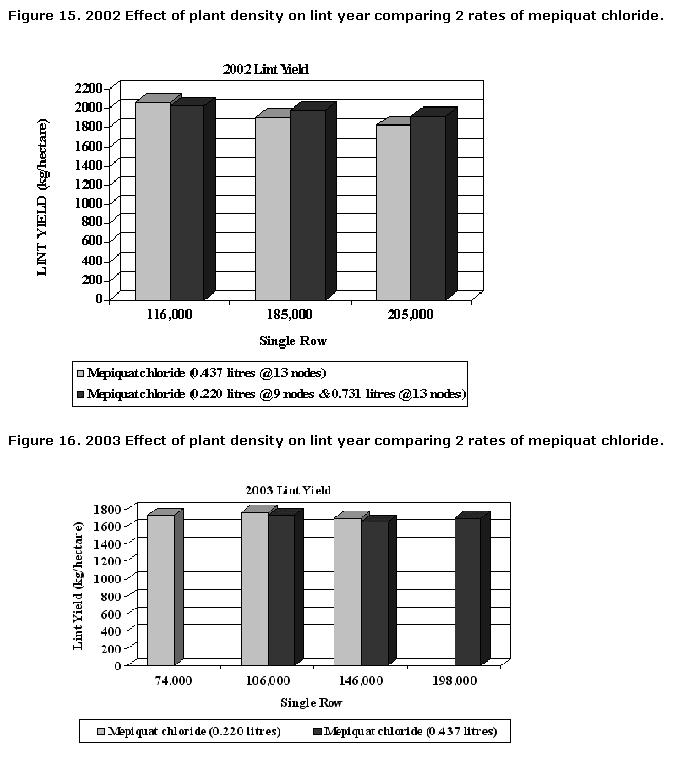
5 Single row densities of 185,000 or 205,000 plants per hectare significantly reduced yields (Fig.15). There were no significant differences between mepiquat chloride treatments. In 2003, there were not significant differences between single row 76.2-cm cotton with densities of 74,000 to 198,000 plants per hectare (Figure16). There were no significant differences between mepiquat chloride treatments (Fig.16). SUMMARY Both the 1996 and 1997 research indicate cotton planted around April 1st, receiving even marginal heat units in the five days following planting, and emerging at a uniform stand of 50,000 plants per hectare will yield in excess of 95% of the maximum yield. Cotton planted in studies from early to mid-april consistently out-yielded May plantings in both Acala & non-acala varieties. The higher plant population (185,000 plants/ha) reduced yields more consistently in the Acala than in the non-acala varieties. Under low yield conditions or with later planting dates, higher plant populations either had no effect or slightly increased yields, particularly with the non-acala varieties. Conversely fields with sizable areas with skips greater than 0.92 meters or populations below 40,500 plants per hectare could expect significant yield losses. Attention to good seedbed preparation, planting during favorable weather conditions, with proper seed rates, will increase the success of establishing a cotton crop. The main factors influencing yield potential when considering replanting are: average plant density, amount of skips, amount of chilling injury, seedling disease, weed pressure, and date of replanting. Replant decisions are difficult because one must also consider the loss in time and the additional replanting cost of approximately $123 per hectare. The unpredictability of weather conditions compounds this decision. These density studies indicate the date of planting to have the greatest effect on final yield. These studies conducted on Shafter and Westside Research Stations showed a % yield decline comparing an April 15 vs a May 1 planting. This was comparable to a 1 % yield decrease per day after April 15 in 1996 and a 1.5 to 2 % yield decrease per day in 1997.
6
7
8
9
10
11
12