How much milk can/should I produce profitably? Laurence Shalloo
|
|
|
- Candice McKinney
- 5 years ago
- Views:
Transcription
1 How much milk can/should I produce profitably? Laurence Shalloo Livestock Systems Research Department, Animal & Grassland Research and Innovation Centre, Teagasc, Moorepark
2 Overview Where do I want to go? What is the profitable expansion potential from my farm? Land Mobility and Career Progression

3 Background - Dairy Cow Numbers

4 Background - Replacement heifers
5 Planning for expansion Business Objectives? We need Financial to move away from the group think! Physical Personal Farm plan should be the centre of expansion! Will expansion increase your profitability? Effect on cash flow during expansion?
6 Overview Where do I want to go? What is the profitable expansion potential from my farm? Land Mobility and Career Progression
7 Optimum stocking rates Outputs form a whole range of studies combined into one single model 5 stocking rates evaluated (LU/Ha) 2 levels of concentrate supplementation (kg/cow) 3 levels of Nitrogen Fertiliser (kg/ha) 3 different levels of grass growth tdm/ha Full labour costs Capital costs associated with expansion included


8 Net Farm Profit 40Ha Farm Ha Farm 29.5 c/l 10.5 t 11.8 t 13 t grown LU 2.2 LU 2.5 LU 2.8 LU 3.1 LU Herbage Production 500 kg Conc 1000 kg ConC

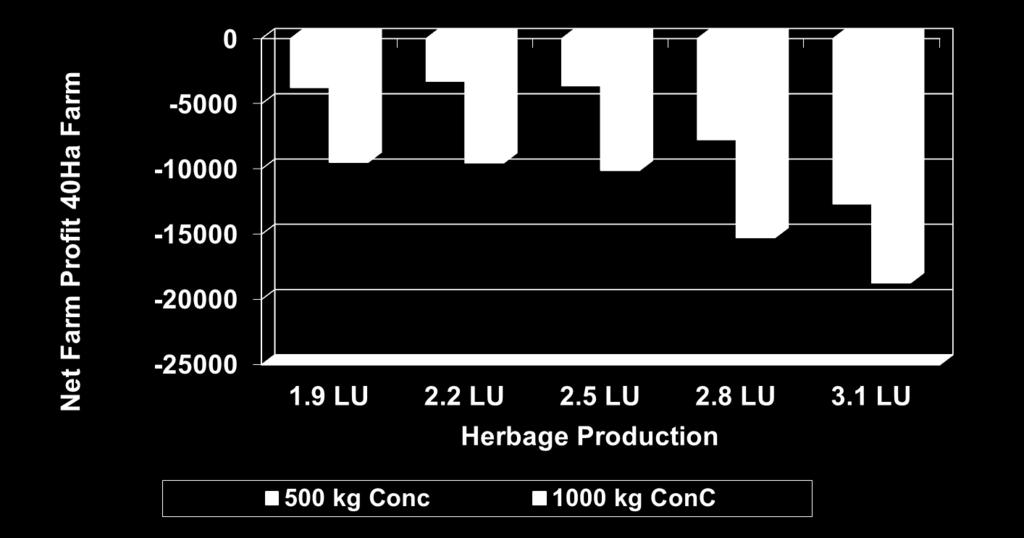
9 40Ha Farm 24.5 c/l

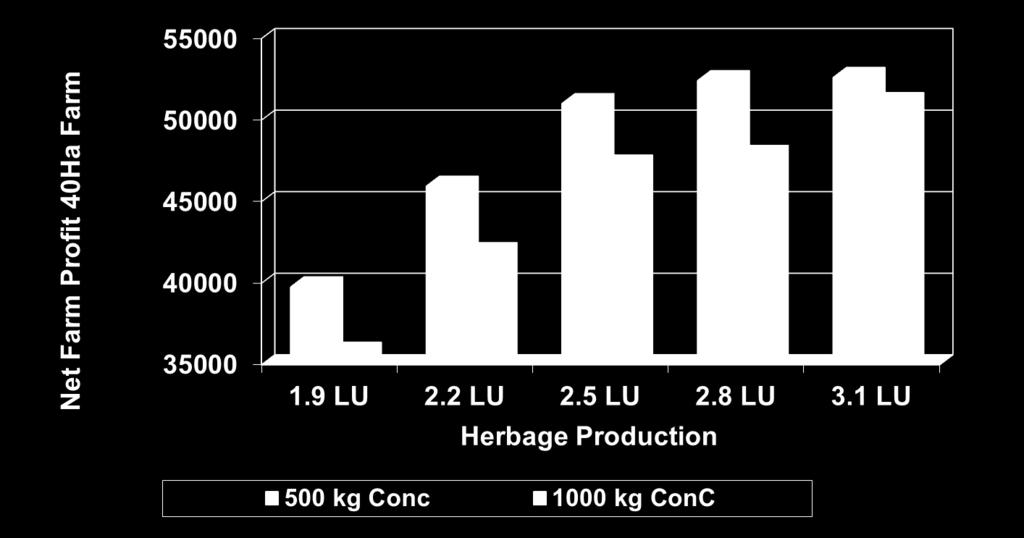
10 40 Ha Farm 34.5 c/l
11 Consistently Profitable Expansion will be associated with utilising more grass on farm Sustainable expansion at farm level will be associated with; Increasing Grass growth Increasing grass utilisation Maximising the conversion of grass grown to milk Minimising supplementary feed Minimising the capital investment with expansion
12 Farm Performance - Dairy (t DM/ha) 2013 Average Maximum Minimum Range Total Grass Production Grazing DM Production Silage DM Production Number of Grazings

13 11 National DM Production (t DM/ha) Cavan 12.5 Kildare 11.7 Clare 10.6 Limerick 13.4, 10.8 Kilkenny 9.9, 15.1 Kerry 14.9 Wexford 12.6 W Cork 15.0,14.8 Tipperary 14.2

14 Comparison of of grass 2013 growth versus profile versus grass growth 2014 to profile date t DM produced in 2014
15 Expansion Strategy Driven by the business Plan 1. Invest in technologies to increase grass growth Fertility Grazing infrastructure Sward renewal 2. Increase stocking rate on the milking platform to match grass growth 3. Move out any alternative enterprise from the milk platform 1. Outside block 2. Contract rearing 4. Increase the stocking rate on the milking platform with dairy cows only 5. Additional land options
16 Overview Where do I want to go? What is the profitable Warning! expansion potential from my Expansion Process will reduce efficiency farm? Land Mobility and career Progression

17 Expansion on productivity and efficiency Lag in return for investments made Reduction in animal productivity Increases in stock rearing costs Increase in costs associated with sward renewal, roadways, drainage, soil fertility Increases in the amount of hired labour
18 Lag in Return for investments There are significant investments made as part of the expansion process ( 3,000-6,000 per cow) Grazing infrastructure Winter housing and slurry storage Milking facilities Stock numbers growth generally lag behind the investments made
19 Reduction in animal productivity Increased proportions of younger animals as well as animals that would potentially have been culled Age Profile of herd Increased numbers of older animals that would ordinarily have been culled Increased SCC levels More animals walking longer distances resulting in reduced performance Farmers operating at higher stocking rates Increased stock rearing costs

20 Overview Where do I want to go? What is the profitable expansion potential from my farm? Land mobility and career progression
21 Family Farm Income/ha ( ) Subsidies as a % of FFI 1400 Family Farm Income Family Farm Income Dairying Cattle Rearing Sheep Tillage -200
22 Greenfield cost and return profile ** Total Costs 397, , , , ,073 Milk Output kg 83, , , , ,000 Costs /kgms Profitability ,433 45,323 90,283 90,632 ROI % ROE % ** Predicted

23 Land leasing Land Mobility Typical land leasing may not be adequate in the future; Risk sharing Profit sharing Capital investment Depreciation period Longer the better On-going investment Dependent on the numbers of years left in the plan Releasing the security available from the land Debt cant be secured against leased land Budgetary developments are huge

24 Partnerships Land Mobility Potential to increase scale by combining two different operations together Generally associated with milk quotas to date Potential improving the lifestyle of the different parties involved Early career progression for within family situations
25 Share farming Land Mobility & Career Progression Farm worker Learn skills in grass and stock Farm manager Responsibility for grass, cows, people Ireland No clear next step Dairy share farming New Zealand Share milking Own cows, run your own business

26 Career Progression Young trained farm business Managers will be cornerstone to dairy farm expansion Need a strong flow of business and technically skilled individuals Must create and demonstrate a career progression model; Shows a pathway to the ownership of dairy farm business Shows a pathway to wealth creation That competes with best professions when discussed at school with career guidance Dairy farming is not the afterthought Facilitates young people from non farming backgrounds to enter dairying That rewards efficiency at farm level

27 Share farming Model for Ireland Development of a model that allows a young trained farm business Farm Facility Type managers with no existing financial resources to grow equity, carry risk, capture the rewards, ultimately creating the potential for farming in their own right within a reasonable timeframe Potential benefits; Attract the right type of people into the dairy industry Creates a system that incentivises efficiency Increases the turnover of land Enterprise shift Farm business model
28 Conclusion Shackles are off on April 1 st Does not mean free for all No budget No expansion (Plan for extremes) Match feed supply and feed demand Invest in increasing farm pasture production (maximum return) Maximum efficiency and sustainability will be achieved where grass supply and demand are matched A combination of all land mobility and career progression models will be required; Create enterprise shift Increase industry profitability Create a career progression model for the next generation of the industry