Update on Iowa Farmland Market and China Ag Economy
|
|
|
- Adam Johns
- 5 years ago
- Views:
Transcription
1 Update on Iowa Farmland Market and China Ag Economy Wendong Zhang Assistant Professor of Economics and Extension Economist Farmland Owners Workshop, Altoona, Iowa Feb 16, 2018
2 A Quick Introduction: Dr. Wendong Zhang Grown up in a rural county in NE China Attended college in Shanghai and Hong Kong Ph.D. in Ag Econ in 2015 from Ohio State 2012 summer intern at USDA-ERS on farm economy and farmland values Research and extension interests: land value/ownership agriculture and the environment China Ag center

3

4


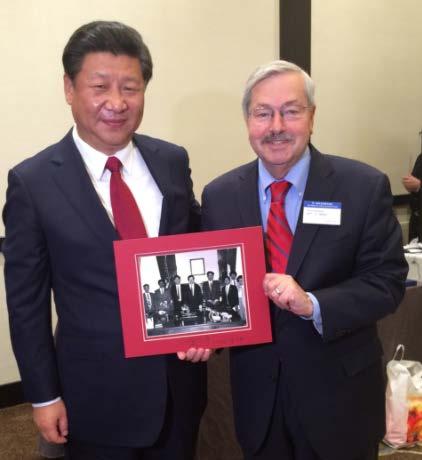
5 China enters New Era Chinese Dream Belt and Road Initiative Xi Jinping 2030? COE of China

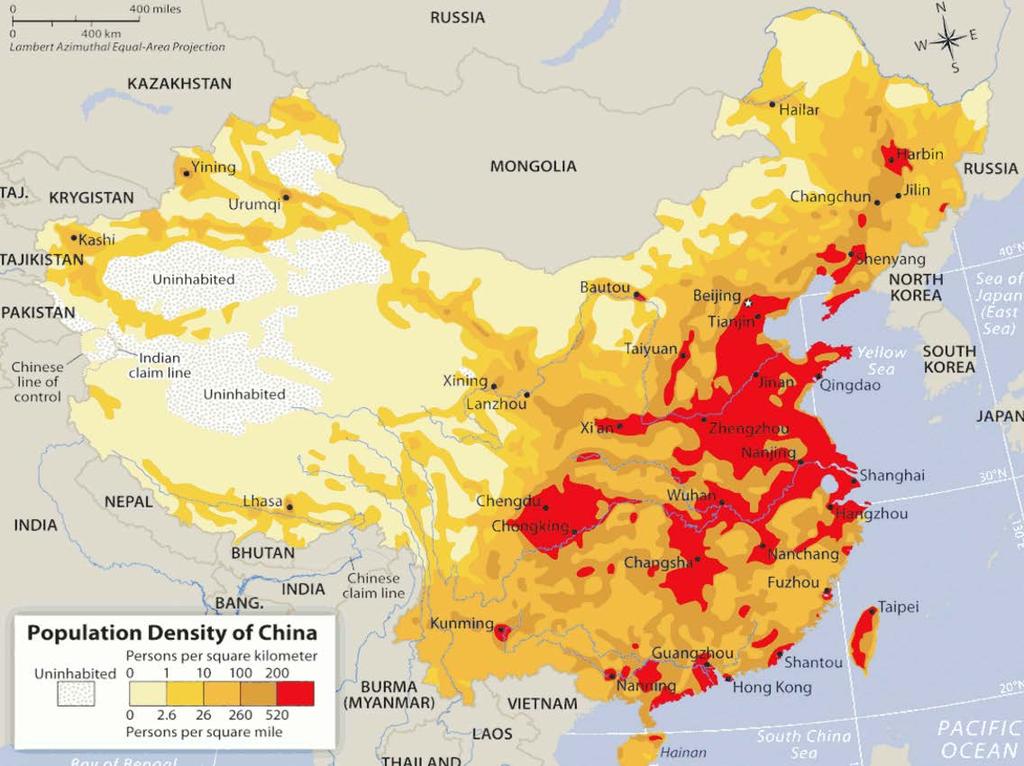
6 China s Provinces My Hometown

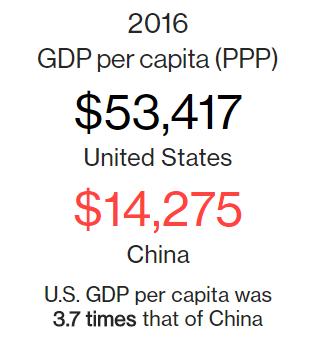
7 Mainland China vs. US
8


9 My hometown: Shenxian, Shandong Province Greenhouse plastic film - Shandong Province
10 China vs. US 61.8 million Zhang 2015 Ag Policy Review
 transferred; 2007: 5% Among them: 30% to coops or corps; 80% nongrain")
11 Chinese land is owned by collectives (Contract Right Certificate) China s New Rural Land Transfer Reform With at least one 30-year renewal 2016: 77 million acres (35% of cropland) transferred; 2007: 5% Among them: 30% to coops or corps; 80% nongrain production
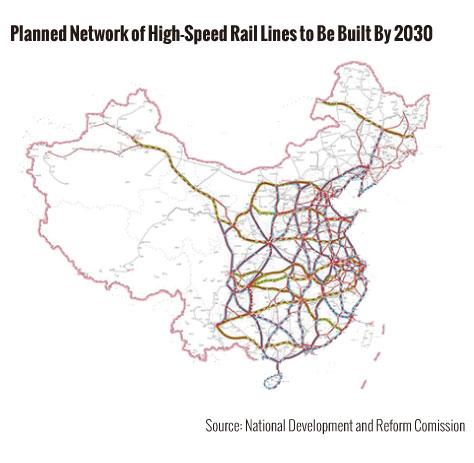
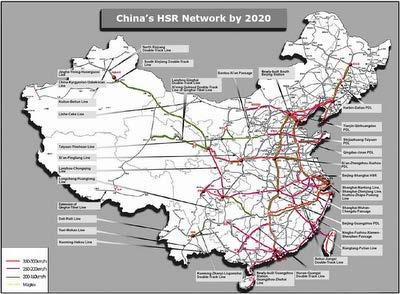
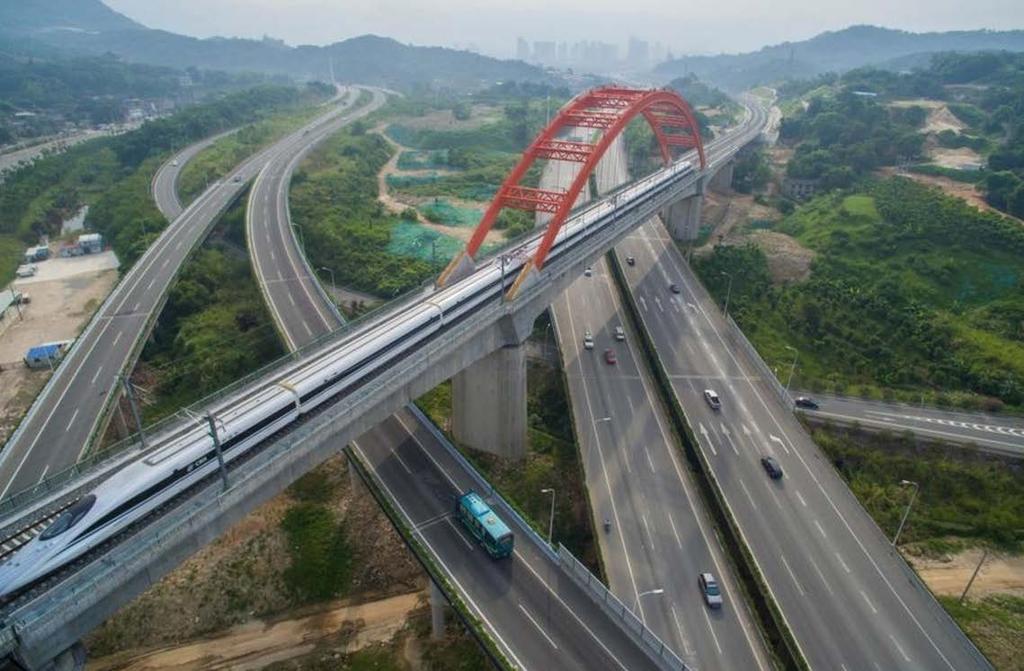
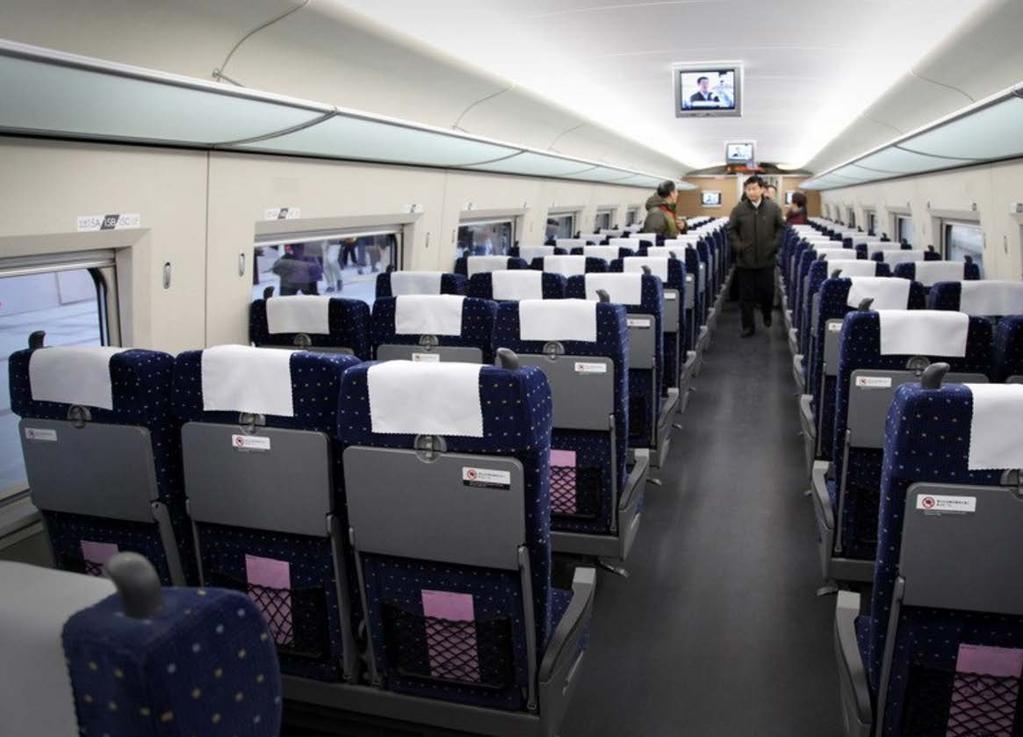
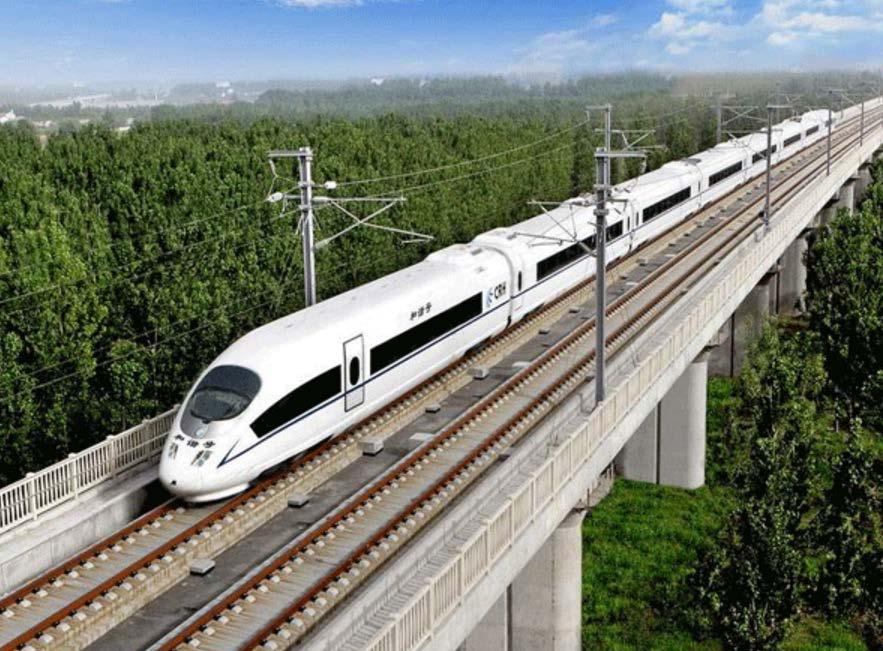
12 Future of High-Speed Rail in China

13

14

15

16 China s 2016 provincial GDP per capita as % of Iowa
 US: 90 mil.")
 China: 16 mil.")
: US: 88 mil.")
17 China Corn 2016 Area planted (Yield, Bu/acre) US: 90 mil. acres (48) Iowa: 10 mil. acres (56) China: 16 mil. acres (26) China Soybean 2016 Area planted (Yield, Bu/a): US: 88 mil. acres (154) Iowa: 14 mil. acres (188) China: 91 mil. acres (88)


18 China Pork 2016 Production US: 26 Bil. lbs Iowa: 1.2 Bil. lbs China: 15 Bil. lbs China Beef 2016 Production US: 25 Bil. lbs Iowa: 9 Bil. lbs China: 117 Bil. lbs

19 China Corn Yield 2015 Soybean Yield US: 48 Bu/acre Iowa: 56 Bu/acre China: 26 Bu/acre China Soybean Yield
20

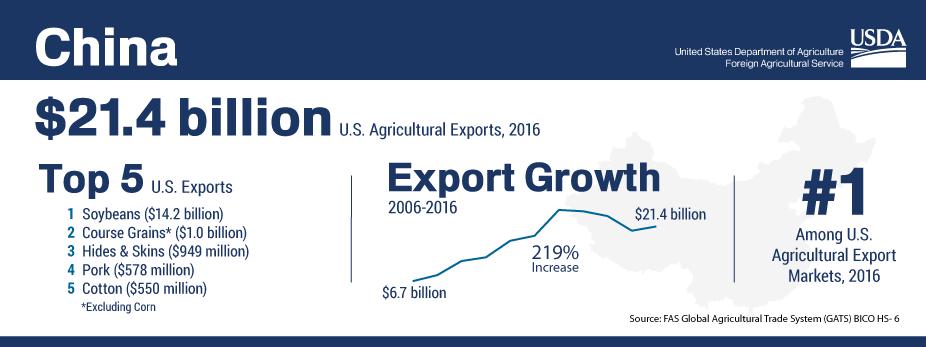
21 Share of China in US Ag Exports 12-15% 0% 5% 16% 15-18% 0% 75% 2% 62% 1%
22 China s Top Ag Imports Sources Commodity (2016 value of China ag imports) USA Brazil Europe Australia Argentina or Uruguay Soybean ($34.4 Bil.) 38% 47% A-10% Pork ($2.32 Bil.) 13% 50% Canada: 11% Ethanol ($0.38 Bil.) 70% 11% Pakistan 15% Beef ($2.42 Bil.) 0% 22% 28% U-21% Poultry ($1.11 Bil.) 79% A-9% Corn ($0.87 Bil.) 10% Ukraine: 79%
23 lbs per capita Meat Consumption by Country 2016 Vietnam United States Sub-Saharan Africa Russia OECD Countries Mexico Korea Japan European Union Egypt China Canada BRICS countries Brazil Australia Argentina BEEF PORK POULTRY SHEEP Source: OECD

24 Belt and Road Initiative

25 Why Care About Farmland Market?
26 Guiding Framework Land Value = localized net income / universal interest rate
27 Market Value of Land Capitalization Formula PV = n (1 + i) t t= 0 For simplicity, you could think of land value as the present value of all future annual land rental payments a landowner could charge PV = R/i R

28 AVERAGE Iowa Land Values $10,000 $9,000 $8,000 $7,000 $6,000 $5,000 $4,000 $3,000 $2,000 $1,000 $- $7,326 As of Nov % all farmland Nominal land values Inflation adjusted land values
29 % Change in Nominal Iowa Farmland Values % 30.0% Annual Percentage Change (%) 20.0% 10.0% 0.0% -10.0% -20.0% -30.0% -40.0%
30 The temporary break in continued declines results from limited land supply Sale Activity Index = % Reported More Sales - % Reported Less Sales % 30.0% 20.0% % 0.0% -10.0% -20.0% Percent_Change Index


31 Iowa Federal Reserve Bank of Chicago, July 2017 Ag Letter Realtor Land Institute


32 USDA NASS June Area Survey November 2016 to November 2017 Ag Real Estate Values: + 2.3% Cropland Values: No change Pasture Values: +1.5% USDA June Area Survey, August 2017

33 However, don t rush to conclud e a turn of the farmland market Federal Reserve Bank of Kansas City kcfed Ag Credit Survey
34 % Change in Inflation-adjusted Iowa Farmland Values (decrease 0.2%) 40.0% 30.0% 20.0% 10.0% 0.0% -10.0% -20.0% -30.0% -40.0%


35 Indiana and Illinois both show declines Purdue University Illinois Chapter of American Society of Farm Managers and Rural Appraisers
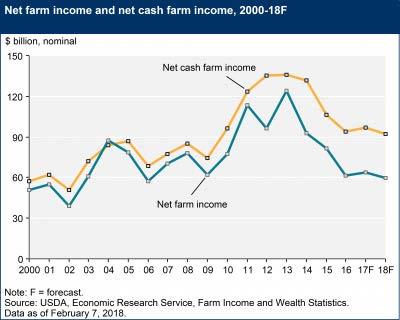
36 US Farm Income Source: USDA OCE 2016
37
38 Long-term interest rate expectations What the Fed Reserve thinks the interest rate should be December 2017
39 Land Values by District and Quality, Nov 2017 District Average Value % Change High Quality % Change Medium Quality % Change Low Quality % Change Northwest $9, % $10, % $8, % $6, % North Central $7, % $8, % $7, % $5, % Northeast $7, % $9, % $7, % $4, % West Central $7, % $8, % $6, % $4, % Central $8, % $9, % $7, % $4, % East Central $8, % $9, % $7, % $5, % Southwest $6, % $7, % $5, % $3, % South Central $4, % $5, % $4, % $2, % Southeast $6, % $9, % $6, % $3, % Iowa Avg. $7, % $8, % $6, % $4, %
40 Livestock and Crop Inventory by Crop Reporting District Livestock Inventory Acres 2012 Harvested Acres 2017 District Chickens, Layers Hogs Milk Cows Cattle Pasture Timber Corn Soybean Northwest 30% 26% 29% 22% 7% 2% 15% 16% North Central 64% 16% 4% 6% 4% 4% 14% 13% Northeast 1% 12% 51% 16% 11% 23% 12% 8% West Central 0% 13% 1% 13% 10% 7% 15% 16% Central 3% 13% 1% 7% 8% 8% 15% 14% East Central 1% 5% 10% 11% 11% 14% 11% 10% Southwest 0% 2% 0% 9% 12% 5% 8% 10% South Central 0% 2% 1% 9% 25% 19% 4% 6% Southeast 1% 11% 3% 6% 12% 19% 7% 8% Iowa Total 52.2 million 20.4 million 0.17 million 3.8 million 2.5 million 1.2 million 12.9 million 10.0 million USDA NASS, Ag Census


41 Stronger than expected crop yields Corn Yield: November 1, 2017 Bushels per Acre Soybean Yield: November 1, 2017 Bushels per Acre State Average: bu/acre State Average: 56.0 bu/acre USDA NASS QuickStats


42 Below: % Reduction in CRP Rental Rate 2017 vs Above: Acres enrolled in CRP, 2017 Source: USDA NRCS; USDA FSA

43 Land Values by County, Nov 2017

44 CSR2 Corn Suitability Rating Source: ISU Agronomy

45 Iowa Major Soil Association Source: USDA NRCS


46 Percent Changes in Land Values from Nov 2016

47 Iowa Farmland Purchases by Buyer Types Percent Existing Farmers Investors New Farmers Other
48 Iowa Farmland Purchases by Seller Types, 2017 Active Farmers Estate Sales Investors Other Retired Farmers PERCENT Northwest North Central Northeast West Central Central East Central Southwest South Central Southeast STATE
49 Cash Crop Price Predictions for Nov 2017, 2018, 2020 as of May 2017 Soil Management Land Valuation Conference May 16, 2018 Wednesday, Scheman Bldg Cash Corn Prices Cash Soybean Prices Northwest $ 3.34 $ 3.65 $ 3.98 $ 9.25 $ 9.61 $ North Central $ 3.42 $ 3.59 $ 3.93 $ 9.16 $ 9.46 $ Northeast $ 3.41 $ 3.59 $ 3.95 $ 9.19 $ 9.28 $ 9.76 West Central $ 3.34 $ 3.59 $ 4.02 $ 9.12 $ 9.33 $ Central $ 3.36 $ 3.50 $ 3.77 $ 9.17 $ 9.40 $ 9.86 East Central $ 3.42 $ 3.58 $ 3.89 $ 9.26 $ 9.51 $ Southwest $ 3.31 $ 3.56 $ 3.94 $ 9.15 $ 9.42 $ South Central $ 3.36 $ 3.59 $ 3.90 $ 9.51 $ 9.76 $ Southeast $ 3.50 $ 3.83 $ 4.17 $ 9.49 $ 9.59 $ STATE $ 3.38 $ 3.60 $ 3.94 $ 9.24 $ 9.48 $ 10.06

50 Source: Purdue Ag Barometer

51 Inflation-adjusted Iowa Ag Real Estate Values Farm Crises and this downturn Source: USDA-NASS; Ag Census, Iowa Farmland Value Portal
52 Positive 1: Real Income Accumulation Source: Zhang and Tidgren 2017

53 Iowa Landowners tend to hold the farmland; and many don t have debt Years Owned % of Iowa Farmland <10 years 24% Years 21% Years 19% Years 15% > 40 Years 20% Source: Ag DM PM1980, 2012 Iowa Farmland Ownership and Tenure Survey
54 Positive 2: Historically low interest rates Source: 10-year-treasury-rate
55 Positive 3: Prudence in Ag Lenders/Regulators Banking Regulations More stringent, frequent stress-test BASEL III, liquidity requirements for banks (Ron Hansen Iowa Division of Banking Superintendent) walk into this with eyes wide open Cash-Flow Based Loan Practice Before 1987: loan to value ratio is 85% : loan to value ratio is 65% After 2008: use cash-flow method for collateral ($4 corn, $10 bean) and 50% of cash flow value Source: Zhang and Tidgren 2017
56 Cash Rent or Mortgage Payments ($/acre) Annual Mortgage Payments vs. Cash Rents for Iowa Farmland Loan Cash Rent 20-yr PMT 30-yr PMT 15-yr PMT Source: Zhang and Tidgren 2017
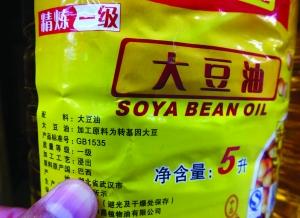
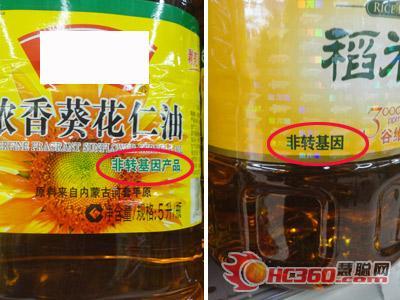
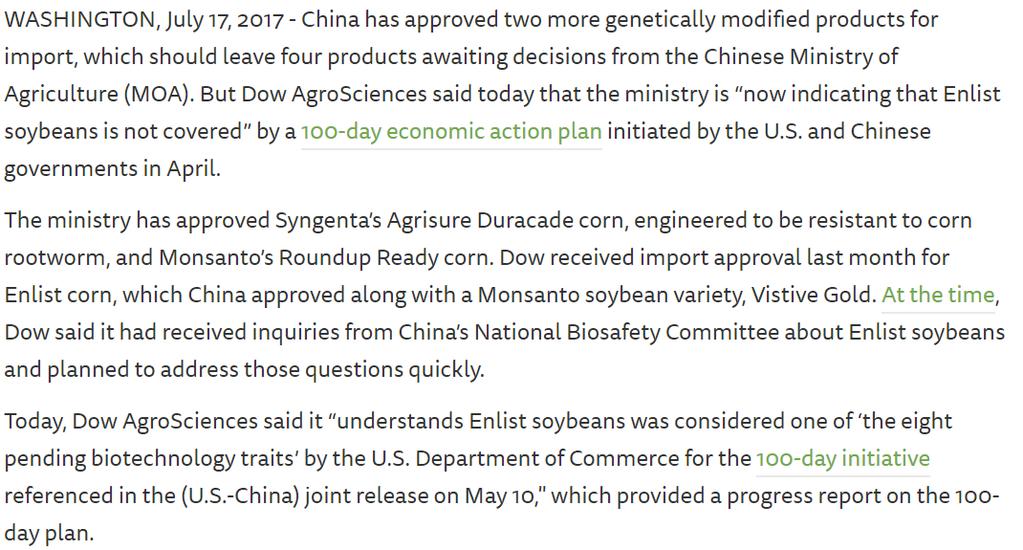
57 GMO in China: Controversy/Divide
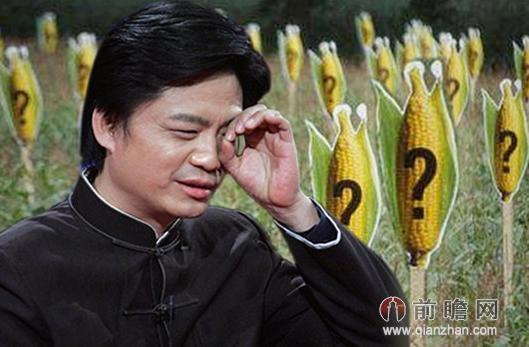
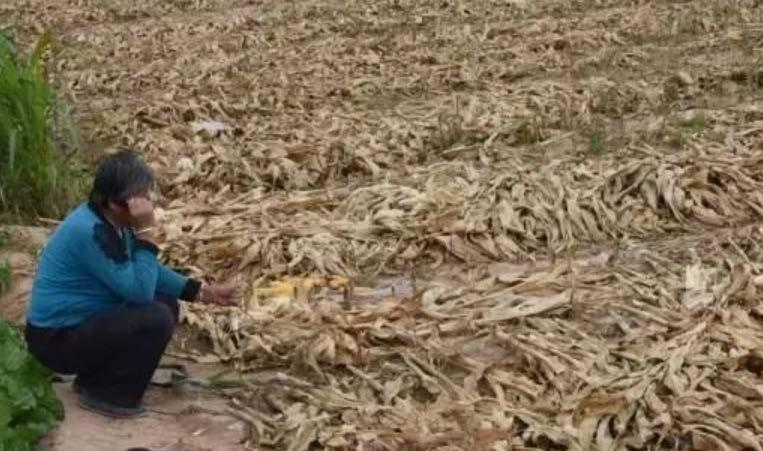
58 GMO in China: Controversy/Divide Yongyuan Cui Larry King in China; Key opponent voice of GMO GMO corn illegal
59


60

61

62 January 2017
63


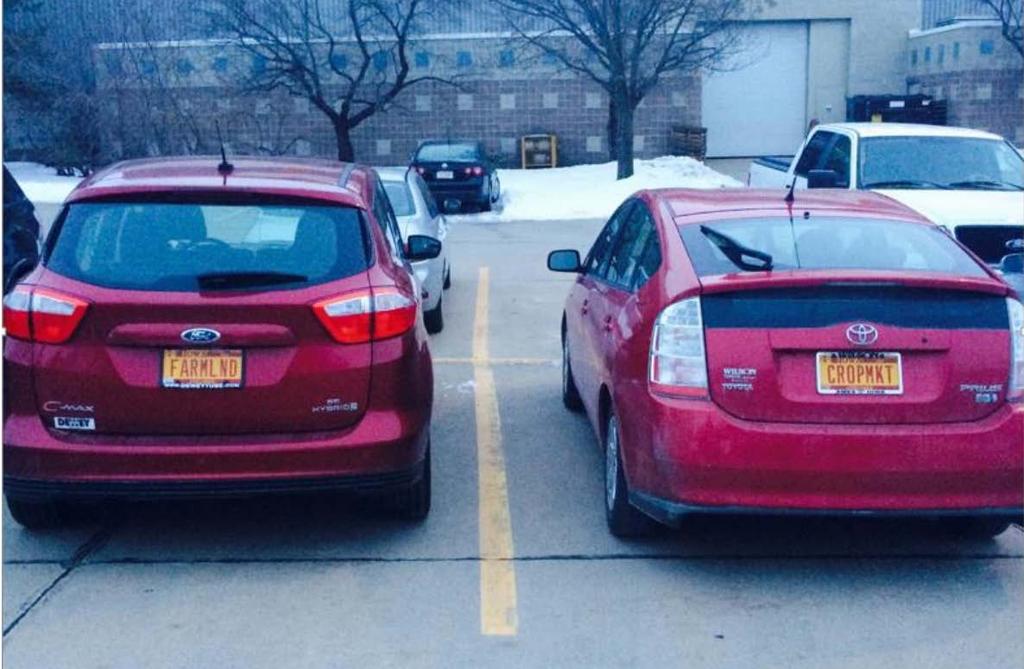
64 Farmland Acres Owned by Chinese Owners as of 2016
65
66 2017 Iowa Farmland Ownership and Tenure Survey First land ownership survey in the nation: 1949 Only one conducted at frequent intervals: 1949, 1958, 1970, 1976, 1982, 1992, 1997, 2002, 2007, and Next one in 2017 Results released spring 2018
67 Documentaries about China China: Time of Xi - One Belt One Road A Bite of China Chinese cuisine/culture _Ntgs&list=PLYOTfstAG_IPjyEeT472GEJzafYmBiA3w Bird s Eye China aerial China by province The world s future MegaProjects ( ) Wild China BBC (2008) Chinese New Year: The Biggest Celebration on Earth (2016) BBC China s MegaProjects available in Chinese only


68 Iowa Farmland Value Portal #ISUlandvalue 2% increase since Nov
69
70 Thank You! Wendong Zhang Assistant Professor and Extension Economist 478C Heady Hall Iowa State University