Understanding and Utilizing EPDs to Select Bulls
|
|
|
- Ashlee Hamilton
- 5 years ago
- Views:
Transcription


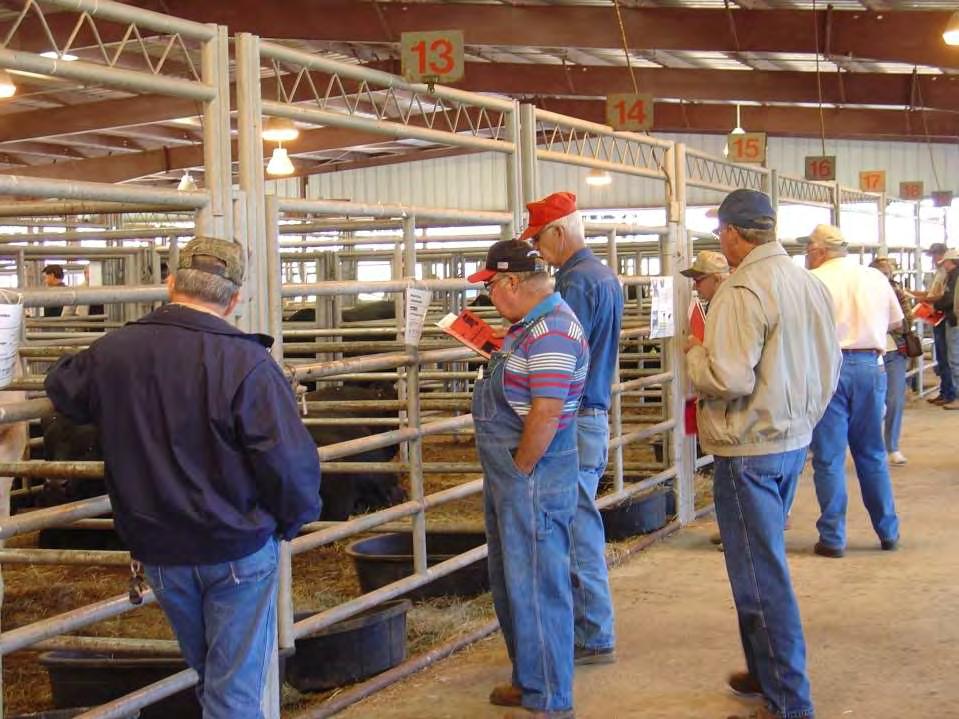
1 Understanding and Utilizing EPDs to Select Bulls 57 th Annual Florida Beef Cattle Short Course May 1, 2008 Gainesville, FL Jane Parish Extension Beef Cattle Specialist


2
3 Factors Mississippi Beef Operations Consider When Purchasing a Bull Appearance Breed Price Disposition <100 head >150 head Seller Reputation EPDs Other Percent Sources: Lacy et al MSU-ES Bulletin Little et al MSU-ES Bulletin 1128.
4
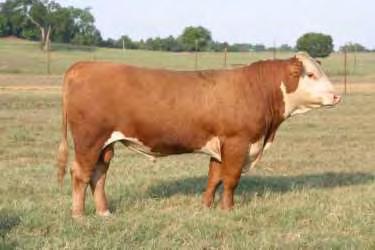
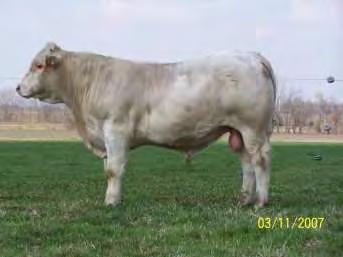
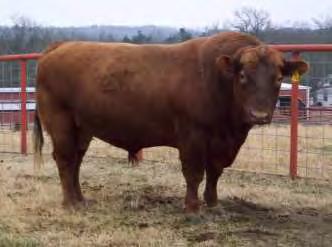
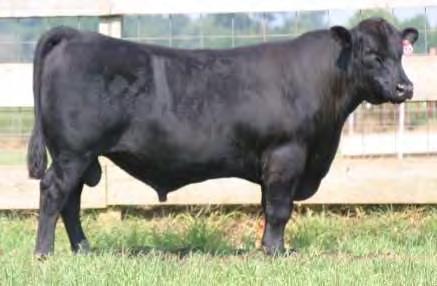
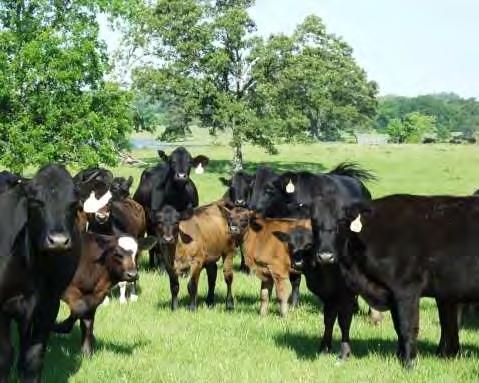
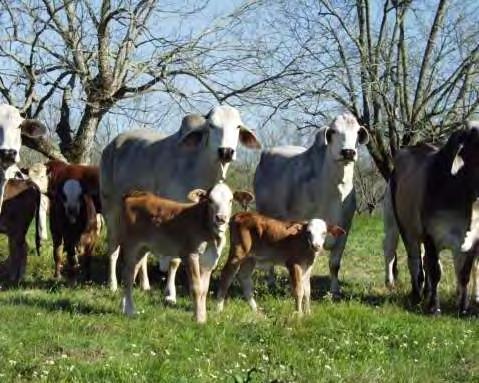
5 BULL COW
 to find a bull")


6 Bull Selection Tough (near impossible) to find a bull that is superior for every trait Acceptable combination of traits Complement the cow herd Match the market
7

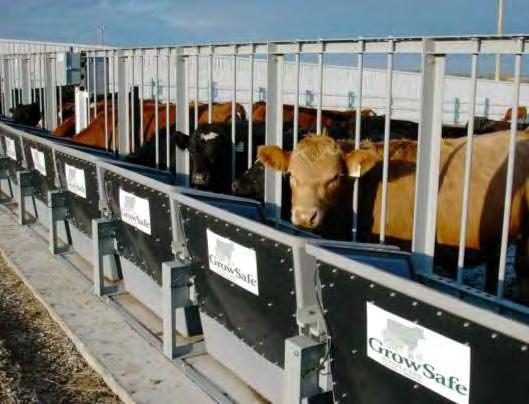
8 How much information do I need? Visual appraisal Recent BSE results Herd health program Performance test information Pedigree EPDs The more you know, the fewer surprises later on

9 Expected Progeny Differences Genetic selection tool The difference in performance that you expect in the calves from one animal when compared to calves from another animal or group of animals Active sires Active dams Non-parent cattle

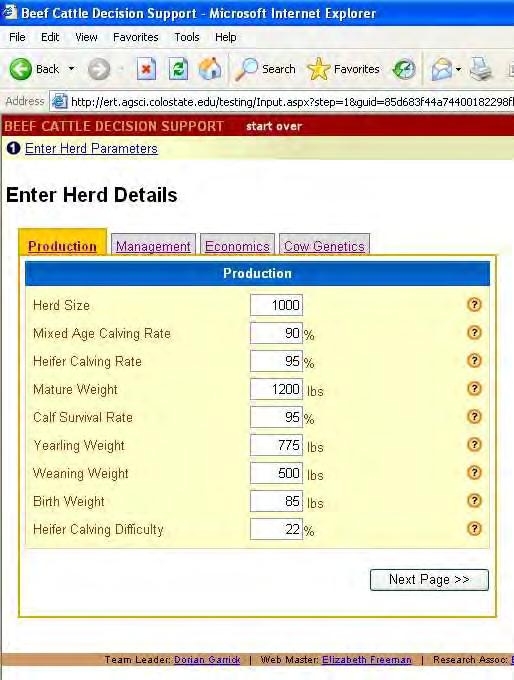
10 Expected Progeny Differences Primarily generated by breed associations Animals with EPDs are usually registered Relevance to commercial herds Sire selection Facilitate sorting and ranking of cattle


11 Think EPDs are too complicated to use in your herd? RELAX!!!


12 Expected Progeny Differences Weaning Weight Bull A +40 Bull B +30 Calves from Bull A are expected to average 10 pounds more at weaning 10

13 Expected Progeny Differences Weaning Weight Bull A +40 Bull B Breed Average
14 How does my bull stack up? Rank Within a Breed Percentile Ranking BW EPD WW EPD YW EPD Milk EPD Breed Average Spring 2008 Non-parent Charolais
15 CHB Index BII Index Expected Progeny Difference/ Selection Index CEZ Index BMI Index Intramuscular Fat Ribeye Area Fat Scrotal Circumference Calving Ease Maternal Milk and Growth Milk Yearling Weight Weaning Weight Birth Weight Calving Ease Direct Lower Performance < Percentile Rank > Higher performance
16 CHB Index BII Index Expected Progeny Difference/ Selection Index CEZ Index BMI Index Intramuscular Fat Ribeye Area Fat Scrotal Circumference Calving Ease Maternal Milk and Growth Milk Yearling Weight Weaning Weight Birth Weight Calving Ease Direct Lower Performance < Percentile Rank > Higher performance

17 Performance Tradeoffs Avoid single trait selection!!! Growth vs. calving ease Selection for high weaning and yearling weights only Increased calving problems Larger cows that require more feed Red meat yield vs. red meat quality Fertility/reproduction vs. growth rate/lean yield Milk yield vs. cow maintenance requirement
18 Expected Progeny Differences Birth Weight Bull A +5 Bull B Breed Average

19 Calving Ease Score Description 1 No assistance, calf born normally 2 Assisted, easy 3 Assisted, very difficult 4 Caesarean delivery 5 Breech birth, abnormal presentation
20 Selecting the "Right" Sire BW WW YW Milk Bull EPD EPD EPD EPD A B C Breed Average Breed Averages for Spring 2008 Active Angus Sires

21 Cow Herd #1 Stockers calves and markets at 750 lbs. Needs bull to breed to mature cows Plenty of labor available
22 Selecting the "Right" Sire BW WW YW Milk Bull EPD EPD EPD EPD A B C Breed Average Breed Averages for Spring 2008 Active Angus Sires


23 Cow Herd #2 Retains ownership of calves through feedlot Needs bull to breed to replacement heifers Limited labor available
24 Selecting the "Right" Sire BW WW YW Milk Bull EPD EPD EPD EPD A B C Breed Average Breed Averages for Spring 2008 Active Angus Sires


25 Cow Herd #3 Markets calves after weaning Replacement heifers will be kept from calf crop Needs bull to breed to mature cows and heifers
26 Selecting the "Right" Sire BW WW YW Milk Bull EPD EPD EPD EPD A B C Breed Average Breed Averages for Spring 2008 Active Angus Sires


27

28 EPD Myth Myth: Breed average EPD always = 0 Fact: Breed average based on performance in a base year Weaning Weight EPD, pounds Source: North American Limousin Foundation Year


29 EPD Myth Myth: Milk EPD is expressed as pounds of milk produced Fact: Milk EPD is expressed as pounds of calf at weaning due to dam s milk production


30 EPD Myth Myth: EPDs from one breed can be compared to EPDs from another breed without adjustment Fact: Adjustment factors must be used to compare EPDs across breeds
31 Accuracy (ACC) Mississippi Agricultural and Forestry Experiment Station 25 MSU Midland S158 ANGUS Calved 8/29/2006 Tattoo # S158 Reg. # Twin Valley Precision E161 BR Midland BR Royal Lass GDAR SVF Traveler 234D M S U Formera Finks Formera BW Adj. WW WW Ratio Adj. YW YW Ratio Adj. IMF IMF Ratio Adj. REA REA Ratio CED BW WW YW YH SC CEM Milk MW MH $EN EPD I +25 I ACC Cwt Mrb RE Fat %IMF RE Fat $W $F $G $QG $YG $B EPD I +2 I +.25 I +.35 I ACC

32 Accuracy (ACC) Amount of confidence in an EPD Reliability of an EPD depends upon the information that went into calculating it EPDs will change over time as more information is collected on an animal
33 Accuracy (ACC) Total number of calves sired by a bull More information on that bull s genetics Greater EPD accuracy
34 Accuracy (ACC) Two bulls have a yearling weight EPD of +15 but have different accuracy values. Bull A ACC = pounds +10 to +20 pounds Bull B ACC = pounds -3 to +33 pounds
35 120 Proven Sire (Accuracy Values = 0.97) Reported EPD High (EPD + Possible Change Value) Low (EPD - Possible Change Value) Birth Weight Weaning Weight Yearling Weight Milk Unproven Sire (Accuracy Values = 0.05) Reported EPD High (EPD + Possible Change Value) Low (EPD - Possible Change Value) 0-20 Birth Weight Weaning Weight Yearling Weight Milk
36
37 EPDs Available by Breed Expected Progeny Difference (EPD) Breed Production Maternal Carcass CE BW WW YW YH SC DOC CEM MILK MG MW MH ME ST HPG GL CWT IMF REA FAT YG RP TEND Angus Beefmaster Brahman Brangus Braunvieh Charolais Chianina Gelbvieh Hereford Limousin Maine-Anjou Red Angus Salers Santa Gertrudis Shorthorn Simmental South Devon Tarentaise


38 Birth weight Calving ease direct Calving ease maternal Milk Maternal weaning weight Weaning weight Yearling weight Mature weight Mature height Ultrasound REA Ultrasound IMF Ultrasound FT Carcass weight Ribeye area Marbling Fat thickness Percent retail product Maintenance energy Docility Stayability Gestation length Heifer pregnancy Scrotal circumference Feedlot value Grid value Beef value Feed efficiency* Pinkeye*
39
40
41 50 Yearling Weight Expected Progeny Difference Breed Average Oldest (2000 born cows) Age of Herd Female Youngest (2007 born heifers)

42
43 Selection Indices Available Breed Selection Index Abbreviation Angus Weaned Calf Value $W Feedlot Value $F Grid Value $G Quality Grade $QG Yield Grade $YG Beef Value $B Charolais Terminal Sire Profitability Index 1 Gelbvieh Feedlot Merit FM Carcass Value CV Hereford Baldy Maternal Index BMI$ Calving EZ Index CEZ$ Brahman Influence Index BII$ Certified Hereford Beef Index CHB$ Limousin Mainstream Terminal Index $MTI Simmental All-Purpose Index API Terminal Index TI 1 Allows operation-specific production and economic input values for calculating the index.
44

45

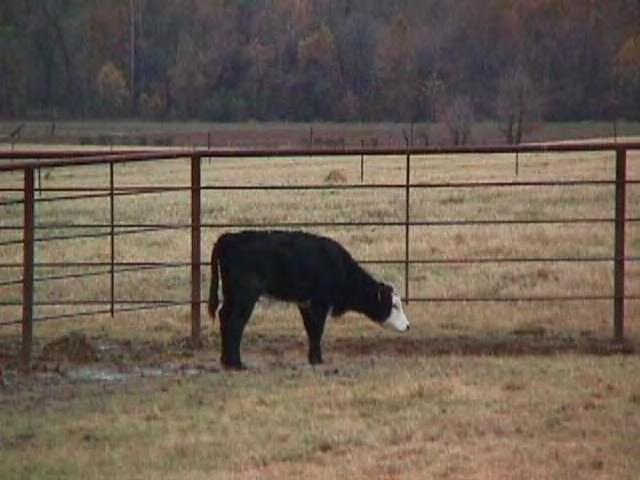
46 Watch the herd closely Even the best genetics will not be passed on unless the bull does his job

47 Keep the Pocket Knife Sharp Not all genetics should be passed on

48 EPD Summary Excellent tool for sorting and ranking cattle Breeders can assist in use and interpretation Important to use current information Must be prepared to decide among tradeoffs

49 Questions?