Climate Smart Agriculture in Pakistan
|
|
|
- Jane Stevens
- 5 years ago
- Views:
Transcription


1 Climate Smart Agriculture in Pakistan Current status and Future challenges Dr. Tasneem Khaliq Assistant Professor Agro-Climatology Lab., Department of Agronomy University of Agriculture Faisalabad
2 Overview Introduction Agriculture Sector Key statistics Climate of Pakistan Major Crops grown in Pakistan Agricultural Problems in Pakistan Water Availability and Future Scenario Challenges/ Issues in Agriculture Available level of climate forecasts Use of climate forecast in Agriculture Case studies


3 Introduction Land area of Pakistan is 79.6 M ha Total area under cultivation 23.8 M ha Contributes 20% to GDP Employment opportunities for 45% of the country s labour force Majority of the rural population depends upon this sector for its livelihood
4 Agricultural Sector Key Statistics Contribution to GDP 21.4% Labor Force Employment 45.0% Average Growth during last 6 years 3.7% Contribution of different Sub-Sectors in Agriculture s GDP 1. Crops (Wheat, Rice, Cotton, S. cane) 32% 2. Livestock 55% 3. Fisheries 4.0% 4. Forestry 2.0% 5. Others 7.0% Share in Export Earnings (Raw/Processed) 1. Cotton + Cotton Based Products 64.7% 2. Fruits, Rice, Fish, Leather 18.2% 3. Others 17.1% (Govt. of Pakistan, 2016)

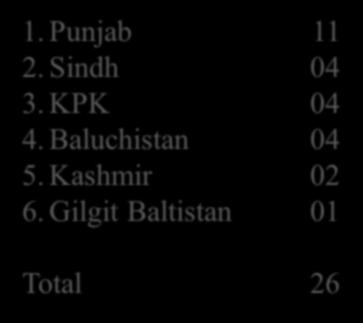


5 Agriculture universities in Pakistan 1. Punjab Sindh KPK Baluchistan Kashmir Gilgit Baltistan 01 Total 26

6 Organogram of Department of Agriculture

7 Climatic Classification of Pakistan u Arid, semi arid, sub humid and humid u 2/3 of the area of Pakistan lies under arid climate u Light brown and dark brown spots indicating aridity in the country

8 Climate of Pakistan Subtropical arid zone to semi-arid climate June is the hottest month (48 C) in the plains July in the mountainous areas, with temperatures over 38 C, The mean monthly minimum temp is only 4 C in December/January Average annual precipitation is estimated at 494 mm. Maximum rainfall is1500 mm in the north Most of the rainfall in Pakistan originates from summer monsoons
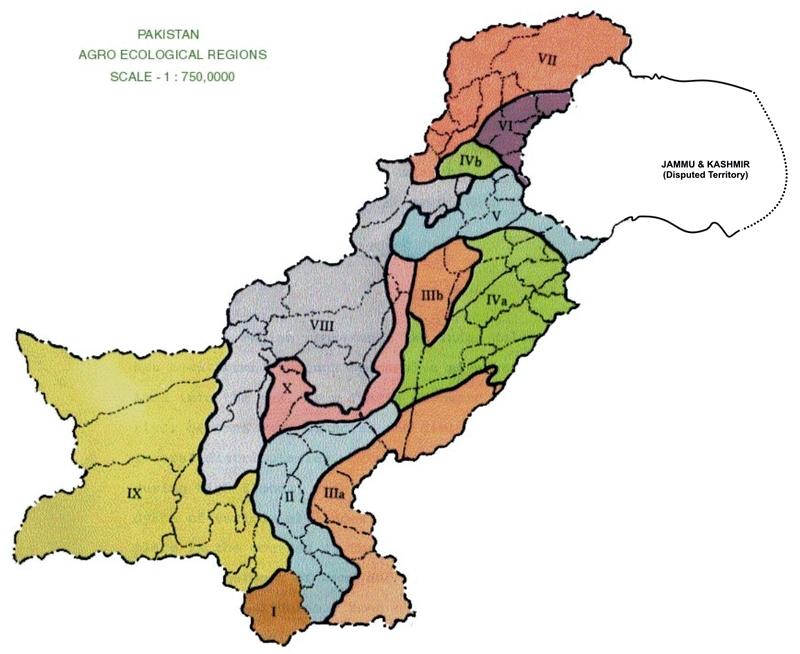
9 Agro-ecological Zones

10 Crop distribution in the country


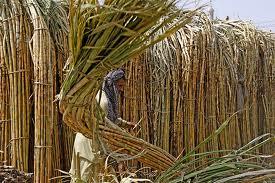

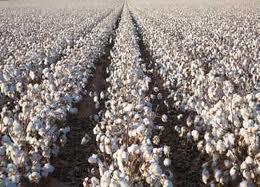
11 Major Crops Cotton Wheat Rice Sugarcane Maize


12 Importance major crops in Pakistan Crop Value addition Economy Agri. GDP Share Area Production Av. Yield (%) (%) M. Ha M. tons ton/ha Wheat Rice Cotton * 0.6 Sugarcane * Bales
13 Productivity Enhancement Crops Production (000 tons) Production (000 tons) Times increase wheat Rice Cotton in 000 bales Sugarcane Maize Potato Citrus ( ) Mango ( ) Guava ( )


14 Agricultural Problems in Pakistan A. TECHNO-ECONOMIC PROBLEMS Limited cultivable area Low yield per unit area Conventional methods of production Lack of high efficiency irrigation facilities Inadequate supply of agricultural inputs Decreasing availability of water Lack of R & D and Decision Support System for site specific production technology
, Mangla (5.")
15 Water Resources of Pakistan Rainfall Annual rainfall (125mm in South-East to 750mm North-West) Total water generated by rainfall is around 32 BCM Contribution to crops is 10-20% Groundwater Exploitation of Groundwater is 59 BCM Over 9,00,000 private tube wells 40% of total supply at farm-gate Surface Water Resources Total Inflow is 171 BCM Tarbela (10.38 BCM ft), Mangla (5.90 BCM ft) 48 Canals (61000 km), 19 Barrages 1,70,000 Watercourses (1.6 Million km)

16 Future Water Scenario Year Population Water availability (Million) per capita (m 3 )
 Occurrence of extreme weather events Drought Increasing Insect/pest")
17 Environmental Issues Global warming Climate change Continuous Floods (2010, 2012, 2013) Occurrence of extreme weather events Drought Increasing Insect/pest infestation
18 Current Level of Climate Forecast Availability Pakistan Meteorological Department (PMD) provide following services 1. Data recording, generation and dissemination services 2. Flood forecast and warning services. 3. Farmer's Weather Bulletin and Warning Services. 4. Numerical weather forecasting 5. Climate change scenarios for Pakistan (AR4, AR5) on resolution of 25km and 50km 6. Seasonal forecast 7. Drought monitoring and warning services 8. Crop reports 9. Seasonal out look Pakistan

19 Use of Weather/Climate Information in Agriculture
20 International PROJECTS 1.Assessing climatic vulnerability and projecting crop productivity using integrated crop and economic modeling techniques YEARS/ FUNDING AgMIP DFID STATUS/ AMOUNT Ongoing $ 2. International grant on Biochar production, awareness and commercialization to mitigate Climate Change British Council Completed $ 3. Climate Change Chair under Centre for Advance Studies-Food Security & Agriculture (CAS-FSA) 2013 USAID USDA Ongoing 28.8 million $
21 International PROJECTS YEARS/ FUNDING STATUS/ AMOUNT 4. Agriculture Information System 5. Global Earth Observation System of Systems/Asian Water Cycle Initiative Indus River Basin Research Activities Under the Framework of the GEOSS Asian Water Cycle Initiative 2012 USDA-FAO 2014 GEOSS AWCI Ongoing $ Starting
22 National PROJECTS YEARS/ FUNDING STATUS/ AMOUNT 1. Modeling the impact of climate change on wheat productivity in Punjab 2. Use of spectral reflectance to estimate growth, biomass and yield of different wheat cultivars, under moisture stress conditions HEC ALP Completed $ Completed $ 3. Optimization of Bt. Cotton production technology for different agro-ecological zones in the face of changing climate through simulation modeling. ALP Ongoing $
23 National PROJECTS YEARS/ FUNDING STATUS/ AMOUNT 4. Assessing climate risk and developing mitigation strategies for cotton productivity under changing climatescenarios in Punjab 5. Assessing risk, reducing vulnerability and protracting rice productivity under changing climate 2013 HEC 2014 HEC Ongoing $ Ongoing $
24 Department of Agriculture (Ext &AR) u Zonal Adaptive research Farms optimizing production technologies under prevailing conditions. u Village level farmer training programs u Production plans for each crop is available for selection of crops under variable weathers u Plant clinics in each cropping zone giving warning and solution for plant protection in the season u News letters for farmers also containing warning and management practices to cope with the issue
25 u Training Manuals for all major crops also helping farmers to manage crops under different environments u Calling Help lines are available for farmers to get guidance and solutions for their problems u Advisory Services on the basis weather forecast for crop management practices especially sowing, irrigation, spraying pesticide and harvesting operations. u Selection of crops according to the forecast of PMD especially in Kharif (Summer) season. u Special crop practices under extreme events like drainage of excessive water from cotton/maize fields in rainy season. u Application of irrigation at specificplant growthstages
26 Department of Agriculture Research u Established climatic zone specific research institute and arid, rainfed and semiarid areas. u Breeding against drought and Heat u Conservation agricultural research u Application of crop models for optimization of crop production technology u Application of crop models Crop monitoring and forecast u Introduction of new crops/alternate crops under changing climate like quinoa, hybrid millets/sorghum for cereal purpose
27 Case Studies
 was used to quantify the climate vulnerabilities and")
28 AgMIP Methodology u Five General Circulation Models (GCMs) were used to generate future weather data u Two crop models (DSSAT and APSIM) were used to simulate yield and to assess climate change impact u Economic model (TOA-MD) was used to quantify the climate vulnerabilities and adaptabilities
29 Climate Change Impact on Rice Rice results of APSIM and DSSAT for 155 Farms Variation with 5-GCMs in Rice Region of Punjab-Pakistan, Mean yield reduction by DSSAT and APSIM was 15.2 and 17.2% DSSAT Model 6000 Yield Kgha Baseline IEXA IIXA IKXA IOXA IRXA Climate Models Baseline IEXA-GCM-CCSM4 IIXA-GCM-GFDL-ESM2M IKXA-GCM-HadGEM2-ES IOXA-GCM-MIROC5 IRXA-GCM-MPI-ESM-MR 29
30 Climate Change Impact on Wheat Wheat results of APSIM and DSSAT for 155 Farms Variation with 5-GCMs in Rice-wheat Region of Punjab-Pakistan, Mean yield reduction by DSSAT and APSIM was 14.1and 12%.
31 For Crop Models For TOA-MD Adaptation Package Sr. # Variable Direction of Change %age Change Rice Wheat 1 Nitrogen/hectare (Kg) Increase Sowing Density (Plant/m 2 ) Increase Irrigation Decrease Sowing Dates Decrease 5 Days 15 Days %age Change Sr. # Variable Direction of Change Rice Wheat 1 Average House Hold Persons Increase Non Agricultural Income Increase Yield Increase Price of Output Increase Variable Production Cost Increase 55 50
32 Findings of AgMIP There would be an increase of 2.8 C in day and 2.2 C in night temperature with 571 ppm CO 2 in Punjab for mid-century ( ) (AgMIP, Pak. 2013) The per capita water availability is decreasing in Pakistan and we will have to model it for secure future Mean yield reduction by DSSAT and APSIM was 15.2 and 17.2% for rice and 14.1and 12% for wheat by DSSAT and APSIM respectively
33 Ø The results of analysis showed that for the rice wheat system after adaptation, the number of adopters would be 84 and percent for DSSAT and APSIM, respectively Ø Mean net returns per farm were Rs and Rs for with-adaptation case for overall DSSAT and APSIM model Ø Overall poverty rates of population were reducd and percent for APSIM and DSSAT, respectively Ø Per capita income (Rs./person/annum) for adopters were Rs and Rs for DSSAT and APSIM respectively
34 Future Needs u u u Better collaboration of PMD with Agriculture department Capacity building of stake holder for better understanding the forecasts. Contingency crop production plans with collaboration of PMD
35