The Socio-economic and Environmental Impacts of LMOs:
|
|
|
- Ezra Banks
- 5 years ago
- Views:
Transcription


1 The Socio-economic and Environmental Impacts of LMOs: The Case of GM Corn in the Philippines* Leonardo A. Gonzales, PhD** *Paper presented during the UPLB Students Forum, Drilon Hall, SEARCA, Los Banos, Laguna, March 21, 2016 ** Founding President and Chairman, SIKAP/STRIVE, Inc.


2 SIKAP/STRIVE, Inc. Samahang Itinataguyod ang Kakayahang Angkin sa Pag-unlad Society Towards Reinforcing Inherent Viability for Enrichment
 as a non-stock, non-profit, organization, SIKAP/ STRIVE Inc.")
3 About Us SIKAP/STRIVE, Inc. Since its registration with the Securities and Exchange Commission on January 6, 1994 (SEC Registration No. ANO ) as a non-stock, non-profit, organization, SIKAP/ STRIVE Inc. continues to do policy researches leading towards policy reforms on emerging issues affecting the rural-agricultural sector and society, and focused especially on: Expanding farmers' access to resources they need to create sustainable livelihoods by providing techno-managerial assistance to existing local organizations. Advocating for economic policies through research on food-feed grains, high-value commercial crops, livestock, fisheries, and other agribusiness enterprises that maximize farmers' economic opportunities.
4 About Us SIKAP/STRIVE, Inc. Building a knowledge base on effective strategies for agricultural development by forging partnerships and establishing linkages among national agencies, NGOs, private, and international institutions. SIKAP / STRIVE Inc. incorporates the principles of a learning organization by building strategic partnerships that enhance field-based operations. SIKAP/STRIVE, Inc. provides technical and financial support to graduate and undergraduate scholars engaged in development research in collaboration with their educational institutions.
5 Fields of Expertise SIKAP/STRIVE, Inc. SIKAP/STRIVE, Inc. has expertise in the following fields: Agricultural Economics & Biotechnology Policy Nutrition and Food Security Policy Socio-Economic Impact Assessment Agribusiness Development


6 Selected Publications SIKAP/STRIVE, Inc. Technical and Allocative Efficiency of Philippines Rice Production The Hybrid Rice Commercialization Program: Midterm Assessment Ex Ante Impact Assessment of 3-in-1 Rice


7 Selected Publications SIKAP/STRIVE, Inc. Breaking New Ground The Prospects of Enhancing the Corn Sector s Global Competitiveness through Biotechnology Food-Carrying and Income Generating Capacities of the Rice Sector Harnessing the Benefits of Biotechnology The Case of Bt Corn in the Philippines OUTSTANDING BOOK AWARD During NAST Annual Scientific Meeting, July 2007 OUTSTANDING MONOGRAPH AWARD During NAST Annual Scientific Meeting, July 2008


8 Selected Publications SIKAP/STRIVE, Inc. Four Seasons of Commercialization Monitoring and Evaluating the Socio- Economic Impact of Bt Corn in the Philippines OUTSTANDING MONOGRAPH AWARD During NAST Annual Scientific Meeting, July 2008 Modern Biotechnology & Agriculture A History of Commercialization of Biotech Maize in the Philippines OUTSTANDING BOOK AWARD During NAST Annual Scientific Meeting, July 2010 Sustainable Corn Production in the Philippines


9 Selected Publications SIKAP/STRIVE, Inc. Buffalo Meat Imports and the Philippine Livestock Industry: An Impact Assessment OUTSTANDING BOOK AWARD During NAST Annual Scientific Meeting, July 2013 Benchmarking the Livestock and Poultry Industries A Cross Country Analysis of the Philippines and Four Other Southeast Asian Countries OUTSTANDING BOOK AWARD During NAST Annual Scientific Meeting, July 2014


")
")
10 Network/Linkages SIKAP/STRIVE, Inc. For the past two decades, SIKAP/STRIVE Inc. has worked collaboratively and productively with national agencies, nongovernment organizations, private, and international institutions in various areas of research. Some of the national agencies linked with the SIKAP/STRIVE, Inc. include the following: Department of Agriculture (DA) Department of Science and Technology (DOST) National Committee on Biosafety of the Philippines (NCBP) Livestock Development Council (LDC) National Dairy Authority (NDA) Bureau of Agricultural Research (BAR)
 Philippine Rice")
, Philippine Council for Aquatic and")
11 Network/Linkages SIKAP/STRIVE, Inc. National Academy of Science and Technology (NAST) Philippine Rice Research Institute (PhilRice), Philippine Carabao Center (PCC), Bureau of Agricultural Statistics (BAS), Philippine Council for Aquatic and Marine Research and Development (PCAMRD),

, International")
")

12 Network/Linkages SIKAP/STRIVE, Inc. Philippine Council for Agriculture, Aquatic and Natural Resources Research and Development (PCAARRD), International Service for the Acquisition of Agribiotechnology Applications (ISAAA) Agri-Source Company, Inc. of Thailand. Center for Food and Agribusiness, University of Asia and the Pacific
13 For book purchases and further inquiries, feel free to contact us at: One Tepeyac Place, Governor San Luis RoadPutho-tuntungin, LosBaños, Laguna, Philippines 4030 SIKAP/STRIVE, Inc. PHONE: TELEFAX: contactus@strivefoundation.com
14 The Socio-economic and Environmental Impacts of LMOs: The Case of GM Corn in the Philippines* Leonardo A. Gonzales, PhD** *Paper presented during the UPLB Students Forum, Drilon Hall, SEARCA, Los Banos, Laguna, March 21, 2016 ** Founding President and Chairman, SIKAP/STRIVE, Inc.
15 Outline of the Presentation Global Trends in the Commercial Adoption of GM Crops Empirical Findings of the SIKAP/STRIVE, Inc. Impact Assessment Study Socio-economic Implications of the Supreme Court Ruling on GMOs
16 I S A A A

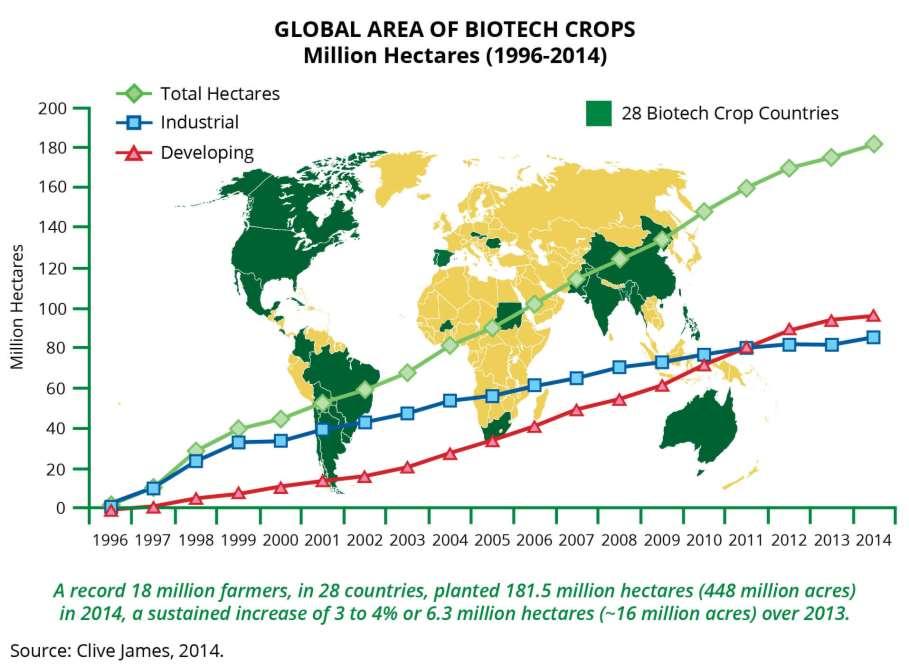
17 Global Area (Million Hectares) of Biotech Crops, 2014: by Country I S A A A Biotech Mega Countries 50,000 hectares (125,000 acres), or more 87% Americas Increase over to 4% 2% Africa Source: Clive James, % Asia 28 countries which have adopted biotech crops In 2014, global area of biotech crops was million hectares, representing an increase of 3 to 4% over 2013, equivalent to 6.3 million hectares. 1. USA 2. Brazil* 3. Argentina* 4. India* 5. Canada 6. China* 7. Paraguay* 8. Pakistan* 9. South Africa* 10. Uruguay* 11. Bolivia* 12. Philippines* 13. Australia 14. Burkina Faso* 15. Myanmar* 16. Mexico* 17. Spain 18. Colombia* 19. Sudan* Less than 50,000 hectares Honduras* Chile* Portugal Cuba* Czech Republic Million Hectares Romania Slovakia Costa Rica* Bangladesh* * Developing countries
18 Global Area of Biotech Crops, 1996 to 2014: By Trait (Million Hectares, Million Acres) I S A A A M Acres Herbicide Tolerance Stacked Traits Insect Resistance (Bt) Source: Clive James, 2014
19 Global Adoption Rates (%) for Principal Biotech Crops (Million Hectares, Million Acres), 2014 I S A A A M Acres Conventional Biotech % Soybean 68% Cotton 30% Maize 25% Canola Source: Clive James, 2014 Hectarage based on FAO Preliminary Data for 2012.
20 LMO ADOPTION IN THE PHILIPPINES The GM corn technology is now more ten years old in the Philippines In 2002: Bt or corn borer resistant corn In 2005: HT or herbicide tolerant corn; and Bt/HT or Stacked corn In 2007: Bt corn first renewal of propagation permit In 2014: Around 830,000 hectares were planted to GM Corn. 20
21 Area Planted ('000 ha) 1400 Area Planted to Yellow Corn by Seed Technology, SIKAP/STRIVE, INC Bt HT Stacked (Bt/HT) Pyramided Stacked Yellow Corn 2002/2007: MON /2010: NK603, Bt11, Stacked Year Note: data series came from BPI; 2012 and 2013 are own estimates of SIKAP/STRIVE, Inc. 21
22 SIKAP/STRIVE, INC. IMPACT ASSESSMENT STUDY Covered nine major corn producing provinces Eight cropping seasons ( ) Sample corn households of 3,505
23 IMPACT ASSESSMENT STUDY The basic research hypothesis was: Technological innovations like GM Products are sustainable if they provide positive socio-economic impacts to society and are compliant with the basic requirements of the natural resource systems. 23
24 EMPIRICAL FINDINGS A. Impacts of Bt Corn Microeconomic farm level impacts 24
25 EMPIRICAL FINDINGS A.1 Farm level impact Yield The average yield advantage of Bt corn over ordinary hybrid (OH) corn was 19% from 2003 to The corn borer resistance agronomic trait of Bt corn largely contributed to the yield difference. 25
26 Yield (mt/ha) SIKAP/STRIVE, INC Trends in Yellow Corn Yield by Seed Technology. Yellow Corn (National) Bt GM (Bt, HT and Bt/HT) Average Ordinary Hybrid 19% Bt vs OH 22% OH vs National /2007: MON /2010: NK603, Bt : El Niño 2007: El Niño 0.0 Year 26
27 EMPIRICAL FINDINGS A.1 Farm level impact Cost On the average, Bt corn has a cost advantage of 10% relative to OH corn from 2003 to
28 Farm Level Production Cost (P/kg, 2003 Constant Prices) Trends in Yellow Corn Farm Production Cost. SIKAP/STRIVE, INC. 10% Bt vs OH /2007: MON /2010: NK603, Bt11 Bt GM (Bt, HT and Bt/HT) Average Ordinary Hybrid Year 28
29 EMPIRICAL FINDINGS A.1 Farm level impact Income The average real peso per kilogram income advantage of Bt corn over OH corn was 8% per annum from 2003 to
30 Farm Level Income (P/kg, 2003 Constant Prices) SIKAP/STRIVE, INC. Trends in Yellow Corn Farm Income % Bt vs OH /2007: MON /2010: NK603, Bt11 Bt GM (Bt, HT and Bt/HT) Average Ordinary Hybrid Year 30
31 EMPIRICAL FINDINGS A.1 Farm level impact Economic carrying capacity Bt corn consistently outperformed OH corn by 29%, in meeting the food and poverty thresholds, from 2003 to
32 Carrying Capacity Ratio. SIKAP/STRIVE, INC. NFI x L x C i i i CC i = SE x 1.15 Where: CC i is the carrying capacity ratio of activity i; Ni i = net income of activity i; L i = is the landholding from activity i; C i = is the cropping intensity of activity i; and SE = subsistence level expenditures or poverty thresholds for a family of five and the 0.15 in 1.15 represents 15 percent savings of households. 32
33 Food Carrying Capacity Ratio (using 2003 Constant Prices) SIKAP/STRIVE, INC. 1.5 Trends in Yellow Corn Food Carrying Capacity % Bt vs OH /2007: MON /2010: NK603, Bt11 Bt GM (Bt, HT and Bt/HT) Average Ordinary Hybrid 0.0 Year 33
34 Poverty Carrying Capacity Ratio (using 2003 Constant Prices) SIKAP/STRIVE, INC. 1.0 Trends in Yellow Corn Poverty Carrying Capacity. 29% Bt vs OH /2007: MON /2010: NK603, Bt11 Bt GM (Bt, HT and Bt/HT) Average Ordinary Hybrid 0.0 Year 34
35 EMPIRICAL FINDINGS A.1 Farm level Impact Return on investment Bt corn users had 42% higher return on investment than OH corn users from 2003 to In order to recover the investments at the farm level, corn yield must be at least 4.0 mt/ha. 35
36 Return on Investment (%, using 2003 Constant Prices) SIKAP/STRIVE, INC Trends in Yellow Corn Farm Level Return on Investment. Bt GM (Bt, HT and Bt/HT) Average Ordinary Hybrid 42% Bt vs OH /2007: MON /2010: NK603, Bt11 0 Year 36
37 EMPIRICAL FINDINGS A. Impacts of Bt Corn Environmental impacts 37
38 EMPIRICAL FINDINGS A.2 Environmental impact indicators Resource use efficiency is the amount of resource needed to produce one mt of corn grain In terms of ratio: INPUT RESOURCE USE OR OUTPUT GRAIN PRODUCTION 38
39 EMPIRICAL FINDINGS A.2 Environmental impact Land use efficiency Bt corn seed users required 15% less land than OH corn seed users in generating one metric ton of corn grain from 2003 to The land use efficiencies of the analyzed seed technologies (OH, Bt and GM) increased dramatically during this period. 39
40 Land Use Efficiency (ha/mt grain) SIKAP/STRIVE, INC. 0.4 Land Use Efficiency of Yellow Corn by Seed Technology National: 27% EFF in 11 Years Bt: 35% EFF in 8 Years Ordinary Hybrid: 39% EFF in 8 Years Yellow Corn (National) Bt GM (Bt, HT and Bt/HT) Average Ordinary Hybrid 15% Bt vs OH Year 40
41 EMPIRICAL FINDINGS A.2 Environmental impact Fertilizer use efficiency Bt corn adopters, on the average, were 9% more efficient in the use of fertilizer than OH corn seed users from 2003 to Fertilizer use efficiency across the analyzed seed technologies improved during this period. 41
42 Fertilizer Use Efficiency (kg NPK/mt grain) SIKAP/STRIVE, INC. 50 Fertilizer Use Efficiency of Yellow Corn by Seed Technology National: 25% EFF in 11 Years Bt: 43% EFF in 8 Years Ordinary Hybrid: 35% EFF in 8 Years 9% Bt vs OH Yellow Corn (National) Bt GM (Bt, HT and Bt/HT) Average Ordinary Hybrid Year 42
43 EMPIRICAL FINDINGS A.2 Environmental impact Labor use efficiency Bt corn seed users were 26% more efficient than OH corn seed users in terms of labor usage from 2003 to There was general labor use efficiency improvement across seed technologies during the same period. 43
44 Human Labor Use Efficiency (mandays/mt grain) SIKAP/STRIVE, INC. 14 Labor Use Efficiency of Yellow Corn by Seed Technology Yellow Corn (National) National: 30% EFF in 11 Years Bt Bt: 46% EFF in 8 Years GM (Bt, HT and Bt/HT) Average Ordinary Hybrid Ordinary Hybrid: 50% EFF in 8 Years 26% Bt vs OH Year 44
45 EMPIRICAL FINDINGS A.2 Environmental impact Pesticide use efficiency Bt corn required 54% less pesticides than OH corn in order to produce the same amount of corn grain from 2003 to All seed technologies analyzed were associated with decreasing pesticide application rates during the study period. 45
46 Pesticide Use Efficiency (ml/mt grain) Pesticide Use Efficiency of Yellow Corn by Seed Technology. SIKAP/STRIVE, INC. National: 51% EFF in 11 Years Bt: 88% EFF in 8 Years Ordinary Hybrid: 83% EFF in 8 Years Yellow Corn (National) Bt GM (Bt, HT and Bt/HT) Average Ordinary Hybrid % Bt vs OH Year 46
47 EMPIRICAL FINDINGS A. Impacts of Bt Corn Macroeconomic impacts 47
48 EMPIRICAL FINDINGS A.3 Macroeconomic impact Estimated incremental difference between GM corn and OH corn at the national level. Aggregate farm income Preharvest labor savings Incremental income from seed and fertilizer sales Postharvest labor income multiplier 48
49 EMPIRICAL FINDINGS A.3 Macroeconomic impact The total macroeconomic effects of GM corn (combined Bt, HT and Bt/HT) was P17,178 million or US$399.5 million in The effects of Bt corn was only P221 million or US$ P5.1 million, equivalent to only one percent of total. This was primarily due to low area planted to Bt corn (2% of total GM) in
50 Macroeconomic Effects of GM Corn. Incremental Net Farm Income Preharvest Labor Savings Indicator Incremental Income from Seed Sales Incremental Income from Fertilizer Sales Postharvest Labor Income Multiplier TOTAL OF ALL FIVE INDICATORS Macroeconomic Effects in Million Peso GM Corn vs OH Corn Total of Three Bt HT Bt/HT GM Corn ,422 6, ,139 4, ,848 3, ,177 1, ,726 15,231 17,178 50
51 CONCLUSIONS SIKAP/STRIVE, INC. More than ten years of GM corn commercialization, particularly Bt corn adoption, in the Philippines indicated positive microeconomic farm level impacts, environmental impacts, and macroeconomic effects. 51
52 RECOMMENDATIONS 1. Create a multidisciplinary team of independent monitors to evaluate the socio-economic, environmental and aggregate macroeconomic impacts of GM corn. Should be composed of: experts in agriculture, environment and social sciences corn farmers users of GM corn products 52
53 RECOMMENDATIONS 2. Establish strategic alliances among stakeholders that can support an agri-biotechnology development policy framework advocating for the following: Soft infrastructures: technical extension services sustainable credit schemes 53
54 RECOMMENDATIONS Hard infrastructures: Farm-to-market roads Irrigation systems Postharvest, processing and trading facilities ( e.g. multistage processing system for corn grains) Enhancement of public research expenditure on agri-biotechnology and strategic homegrown GM products. 54
55 RECOMMENDATIONS 3. Fast track the adoption of GM corn technologies to enhance global competitiveness in the ASEAN and ASEAN +3 markets. This should be reflected in the Philippine yellow corn industry road map. 55
56 RECOMMENDATIONS 4. Develop strategic linkages in GM corn communities with livestock-poultry production areas Establishments of Model Integrated Feed Corn-Livestock and Poultry Farms This will be consistent with the implementation of the ASEAN Economic Community (AEC) 56
57 RECOMMENDATIONS 5. Advocate for quality standards for corn Need to produce high quality corn with aflatoxin levels of less than 20 parts per billion (ppb) making it a Class A quality food-feed grain Need for BAFPS and NFA to adopt quality corn standards 57
58 SOCIO-ECONOMIC IMPLICATIONS OF THE SUPREME COURT RULING ON THE Bt TALONG Background a) On May 17, 2013, the Court of Appeals permanently enjoined the conduct of field trials of genetically modified (GM) eggplant or Bt Talong. b) Subsequently Petitions/Interventions were filed to the SC to reverse the Court of Appeals decision. 58
59 SOCIO-ECONOMIC IMPLICATIONS OF THE SUPREME COURT RULING ON THE Bt TALONG Background c) On December 8, 2016, the Supreme Court ruled on the consolidated petitions as follows: 1. The conduct of the assailed field testing of Bt Talong is hereby PERMANENTLY ENJOINED; 2. Department of Agriculture Administrative Order No. 08, Series of 2002 is declared NULL AND VOID; and 3. Consequently, any application for contained use, filed testing, propagation and commercialization, and importation of genetically modified organism is TEMPORARILY ENJOINED until a new administrative order is promulgated in accordance with law. 59
60 SOCIO-ECONOMIC IMPLICATIONS OF THE SUPREME COURT RULING ON THE Bt TALONG Background d) The SC ruling was so encompassing that it stopped all activities related to GMOs: Applications for contained use, field testing, propagation and commercialization. Importations of GMOs for food, feed, and for processing. 60
61 SOCIO-ECONOMIC IMPLICATIONS OF THE SUPREME COURT RULING ON THE Bt TALONG 1. CORN SECTOR Negative impact on: Productivity; Cost Efficiency; Profitability; Global Cost Competitiveness; and Food Security Overall production will decline. 61
62 Area Planted (ha) 1,400,000 1,200,000 1,000, ,000 SIKAP/STRIVE, INC. 3.A Trends in Area Harvested to Non-GM Yellow Corn and GM Yellow Corn. 1995: 1.02 M ha Non-GM Yellow Corn GM Yellow Corn 2000: 0.94 M ha 2005: 0.95 M ha 2010: 1.16 M ha 53% 2013: 1.28 M ha 43% 600, , % 95% 57% 200,000 47% 0 5% Note: In 2013, Total Corn Area Harvested: 2.56 M ha White: 1.28 M ha Yellow: 1.28 M ha Source of basic data: SIKAP/STRIVE, Inc. Corn Survey, 2004, 2005, 2008 and 2012; BAS Secondary Data on Yellow Corn, 2013.
63 Corn Production (mt) 6,000,000 5,000,000 4,000,000 SIKAP/STRIVE, INC. 3.B Trends in Production of Non-GM Yellow Corn and GM Yellow Corn*. Non-GM Yellow Corn GM Yellow Corn * GM corn production projected estimates using socioeconomic surveys of SIKAP/STRIVE, Inc. 2010: 4.21 M mt 2013: 5.25 M mt 33% 3,000,000 2,000, : 2.27 M mt 2000: 2.62 M mt 2005: 3.00 M mt 93% 37% 67% 1,000, % 100% 63% 0 7% Note: In 2013, Total Corn Production: 7.38 M mt White: 2.13 M mt Yellow: 5.25 M mt Source of basic data: SIKAP/STRIVE, Inc. Corn Survey, 2004, 2005, 2008 and 2012; BAS Secondary Data on Yellow Corn,
64 Area Planted (ha) 3,000,000 2,500,000 SIKAP/STRIVE, INC. 3.C Trends in Area Harvested to White Corn, Non-GM Yellow Corn and GM Yellow Corn. White Corn Non-GM Yellow Corn GM Yellow Corn 2005: 2.44 M ha 2010: 2.50 M ha 2013: 2.56 M ha 2,000,000 61% 54% 50% 1,500,000 1,000,000 25% 22% 500,000 37% 22% 28% 0 2% Note: In 2013, Total Corn Area Harvested: 2.56 M ha White: 1.28 M ha Yellow: 1.28 M ha Source of basic data: SIKAP/STRIVE, Inc. Corn Survey, 2004, 2005, 2008 and 2012; BAS Secondary Data on Yellow and White Corn, 2013.
65 Corn Production (mt) 8,000,000 7,000,000 6,000,000 5,000,000 4,000,000 3,000,000 SIKAP/STRIVE, INC. 3. D Trends in Production of White Corn, Non-GM Yellow Corn and GM Yellow Corn*. White Corn Non-GM Yellow Corn GM Yellow Corn * GM corn production projected estimates using socioeconomic surveys of SIKAP/STRIVE, Inc. 2005: 5.25 M mt 43% 2010: 6.38 M mt 34% 24% 2013: 7.38 M mt 29% 23% 2,000,000 53% 48% 1,000,000 42% 0 4% Note: In 2013, Total Corn Production: 7.38 M mt White: 2.13 M mt Yellow: 5.25 M mt Source of basic data: SIKAP/STRIVE, Inc. Corn Survey, 2004, 2005, 2008 and 2012; BAS Secondary Data on Yellow Corn,
66 SOCIO-ECONOMIC IMPLICATIONS OF THE SUPREME COURT RULING ON THE Bt TALONG 2. Feed milling Sector Major ingredients to date to commercial feeds are GM corn, GM soybeans, and byproducts. Negative impact on their operation. Domestic prices of yellow corn will go up including import prices. Higher prices of commercial feeds. 66
67 SOCIO-ECONOMIC IMPLICATIONS OF THE SUPREME COURT RULING ON THE Bt TALONG 3. Poultry Livestock Sectors Negative impacts on: Cost efficiency and profitability of animal production due to higher feed costs, thus increasing prices of animal products. Global cost competitiveness under Asian Economic Community (AEC) Framework. 67
68 SOCIO-ECONOMIC IMPLICATIONS OF THE SUPREME COURT RULING ON THE Bt TALONG 4. Consumers Negative effects on food security. High prices of poultry and livestock products will adveresely affect the low income groups (poor). 68
69 RECENT DEVELOPMENTS ON THE SUPREME COURT RULING ON THE Bt TALONG 1. DOST-DA-DENR-DOH-DILG Joint Department Circular (JDC) No. 1 Series of 2016, has already been drafted and signed by the five department secretaries. 69
70 RECENT DEVELOPMENTS ON THE SUPREME COURT RULING ON THE Bt TALONG 2. Subject of the JDC Rules and Regulations for the Research and Development, Handling and Use, Movement, Release into the Environment, and Management of Plant Products Derived from the use of Modern Biotechnology. 70
71 RECENT DEVELOPMENTS ON THE SUPREME COURT RULING ON THE Bt TALONG 3. The JDC is consistent with the Cartagena Protocol and the National Biosafety Framework (NBP) under EO 514, and provides guidelines for biosafety decisions. 71
72 RECENT DEVELOPMENTS ON THE SUPREME COURT RULING ON THE Bt TALONG 4. The JDC also provides the administrative guidelines for the role of National Agencies (DA, DOST, DENR, DOH and DILG) under the NBF, and formation of four biosafety committees (DOST- BC, DA-BC, DENR-BC, DOH-BC) 72
73 RECENT DEVELOPMENTS ON THE SUPREME COURT RULING ON THE Bt TALONG 5. The JDC is a more comprehensive and collaborative operationalization of the National Biosafety Framework. 73

74 HAVE A NICE DAY! SIKAP/STRIVE, INC. contactus@strivefoundation.com