Non-legume cover crops can increase non-growing season nitrous oxide emissions
|
|
|
- Rafe Hodge
- 5 years ago
- Views:
Transcription

1 Non-legume cover crops can increase non-growing season nitrous oxide emissions Ben W. Thomas, Xiying Hao, Francis J. Larney, Agriculture and Agri-Food Canada, Lethbridge, AB Claudia Goyer, Agriculture and Agri-Food Canada, Fredericton, NB Martin H. Chantigny, Agriculture and Agri-Food Canada, Quebec, QC Anaïs Charles, Laval University, QC Presented at the 2017 Getting The Most From Nutrient Management Seminar at Lethbridge College 1
2 Acknowledgements The technical assistance of Andrew Olson, Pam Caffyn, Bonnie Tovell, Brett Hill, Jessica Stoeckli, Kyle Shade and the staff at Lethbridge Research and Development Centre is gratefully appreciated Thanks to Sherry Fillmore for providing statistical advice 2
3 Atmospheric composition: Dinitrogen (N 2 ): 78% Oxygen (O 2 ): 21% Agron (Ar): 0.9% What are Greenhouse Gases? Trace gases account for one-tenth of one percent of atmosphere (0.1%): o Ozone (O 3 ) o Carbon dioxide (CO 2 ) o Methane (CH 4 ) o Nitrous oxide (N 2 O) Increase the radiative forcing potential (global warming potential) 3
4 Agricultures Contribution to Trace Gas Emissions Agriculture contributes approximately 8.5% of trace gas emissions in Canada, mainly in the form of CH 4 and N 2 O o 3.0% from enteric fermentation o 1.1% from manure management o 4.4% from agricultural land 4
5 Sources of Trace Gases Emitted from Agriculture Carbon dioxide (CO 2 ) primary source is manure, urine and soil Methane (CH 4 ) primary source is enteric fermentation and manure Nitrous oxide (N 2 O) primary source is manure, urine and fertilizers CH 4 and N 2 O are the primary concerns because they have 28 and 265 times the radiative forcing potential of CO 2 (IPCC, 2013) o a greater global warming potential 5
6 Agricultural and Grazed Grassland Soils in Semiarid Regions Are typically sinks of CH 4 sources of N 2 O o (Ellert and Janzen, 2008, Can. J. Soil Sci.; Gao et al., 2016, Land Degrad. Dev.) Management practices can be modified to limit N 2 O emissions o (Gregorich et al., 2015, Adv. Agron.) Examples include: o Splitting fertilizer N applications (Matching N supply to crop N demand) Banding one starter N application prior to planting Using irrigation pivots to supply the remaining N through fertigation when crop demands N o Avoiding applying fertilizer and fertigation after heavy rains o Avoiding excessive irrigation water o Limiting post-harvest nitrate levels to < 5 ppm (Lemke et al., 1998; Gillam et al. 2008; Chantigny et al., 2010) 6


7 Some Manure Management Options Manure in feedlot pen Anaerobic digestion Land application Stockpiling Composting 7
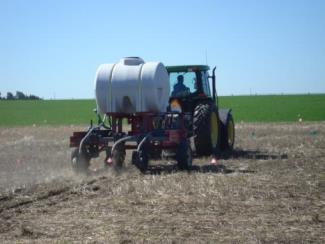
8 Manure Application Better Good 8
9 Manure Management Ideally, manure needs to be land applied and incorporated as soon as possible to limit CH 4 and N 2 O emissions, but mostly to avoid NH 3 loss The reality is that this is usually not feasible Managing beef cattle feedlot manure for reduced trace gas emissions has limitations due to the nature of the production system Remains a challenge for manure management in southern Alberta 9
10 10
11 Introduction Post-harvest seeding of cover crops: o Reduces the risk of wind erosion (Larney et al. 2016, Can. J. Plant Sci.) o Limits nutrient loss via leaching and runoff o Increases biodiversity and resiliency of prairie cropping systems (Martens et al. 2015, Can. J. Plant. Sci.) Uncertain whether cover crops increase or decrease nitrous oxide emissions (Basche et al. 2014, J. Soil Water Conserv.) Limited information about how cover crops directly impact the subsequent crop constrains adoption by farmers in semiarid regions (Liebig et al. 2015, Agron. J.) 11
12 Soil Nitrate (NO 3 ) Typically, ammonium (NH 4 ) is rapidly nitrified to NO 3 o Presents problems because NO 3 is prone to loss pathways The principal substrate for denitrification The principal source of leaching losses during heavy rainfall events 12
13 Study Objective Directly quantify how cover crop species (fall rye or oilseed radish) and nutrient source (compost or inorganic fertilizer) affects: o Cover crop N uptake o Soil NO 3 N dynamics over the non-growing season o Soil nitrous oxide fluxes over the non-growing season o Agronomic performance of unfertilized dryland spring wheat over two consecutive years 13

 Winter kills Large")
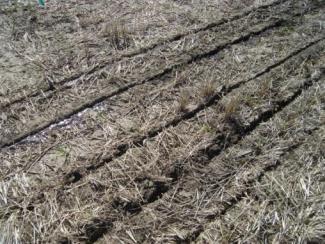
14 Materials and Methods Study site: Lethbridge, AB Two contrasting cover crops were selected: o Fall Rye Survives the winter Extensive fibrous root system o Oilseed Radish (Tillage Radish ) Winter kills Large taproot 14
 o Composted beef cattle manure applied at 100 kg N ha -1 < 12% of total N is in plant-available form Assumed about 25% was plant available (~ 25 kg N ha -1")
15 Materials and Methods Two contrasting nutrient sources were selected: o Inorganic fertilizer applied at 45 kg N ha -1 Ammonium nitrate and super triple phosphate Readily plant-available Assumed about 55% was plant-available (~ 25 kg N ha -1 ) o Composted beef cattle manure applied at 100 kg N ha -1 < 12% of total N is in plant-available form Assumed about 25% was plant available (~ 25 kg N ha -1 ) 15
16 Materials and Methods: Experimental Design 3 x 2 Factorial arranged as RCBD with four blocks: 1. Fall rye with compost (FRC) 2. Fall rye with inorganic fertilizer (FRF) 3. Oilseed radish with compost (ORC) 4. Oilseed radish with inorganic fertilizer (ORF) 5. No cover with compost (NCC) 6. No cover with inorganic fertilizer (NCF) 7. No cover without compost or inorganic fertilizer (CON) 10 m 10 m 10 m 10 m 3.6 m 2 m FRF NCC FRC CON TRF NCF TRC TRF CON NCF FRC TRC NCC FRF NCC TRF FRC FRF CON TRC NCF FRF TRC NCF TRF NCC CON FRC 16

 were collected about monthly Soil NO 3 -N")
17 Gas and Soil Sampling and Analysis Gas samples were collected from vented static chambers about weekly Soil samples (0 to 7.5 cm) were collected about monthly Soil NO 3 -N concentrations were measured in the soil samples 17


18 Cover Crop Establishment Oilseed Radish Fall Rye kg N uptake ha -1 by Nov kg N uptake ha -1 by Nov. 6 Oilseed radish and fall rye on Oct.15, 2013 and Oct. 20, 2014 Poor oilseed radish establishment in 2013 caused by flea beetle 18

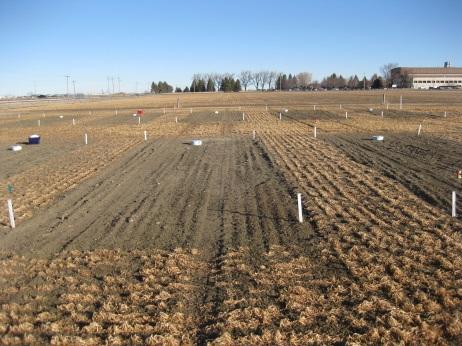
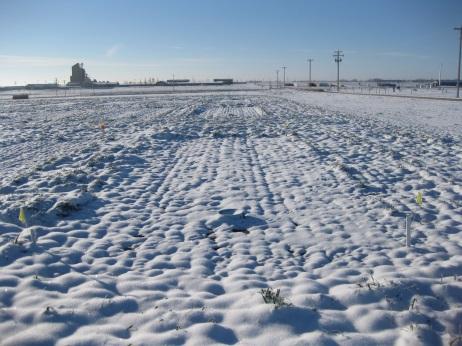
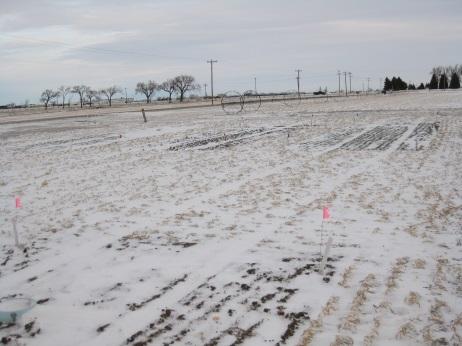

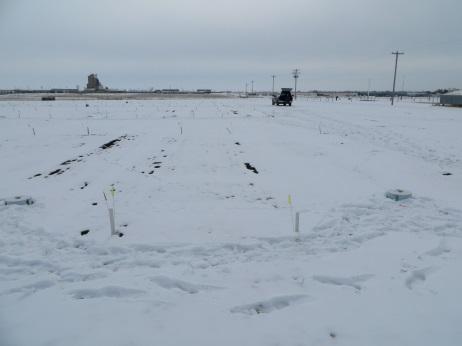
19 Non-growing Season Oct. 29, 2013 Nov. 27, 2013 Dec. 12, 2013 Jan. 9, 2014 Feb. 18, 2014 Mar. 25,
20 Soil Nitrate Response to Cover Crop Species Cover crop (CC) P < Nutrient source (NS) P = CC NS P = Oilseed radish Fall rye No cover crop Cover crop (CC) P < Nutrient source (NS) P = CC NS P = Soil NO 3 -N (mg N kg -1 dry soil) Oct Nov Dec Jan Feb Mar Oct Nov Dec Jan Feb Mar ***N 2 O emissions were only effected by cover cropping in , when NO 3 levels were low*** 20
21 Mean Daily Nitrous Oxide Fluxes and Environmental Conditions


22 Seasonal N 2 O fluxes P < Error bars represent ± SEM 22
23 Winter and Cumulative N 2 O Fluxes in Response to Cover Mean daily N 2 O flux (g N ha -1 d -1 ) Mean daily N 2 O flux (g N ha -1 d -1 ) Over-winter flux b b No cover crop Fall rye Oilseed radish r = 0.97; P < n = Pre-winter soil NO 3 (mg N kg -1 ) Crop Species in a Cumulative N 2 O (g N ha -1 ) Cumulative emission b a No cover crop Fall rye Oilseed radish a 23
24 Grain Yield Response to Cover Crop Species Spring wheat grain yield (kg DM ha -1 ) b a a b a a 0 Fall Rye Oilseed Tillage Radish No cover crop 0 Fall Rye Tillage Oilseed Radish No cover crop
25 Study Summary Nitrous oxide emissions were greater in winter than spring or fall Oilseed radish increased over-winter N 2 O fluxes Oilseed radish and fall rye increased N 2 O emissions under apparent NO 3 limiting conditions Fall rye more effectively scavenged and retained N than oilseed radish during the two non-growing seasons Overall, the N 2 O emissions represented a relatively small source of N loss over the non-growing season in southern Alberta 25
26 Proper Accounting Tools Required Yield-scaled N 2 O emission can provide a fairer comparison of management practices (Gregorich et al., 2015, Adv. Agron.) Captures the environmental and agronomic aspects Example: o If we scale the N 2 O emissions based on grain yield (mean of two years): Oilseed radish: 0.10 g N 2 O-N kg -1 grain yield Fall rye: 0.21 g N 2 O-N kg -1 grain yield Amended soil with no cover crop: 0.09 g N 2 O-N kg -1 grain yield 26