Efficient Cotton Production
|
|
|
- Stephanie Johns
- 5 years ago
- Views:
Transcription


1 Efficient Cotton Production David Wright Increased cotton yields Sod based rotation
2

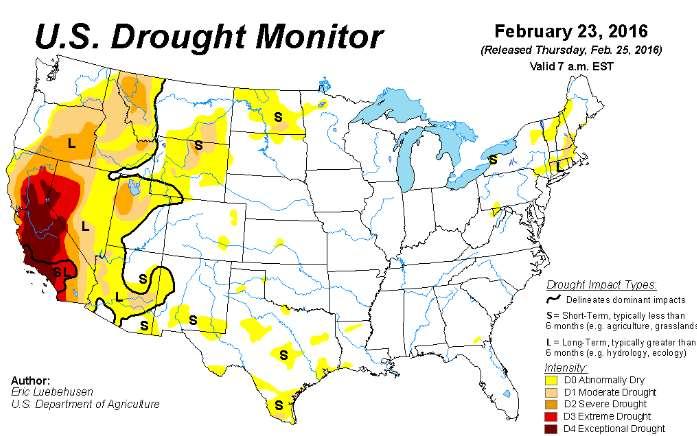
3 Mid-Feb.- Mid-May, 2016

4 Mid-Feb.- Mid-May, 2016
 $77")
5 Comparison of 2016 Estimated Net Returns, Georgia, Irrigated Corn Cotton Grn Sorgh Peanuts Soybeans Expected Yield 200 1, , Expected Average Price 1 $4.25 $0.70 $4.04 $370 $8.60 Crop Income $850 $840 $404 $869 $516 Variable Costs 2 $593 $544 $306 $607 $271 Net Return Per Acre Above VC $257 $296 $98 $262 $246 Net Return per Acre Above VC & $185 Land Rent $72 $111 ($87) $77 $61 1/ Expected average price. Cotton includes LDP and quality premium. 2/ Assumes Jan 2016 costs, Crop Comparison Tool, Department of Agricultural and Applied Economics, UGA Comparison of 2016 Estimated Net Returns, Georgia, Non-Irrigated Corn Cotton Grn Sorgh Peanuts Soybeans Expected Yield , Expected Average Price 1 $4.25 $0.70 $4.04 $370 $8.60 Crop Income $361 $525 $263 $630 $258 Variable Costs 2 $296 $435 $199 $533 $202 Net Return Per Acre Above VC $66 $91 $65 $98 $56 Net Return Per Acre Above VC + $75 Land Rent ($10) $16 ($11) $23 ($19) 1/ Expected average price. Cotton includes LDP and quality premium. At 1000 lbs/a non irrigated profit of $ /A 2/ Assumes Jan 2016 costs, Crop Comparison Tool, Department of Agricultural and Applied Economics, University of Georgia

6 $70/A profit 1 st year vs. $310/A after fully in the system the 4 th year
7 Management impacts on cotton yields Management/yield response Cost of practice Rotation/grazing lbs/a Low Variety selection lbs/a Low N rate, placement, timing lbs/a Moderate Cover crops and strip tillage $ moderate In-row ripping lbs/a $15/A Insecticides during bloom lbs/a $10-30/A Irrigation lbs/a $12/A inch Nematicide lbs/a $15-35/A Velum Total, Tem. Starter fertilizer lbs/a $10-30/A Micronutrients at plant $5-15/A Plant population Low Fungicide lbs/a $15-20/A Look at economics to determine prospects for the crop


8 Most expensive non management is to allow soil to wash away: USE CONSERVATION TILLAGE/COVER CROPS


9 Cover crops and conservation tillage helps retain soil moisture and slows weed emergence and soil loss
10 Variety 17 Trials = lbs/a Combined Average % Top 3 DP 1538 B2XF DP 1558NR B2RF DP 1553 B2XF ST 6182 GLT DP 1252 B2RF PHY 333 WRF PHY 552 WRF PHY 444 WRF ST 4946 GLB
11 Jefferson County non-irrigated, high residue, cotton trial, cattle/forage rotation with cropland, 2015 Variety Lint lbs/a Turnout % DP 1558 NRB2RF 1447a 42.8 DP1538 B2XF 1394a 43.0 CG 3787 B2RF 1379ab 41.5 DP 1252 B2RF 1355ab 42.7 DP 1553 B2XF 1285ab 42.2 ST 6448 GLB2 1275ab 39.1 PHY 552 WRF 1254ab 41.9 ST 4946 GLB2 1249a 39.1 ST 6182 GLT 1217ab 42.8 PHY 333 WRF 1215ab 43.0 PHY 444 WRF 1180b 42.4 PHY 499 WRF 1160b 43.9 Mean Min. significant. dif. 262
12 Top 4 Performance Highlighted (GA) Variety DP 1538 B2XF DP 1558NR B2RF CG 3885 B2XF DP 1553 B2XF ST 6182 GLT DP 1252 B2RF NG 5007 B2XF PHY 333 WRF PHY 444 WRF PHY 552 WRF ST 4946 GLB2 NG 3405 B2XF , ,171 1,362 1,199 1,154 1,283 1,799 1,421 1,535 1,590 1,502 1,558 1,590 1,678 1,596 1, ,036 1,323 1,142 1,058 1,251 1,296 1,275 1,447 1,515 1,900 1,691 1,352 1,581 1,555 1,735 1, ,076 1,225 1,120 1,181 1,384 1,269 1,400 1,427 1,591 1,595 1,517 1,652 1,543 1,668 1,462 1, ,055 1,011 1,185 1,140 1,256 1,218 1,412 1,521 1,572 1,684 1,463 1,592 1,523 1,652 1,587 1, ,096 1,097 1,250 1,362 1,347 1,208 1,456 1,568 1,348 1,472 1,654 1,526 1,577 1,743 1, , ,210 1,240 1,265 1,138 1,500 1,451 1,536 1,504 1,216 1,582 1,651 1,664 1, , ,147 1,157 1,240 1,240 1,423 1,428 1,462 1,555 1,459 1,497 1,465 1,483 1,612 1, ,025 1,108 1,189 1,293 1,104 1,312 1,431 1,336 1,614 1,566 1,452 1,464 1,761 1, ,039 1,198 1,006 1,155 1,126 1,361 1,126 1,351 1,407 1,241 1,364 1,553 1,427 1,502 1,635 1, ,031 1,024 1,037 1,311 1,140 1,449 1,471 1,433 1,288 1,437 1,501 1,528 1,653 1, ,009 1,291 1,141 1,219 1,291 1,375 1,354 1,516 1,535 1,486 1,397 1,501 1, , ,093 1,044 1,158 1,308 1,115 1,314 1,153 1,464 1,409 1,450 1,273 1,573 1,097 Grand Total ,079 1,085 1,132 1,214 1,265 1,296 1,393 1,474 1,477 1,488 1,502 1,510 1,536 1,627 Aver age
13 2015 AL On-Farm Trials Variety 4 Trials = lbs/a Combined Average % Top 3 DP 1538 B2XF DP 1553 B2XF DP 1522 B2XF ST 4946 GLB ST 6182 GLT PHY 487 WRF PHY 495 W3RF DP 1518 B2XF ST 5115 GLT ST 6448 GLB ST 4747 GLB

14 Crop yield with and without irrigation Corn vs bu/a, difference= $400/A, 100% inc. Soybean- 35 vs bu/a, difference = $250/A, 60% Peanut vs lbs/a, difference = $200/A, 25% Cotton- 900 vs lbs/a, difference = $180/A, 30%
15 Rel. Yield Impacts of rotations/cattle on farming systems Env. benefits, ecosys. ser. Applied water and nutrients Invitation for a tour of the sod rotation anytime. 0 single crop, conv. ST, conv., C.C. graze, C.C., ST, conv. bahia, ST bahia, C.C., ST graze, bahia, C.C., ST C.C.= cover crops, ST= strip tillage, conv.= conventional rotation


16 Drilling bahiagrass into winter grazing in Feb.-March. Timing with grazing is late January until March at lbs/a of seed with a drill or no-till drill. Rye and oats works best and ryegrass is only planted into bahiagrass going into year 2. Cattle have grazed this so a no-till drill is being used. Do not plant bahia into ryegrass.


17 After cotton/winter grazing bahiagrass is planted in early March and is grazed through mid May. Bahiagrass planted after small grain in late May or June has severe competition with crabgrass and other summer grasses. If bahia is shorter cattle can be removed for 4-6 weeks to allow bahiagrass to get 12 tall. May 15 July 1

18 Cow/calf (90 pairs) operation head of winter stockers. Calves had weaning weights lbs/head higher than calves on pasture land. Bahia-1 The system in mid May Bahia-2 Pnut Cot.


19 Cotton following peanut without bahia on left and following peanut after bahia on right with 60 lbs/a N on each. Strip tilled into oat cover crop
20 Surface area (mm2) year avg. of cotton roots after winter grazing to a meter deep the bahia system ** ** * Non grazed Depth (cm) Grazed


21 Critical Crop Water Thresholds Summed Soil Water Profile Graph Water Logged Crop Readily Plant Available Water Content Plant Available Water Content Water Stressed Crop
22 Lbs / A 1400 Lint Yield* Nitrogen LSD = bc bc 1200 c 1100 a ab bc Too much N reduces yields cd d *16 locations across cotton belt Nitrogen Pr>F = <0.0001

23 Yield - lb lint/acre N timing is critical to yield of cotton - All plots except control got 60 lb N/A Loamy Soil lsd 0.05 = 182 Better to be early than late Third week of bloom First bloom First square 0 No-N Days After Planting When N was Applied
24 P 60 P For nematode infected fields consider Velum Total 14-18oz/A P 0 P P- 0 P K-0 K-100 Follow soil tests for these elements
 0 4 8 12 16 20 20 40 Cattle recycling N 60 80 100 Non-Irrigated Un-Grazed Irrigated Un-Grazed Non-Irrigated Grazed Irrigated")
25 Depth (cm) Nitrate-N in soil profile of sod-based rotation after bahia-peanut and winter grazing before cotton, Marianna 0 Nitrate-N (kg/ha) Cattle recycling N Non-Irrigated Un-Grazed Irrigated Un-Grazed Non-Irrigated Grazed Irrigated Grazed
26 Depth (in) Potassium (K) in soil profile of sod-based rotation after Bahia-Peanut and winter grazing before Cotton, Marianna 0 K (lbs/a) Non-Irrigated Non-Grazed Irrigated Non-Grazed Non-Irrigated Grazed Irrigated Grazed

27 Cotton planted after winter grazing lbs lint/a with 60 lbs/a acre of applied N.

28 23 deep soil cores to look at nitrates in different systems
29 Soil cores, spring 2015 SBR soil nitrate Soil from NO surface 3 -N (mg to 7 kg m -1 (23 ) ft) depth Soil depth (m) SBR-hay, dryland SBR-hay, irrigated SBR-grazing, dryland SBR-grazing, irrigated Conventional crop rotation Only a summer crop Soil NO 3 -N (mg kg -1 )
30 Lint yield (kg/ha) Cotton lint yields Consistently higher yields for non irrigated cotton 2500 G-I NG-I G-NI NG-NI
 Better winter grazing yields by 1/3 or more 4) More recycled nutrients (30-50% less) 5) Higher calf gains by")
31 Sod rotation + grazing + variable rate irrigation + conservation tillage= 70-80% water savings Verified on farm 1) Better yields of crops 2) Better yields of crops after winter grazing 3) Better winter grazing yields by 1/3 or more 4) More recycled nutrients (30-50% less) 5) Higher calf gains by lb

32 Best varieties, in-row subsoiling, split N with a total of 90 lbs/a unless leached, none after third week of bloom if good boll set, follow winter grazing if possible, insecticides at bloom to prevent hardlock, timely harvest
33 Impact of irrigation on 5 peanut varieties strip tilled into oat cover, NFREC, Quincy, 2014 VARIETY Irrigated Yield Non-irrigated Yield (lb/a) (lb/a) GA 12Y 7420 a 7192 ab TUFRunner bc 6164 de TUFRunner bc 6456 cd GA06G 6493 cd 5916 e FloRun c-e 5873 de Mean
34 Impact of irrigation on 5 peanut varieties strip tilled into oat cover, NFREC, Quincy, 2015 VARIETY Irrigated Yield (lbs/a) Non-irrigated Yield(lbs/A) GA 12Y TUFRunner GA06G FloRun TUFRunner Mean Late leafspot levels were very high in 2015


35 Thermal images Late leaf spot
36 Effect of Rotations and Inputs on Strip-tilled Peanut Yield and Profit in 2014 with GA 06G CONTINUOUS PEANUTS NO FUNGICIDE 1600 I -$380 CONTINUOUS PEANUTS WITH FUNGICIDE I $40 CONTINUOUS PEANUTS WITH FUNGICIDE AND NEMATICIDE Velum Total I 4900 $140 CONVENTIONAL ROTATION NON-IRRIGATED NI 6500 $600 CONVENTIONAL ROTATION IRRIGATED I 7000 $600 SOD BASED ROTATION NON-IRRIGATED NI 7000 $700 SOD BASED ROTATION IRRIGATED lbs/a I 8000$
37 Impact of fungicide programs and nematicides on peanut yield, 2015 (7 yrs. cont. peanuts) Yield lbs/a Avg. 24 trt. Fung/Nem. Best fung. Low fung. Control Yield lbs/a Most were 7 sprays but some 3-8


38 Many other crops and management decisions- Carinata on Jan. 12, twin rows peanut planter Carinata Summit March Quincy, NFREC Thank You!