Trends in tomato products consumption compared to total tomato consumption
|
|
|
- Abigayle Watson
- 5 years ago
- Views:
Transcription

1 Trends in tomato products consumption compared to total tomato consumption Study prepared for WPTC by François-Xavier Branthôme 15 January 2010 Disclaimer: This study was commissioned by WPTC but does not necessarily represent the views of the association or its members 1
2 2
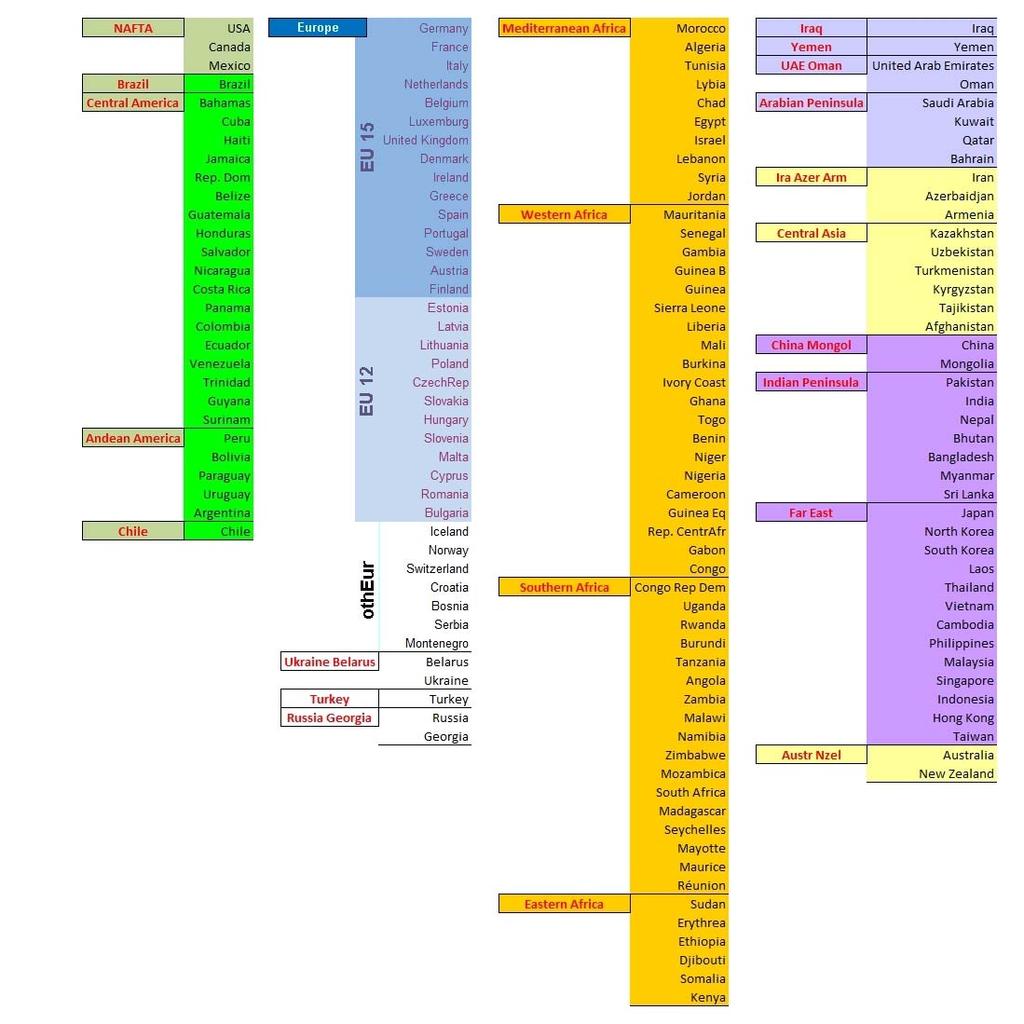
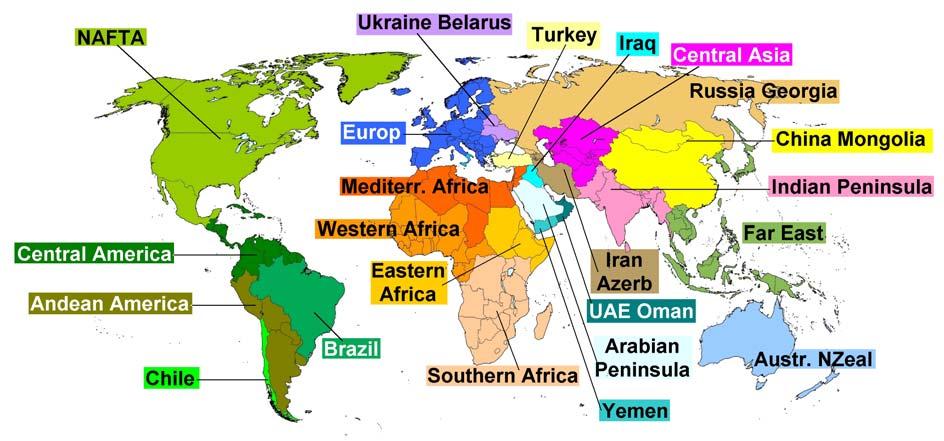
3 Summary Synthesis Global production of Fresh Tomato Global situation Comparison of regional figures Potential markets Developing markets Maturing markets Confirmed markets Mature markets Conclusion Annex Note: Presented regions and relative countries are listed (table and map) in page 51. 3
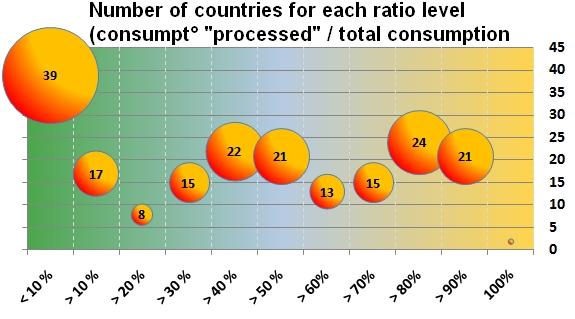
4 Summary The various surveys of worldwide consumption carried out over the past ten years all indicate a regular growth in the consumption of tomato products around the globe, to varying degrees. This global evaluation and an analysis of the evolution of its regional components have allowed the industry to better understand the rates of progression, to identify the most important trends and the key events, to determine, however approximately, the factors that drive the growth in demand, and to ascertain which regions are most promising in terms of development. But the information obtained from these previous analyses were lacking an expression of the immediate context in which our industry evolves, and above all, an answer to the question of how well the production of the tomato industry is doing in the general dynamics of tomato consumption, including fresh tomato consumption. The current study provides an up-to-date summary of consumption figures for fresh tomato and processed tomato with all the perspective afforded by the availability and interpretation of this data, it is apparent that the increase in consumption of processed tomato is occurring in parallel with a slow shift of consumers from fresh products towards processed products. This is not a major trend, as it concerns at the maximum over a ten year period a few hundred thousand tonnes, which were previously consumed as fresh tomato and are now consumed as processed products. In a similar way, the regions examined 23 in total do not all share the same profile in terms of both average levels and evolution over time. The status quo that benefits the tomato industry is the result of a wide variety of situations and different progression, some of them contrary to each other. This comparative study of consumption according to the fresh and processed categories has led us to differentiate between five types of markets: Potential markets, where total tomato consumption amounts to very large volumes but where processed tomato products consumption remains negligible (a ratio < 5%). Developing markets, where the demand for tomato-based products is regular, but does not allow the sector to exceed 25% of the total demand for tomato. Maturing markets, where the use of processed tomato is well established but does not account for more than half of the total volume of tomatoes consumed. Confirmed markets, where fresh tomato is more frequently replaced by processed products and can account for up to three-quarters of the total consumption of tomato. Mature markets, where processed products have been established for a long time and are used systematically, sometimes to the extent of totally replacing fresh tomato consumption. In the final count, the balance between fresh tomato consumption and processed products consumption is based on an average proportion over ten year of approximately 74% to 26%, with an advantage given by consumers to processed products in recent years. This share that processed tomato has scratched away from the fresh tomato category is one of the components in the overall increase of consumption of tomato products that was demonstrated in our recent study, which we presented at the SIAL 2010 in Paris. 4

5 Every second in the world in


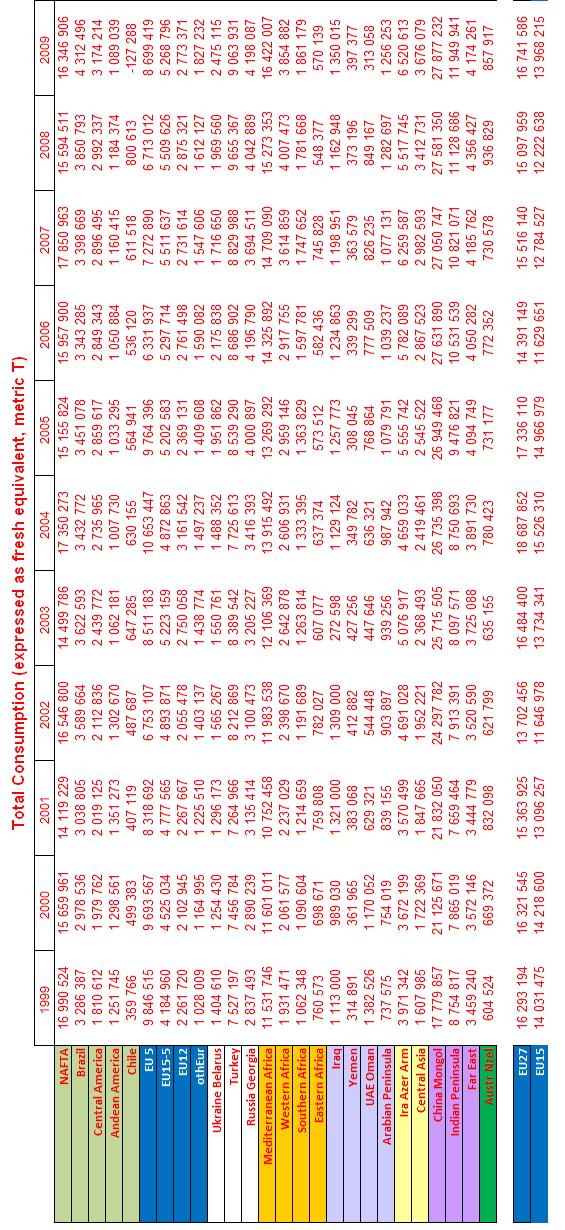
6 1. Global production of fresh tomato According to FAO, global tomato production amounted to 27.6 million tonnes in The threshold of 50 million tonnes was reached in 1978, and 100 million tonnes in Considering an annual growth rhythm of 3.5 %, global tomato production which can be roughly assimilated to global consumption amounted to 141 million tonnes in These production figures provided by FAO include both tomatoes consumed as fresh products and tomatoes dedicated to the processing industry. Recent study (Paris, SIAL 2010) show that growth rate for processed tomato consumption is close to 3 % per year: from 1999 to 2009, the global consumption of tomato products (expressed as fresh equivalent) increased from 28 to 40 million tonnes. Finally it can be considered that total tomato consumption increased from 109 million tonnes in 1999 to 141 million tonnes in Global situation This first approach shows a kind of status quo between fresh and processed consumption, the first representing about 76 % of total consumption, the second a little less than 25 % over the period


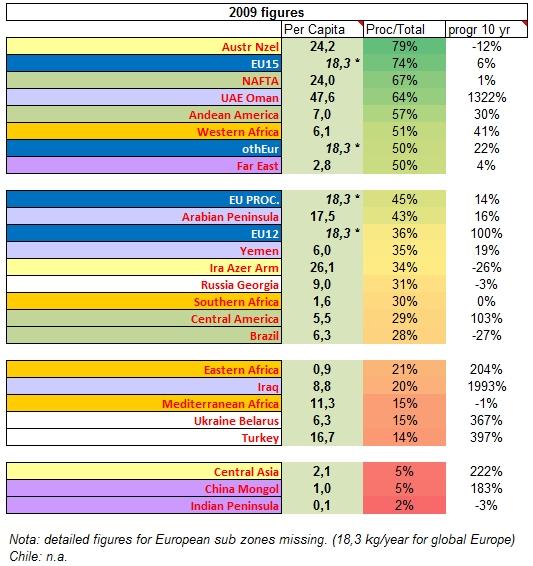
7 Evolutions during this period remain in a tight range (about 4 %), which represents a variation for each sector of 4.5 million tonnes (with regard to the total of 140 million tonnes). It seems that processed products benefit from consumer s favour for 4 or 5 years, but considering the low levels of variations, it is difficult to describe trends, even for very short term. It must also be said that behind this global balanced situation, regional profiles are often more pronounced and extremely contrasted. 3. Comparison of regional figures The regions we described in our previous studies as «low consuming areas» logically show the lowest ratios: 2 % in Indian Peninsula (120g/year/inhab.), 5 % in China-Mongolia (1kg/year/inhab) and in Central Asia (2.1kg/year/inhab) (2009 estim.). Conversely, four regions appear again as the global leaders for the comparison of processed consumption with total consumption : Emirates, Northern America, European Union (15) and Pacific Asia. 7


8 Components of total tomato consumption (fresh + processed) 8


9 4. Potential markets In China-Mongolia, consumption of fresh tomato remains a strong characteristic of the eating habits. Fresh consumption represented 98 % of total consumption in 1999 and 95 % ten years later. 9
 didn t change actually over the period.")
10 There is a similar situation in the Indian Peninsula, where the proportion (98 % for fresh) didn t change actually over the period. 10

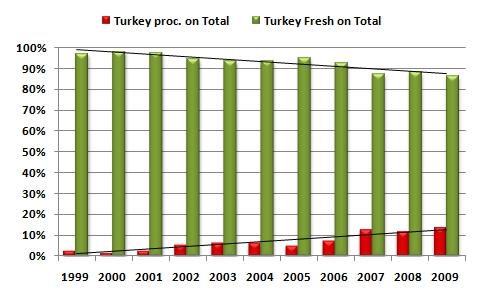
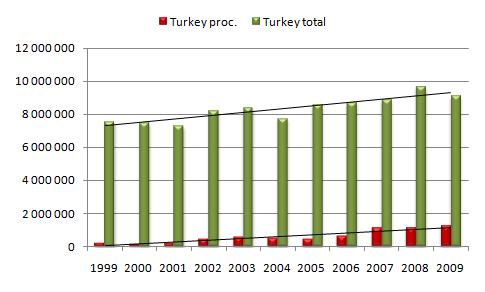
11 In Central Asia, even if the ratio processed/total remains under 5 %, there is an emerging trend, from 690 tonnes of processed products consumed in 1999 to tonnes (equivalent fresh tomato) in These three regions, very close from the geographical point of view represent a strong potential for development, due to the current weakness of the consumption of processed products and their high density of population. However, the high progression margin remains today unworked. 5. Developping markets In Turkey, the consumption of processed products is significantly expressed with regard to the total consumption of tomato. Relatively low 10 years ago, the consumption of tomato products increased regularly and reached 14 % of total consumption in
12 12
13 In the Ukraine-Belarus region, the progress was similar and a little faster and the ratio processed/total represents now 15 %. 13


14 In Iraq, there was no progressive shifting from the fresh sector to the processed sector. A significant part of the consumption of fresh tomato was suddenly replaced by tomato products, falling from 100 % in 1999 and previous years to 80 % from

15 In Eastern Africa, the shifting from fresh to processed sector was progressive: fresh consumption declined from tonnes in 1999 to tonnes in 2009, while processed products increased from to tonnes and reached the level of 21 % of the total consumption in
16 Mediterranean Africa is a special case, as there is a long-lasting use of processed tomato products (in 1999, consumption of industrial products represented already 15 % of the total tomato consumption) and no change in the proportion processed/total over the past 10 years, even if the total quantities increased significantly. Mediterranean Africa is the last region where the consumption of tomato products was lower than 25 % of the total tomato consumption in Maturing markets The following group collects together the areas where the use of tomato products is an historical fact and where the ratio stands between 25 % and 50 %. This group is also collecting the highest number of regions (9 over 26 studied). Paradoxically, the first presented region Brazil is also an exception, as the available results show a decrease of the ratio processed/total consumption. In this region, specific consumption of fresh tomato grew by 53 % over the period, while 16
17 processed products consumption decreased by 4 %. Finally, the ratio processed/total stands around 28 % in
18 In Central America, the profile of replacement of fresh tomato by processed products is more regular, and more typical of this group of regions. Quantities are significant, with a total consumption increasing from 1.8 million tonnes to 3.2 million tonnes, and a consumption of tomato products 3.5 times higher in 2009 than in In 2009, the ratio processed/total was close to 29 %. 18
19 Southern Africa s chart is very similar of Mediterranean Africa s one, with an historical use of processed products and a constant ratio between processed products consumption and total consumption. There was a noticeable increase (+ 75 %) in the total consumption of tomato, while the ratio processed/total remained unchanged at 30 %. 19
20 There is an almost identical situation in the region Russia-Georgia, where processed tomato doesn t succeed in breaking free of fresh sector. There is a balanced situation with both sectors progressing at the same rhythm, and consumption of fresh tomato representing about 70 % of the total consumption. 20
21 The Iran-Azerbaijan-Armenia region is the second exception in this study: there is a noticeable decrease in the proportion of tomato products consumed with regard to the total tomato consumption. Fresh consumption doubled during the past ten years, so that the latest ratio processed/total was estimated at 33%. 21

22 Average quantities consumed in Yemen during the past ten years represent about tonnes per year, of which processed products already amounted to 30 % in 1999 and increased to 35 % in
 as well as quantities.")
23 There are two distinct periods in the profile of 12 new members of EU, with a shifting from fresh to tomato products between 1999 and 2005, and then a stable period until Over the ten years period, the development in consumption of processed products is obvious, regarding the market shares (doubled) as well as quantities. From 1999 to 2009, the proportion of processed products in the total tomato consumption increased from 18 % to 36 %. 23
24 There are also two opposite periods in Arabic Peninsula, with an increase in fresh consumption before 2002 and a noticeable increase in the consumption of processed products from 2003 to 2009, which leads to a balance between processed and fresh close to 43 % vs. 57 % in

25 Due to the important processing activity in these 5 EC processing countries (Portugal, Spain, France, Italy and Greece), and to the situation of international markets, the results must be considered with caution. Huge variations from one year to another, probably resulting from important variations in stocks, make the figures difficult to comment. Without committing oneself, it seems that the ratio processed/total increased from 40 % in 1999 to 49 % in
26 7. Confirmed markets Far East is the first example of regions which have reached or already exceeded the balance between the two types of consumption. During the past ten years, the consumption of processed tomato products followed an ancient trend that led to the perfect balance between fresh and processed. Quantities are significant, with a total tomato consumption which grew from 3.5 million tonnes in 1999 to 4.2 million tonnes in 2009, on which both sectors represented 2.1 million tonnes. 26
27 In non-ec countries, despite a slight slowdown in 2009, the progress was such that the consumption of tomato products amounted to tonnes in 2009, while total consumption increased from 1 million tonnes in 1999 to 1.8 million tonnes last year. 27
28 Western Africa is the most dynamic region of this group, in terms of replacement of fresh consumption by processed products. Like in non-ec countries, the perfect balance was reached in the middle of 90 s, and following years didn t see any change in the situation. Despite this neutral period, the consumption of tomato products increased with regard to total consumption, so that it represented 51 % of total consumption in Regarding African continent as a whole, the total tomato consumption increased from 15.2 million tonnes in 1999 to 22.7 million tonnes in 2009 (+ 49 %). During this period, the evolutions of both sectors were much contrasted, with an increase of 41 % for fresh consumption and 82 % (two times faster) for the consumption of processed tomato products. Finally, the African ratio increased from 18 % to 23 %. 28
 and shifting from fresh to processed went on during the past")
29 Last region in this group which collects together areas that show an average ratio between 25 and 50 %, Andean America also displays the most regular progress and most pronounced balance. Despite relatively low quantities, the use of processed tomato products seems durably established (44 % of the total consumption in 1999) and shifting from fresh to processed went on during the past ten years, resulting in a clear prevalence of tomato products in recent years (57 % in 2009). 29

30 8. Mature markets The first presented region UAE-Oman - is an exception again, as it displays the strongest progress over the past ten years in terms of replacement of fresh consumption by processed products. However, this change took place in a context of decrease in total tomato consumption. Finally, the ratio consumption of processed products/total consumption grew from 7 % to 64 % over the last decade. (some results obtained through linear extrapolation) 30

31 Northern America obviously belongs to the group of regions where the use of processed tomato products is an historical practice, an integral part of eating habits: in 1999, more than two-thirds of total tomato consumption was achieved in the form of industrial products. Quantities are very high, with 11.3 million tonnes (raw material equivalent) of processed tomato consumed in 1999 on a total of 17 million, but it can be observed a slight slowdown in total tomato consumption, which represents about tonnes over the last decade. The consumption of tomato products decreased slightly along with the total consumption, so that the ratio remained almost stable over the period, close to 66 %. 31
. Like NAFTA, EU has its own strong tomato processing industry, what explains the durability in use of processed products in cooking habits.")
32 The picture for the region collecting the other 10 historical members of EU (EU15 outside 5 processing countries) is quite similar, particularly regarding initial consumption levels for tomato products (70 % of total). Like NAFTA, EU has its own strong tomato processing industry, what explains the durability in use of processed products in cooking habits. However, this part of European market (fresh and processed) is going on with its expansion, from 4.2 million tonnes in 1999 to 5.3 million tonnes in Both sectors were progressing over the decade, although growth rates were quite different (+ 7 % for fresh, % for processed ) so that processed products progressively replace fresh consumption. In 2009, tomato products represented 74 % of the total tomato consumption. Regarding EU (15) as a whole, it can be considered that the consumption of fresh tomato is regularly decreasing for the benefit of processed products. Situation in 2009 showed a balance of 56 % for tomato products vs. 44 % for fresh tomato consumption. 32
33 For the record, EU27: 33

34 The region Australia-New Zealand is undoubtedly the one that gives the largest part to the processed tomato products in its total tomato consumption. However, despite the steep development of the regional market, fresh tomatoes appear to be most favored in recent years, with an increase of 180 % over the decade. Processed tomato products keep their supremacy and increase their quantities, but show a slight decrease in the ratio processed/total consumption over the past ten years that stands about 79%-21% in Australia-New Zealand holds the record of the highest ratio consumption of tomato products/total tomato consumption with an average of 80 % over the decade. 34

35 9. Conclusion Status quo in favor of processed tomato products Analysis of regional figures allows getting a more accurate picture of the global trend presented at the beginning of this report. Annual ratios are a little more pronounced than those resulting from the direct comparison of global figures of fresh and processed consumption. This refined trend shows that global consumption of tomato remains mainly focused on fresh sector, but also that there is a slow shifting towards processed tomato products. From 1999 to 2009, in an obvious context of growth of global consumption, the processed sector gained some little shares of the fresh market: it is estimated that about tonnes (fresh equivalent) (0.66 % of the total) shifted from fresh sector to processed sector over the last decade. This amount is one of the components of the increase of the consumption of processed tomato products, which was estimated in our latest study at 12 million tonnes over the past ten years. 35
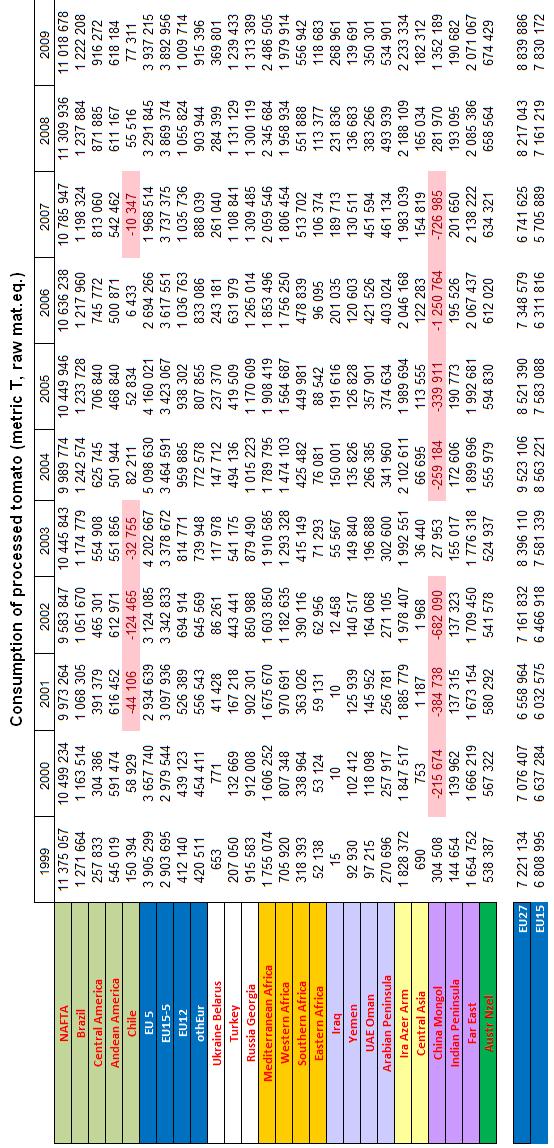
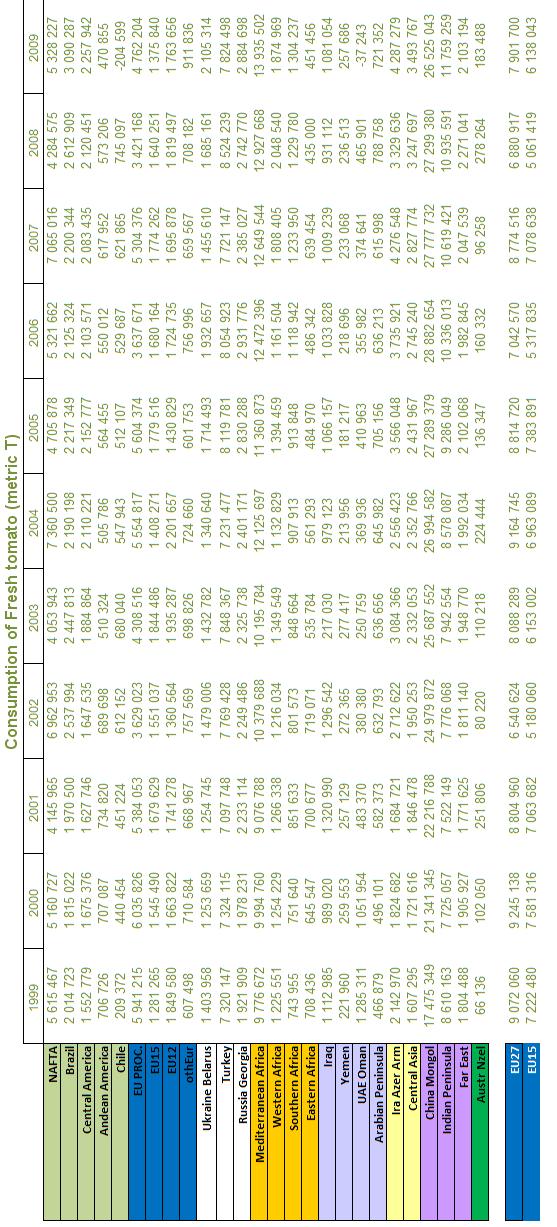
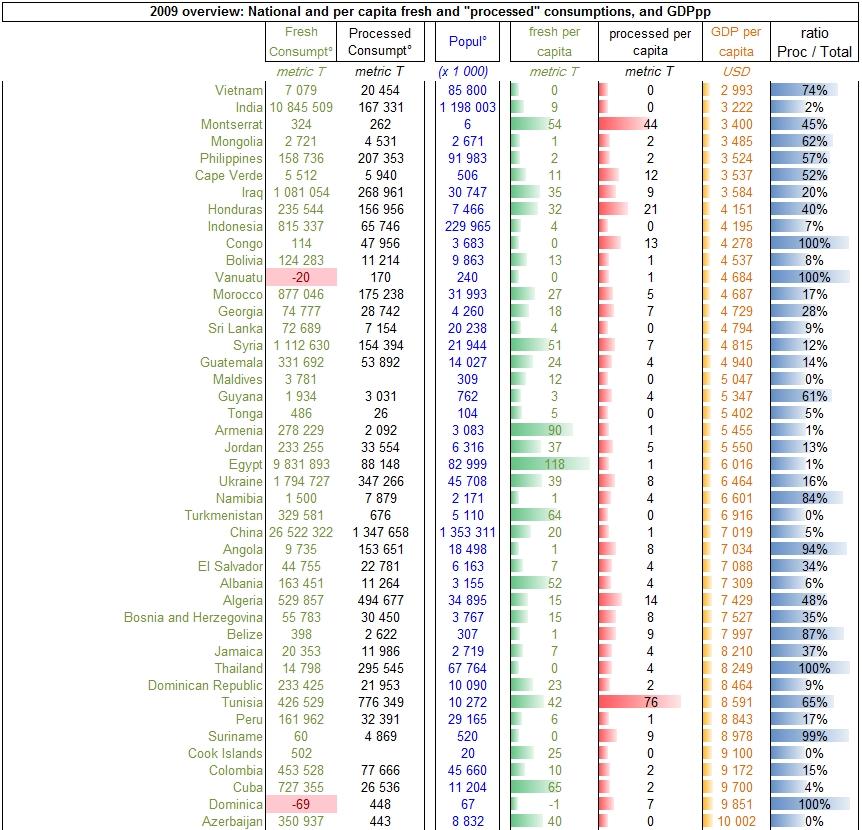
36 10. Annex Method For each country and then each region, the calculation took into account the agricultural production (sourced from FAO), the trade balance for fresh tomato (sourced from GTIS custom code ) and the balance and consumption of processed tomato products (sourced from the latest Tomato News study carried out in 2010). The ratio consumption of tomato products/total tomato consumption was calculated according to the formula: When necessary, specific «fresh consumption» was deducted by simple difference between total consumption and the consumption of processed tomato products. Limits of the study Presented results don t intend to give an accurate and absolute picture of the reality of local, regional or global markets: some data remain unquantifiable (individual production and consumption, losses after production) or uncertain (due to the differences between national customs nomenclatures, informal trade, lack or imprecision of statistical data, etc.). We must also mention some difficulties in harmonizing and using the information provided by different sources (equivalence processed products/raw material, equivalence weight/volume, differences in statistical period, etc). Consequently, the results provided intend to estimate levels and proportions for each type of consumption, in order to identify regional and global trends which allow objective comparison of regional profiles. Given these reservations, national results presented at the end of this report are provided for information and documentation only, and couldn t be considered as giving accurate values of quantities and ratio for the mentioned countries. Annex data 36
37 37
38 38
39 39
40 40

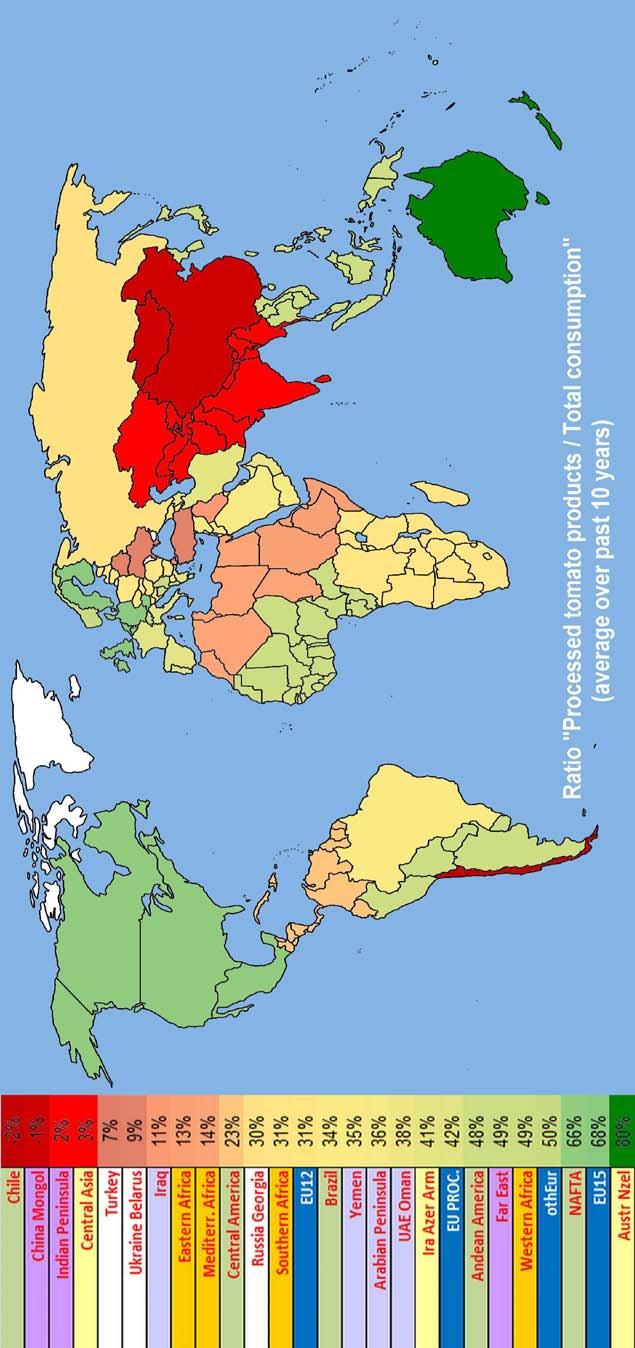
41 Consumption of processed tomato products with regards to total consumption of tomato 41

42 Per capita consumption (processed tomato) 42

43 Per capita consumption (fresh tomato) 43

44 Per capita total consumption of tomato 44
")
45 Comparison of regional per capita total consumption of tomato (fresh + processed) 45

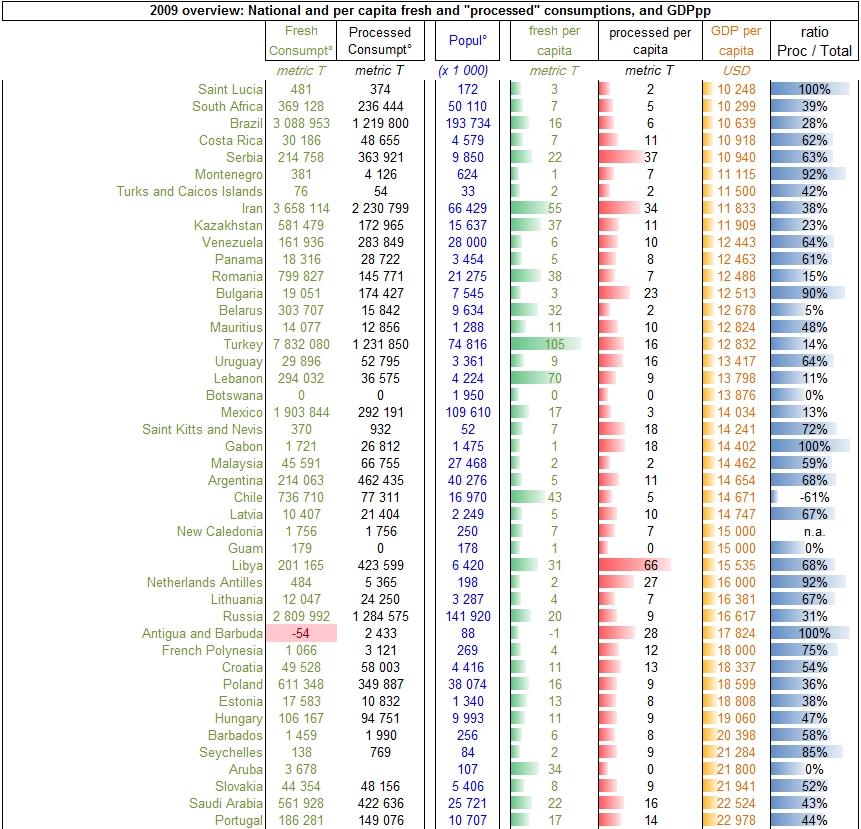
46 National and individual fresh and processed consumptions, comparison with GDPpp 46
47 47
48 48


49 Map showing countries above and below the global average GDP 49
50 50
51 51
52 (Sources : FAO (global and national tomato production), GTIS (trade for fresh tomato code ), Tomato News (Tomato products consumption, 2010 Census), December 2010) 52