Fertility and Crop Nutrition. B. Linquist, R. Mutters, J. Hill and C. vankessel Rice Production Workshop, March 21, 2011
|
|
|
- Albert Marsh
- 5 years ago
- Views:
Transcription


1 Fertility and Crop Nutrition B. Linquist, R. Mutters, J. Hill and C. vankessel Rice Production Workshop, March 21, 2011
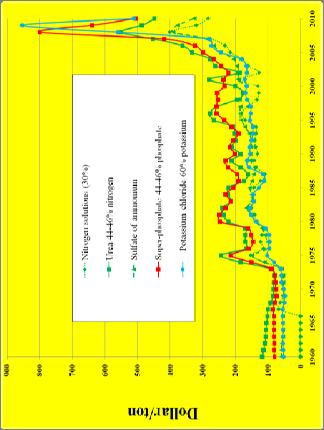
2 Fertilizer costs: Source: USDA Nitrogen solutions (30%) Urea 44-46% nitrogen Dollar/ton Sulfate of ammonium Super-phosphate 44-46% phosphate Potassium chloride 60% potassium
3 Essential mineral elements Macronutrients Nitrogen (N) Phosphorus (P) Potassium (K) Sulfur (S) Calcium (Ca) Magnesium (Mg) Micronutrients Iron (Fe) Manganese (Mn) Zinc (Zn) Copper (Cu) Boron (B) Molybdenum (Mo) Chlorine (Cl) Beneficial elements Iodine (I), Silicon (Si), Sodium (Na), Cobalt (Co), Vanadium (V)
4 Amount of nutrient in plant at time of harvest (lb/1000 grain yield) Nutrient in plant at time of harvest N P K S Ca Mg Fe Mn Zn Cu B Nutrient
5 Location of nutrients in plant at harvest
6 Nutrient uptake and root growth Planting
 Thin oxidized layer (< 1 ; Hi OM) Anaerobic microbes become")
 Flooding Increases availability of P, Si, Mo, and Fe Fe can")
7 What happens when soil is flooded? Aerobic microbes deplete oxygen (few days) Thin oxidized layer (< 1 ; Hi OM) Anaerobic microbes become active in reduced layer Potential loss of nitrate in soil Microbes deplete oxygen from other compounds ph approaches neutral (6 to 7; 2 weeks) Flooding Increases availability of P, Si, Mo, and Fe Fe can become toxic in low ph soils with high OM) Decreases availability of Zn and Cu
8 Fertility management: N management


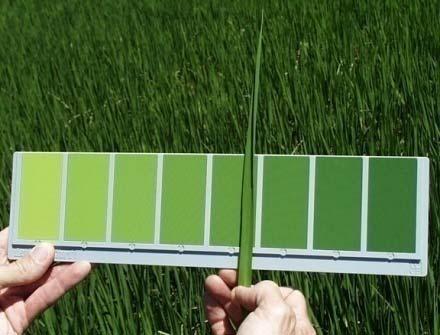
9 Nitrogen deficiency Function amino acids proteins chlorophyll enzymes DNA Symptoms Stunted Yellow Old leaves turn yellow first


10 Sources of N for plant growth Straw Biological N fixation
11 N cycle and N losses In rice systems N fertilizer is applied in an ammonium (NH 4 ) form or a fertilizer that quickly turns to NH 4. When a field is flooded the N stays as NH 4. When a field is drained (or it remains in a unflooded condition) the NH 4 turns to nitrate (NO 3 ). Both NH 4 and NO 3 can be taken up by plants. When a field is reflooded, the NO 3 present in the soil can be lost as gas to the atmosphere. We do NOT want fertilizer N turning to NO 3 Nitrate O NO 2 H + 3 O 2 NH 3,N 2 O, N 2 Urea Ammonium Sulfate Urea Aqua-ammonia Ammonium Sulfate NO 3 Flood Water Oxidized Zone Reduced Zone Fertilizer Incorporation Zone
12 Optimum N rate determined by: Target yield Variety, climate, soil A 9000 lb/ac crop will take up about 145 lb N/ac (about 16 lb N/1000 lb grain) Indigenous N supply Highly variable : lb/ac yields (64-96 lb N/ac) Need to apply enough for 3000 to 5000 lb/ac 48 to 80 lb N taken up by crop How much of applied N is lost On average about 50% Largely affected by management On average 50% of the N applied is taken up. Therefore, 96 and 160 lb N/ac needs to be applied.
 9000 8000 7000 M-202 Y-615")


13 10000 Response of varieties to nitrogen Yield (lb/acre) M-202 Y-615 M M-402 R² = R 2 = R 2 = Nitrogen (lb/a) Yield (lb/acre) L-204 L-205 Calmati-201 R² = R 2 = R² = S-102 Calhikari-201 R 2 = R 2 = Nitrogen (lb/a) Nitrogen (lb/a)
14 Fertility management: N management Straw management effects on N fertility

15 Straw management effects on yield The yield potential of rice is similar regardless of straw management practice
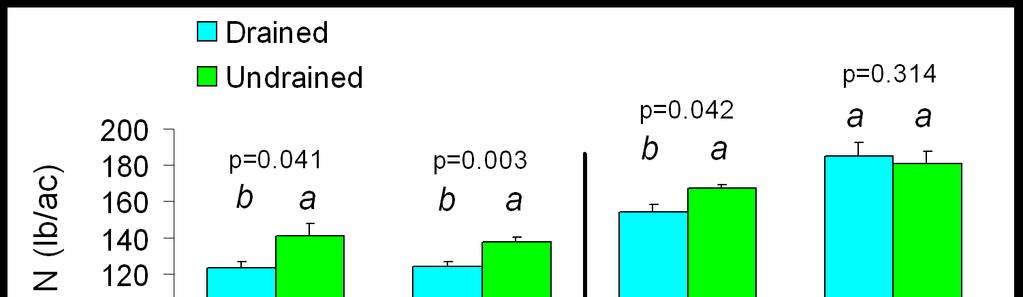
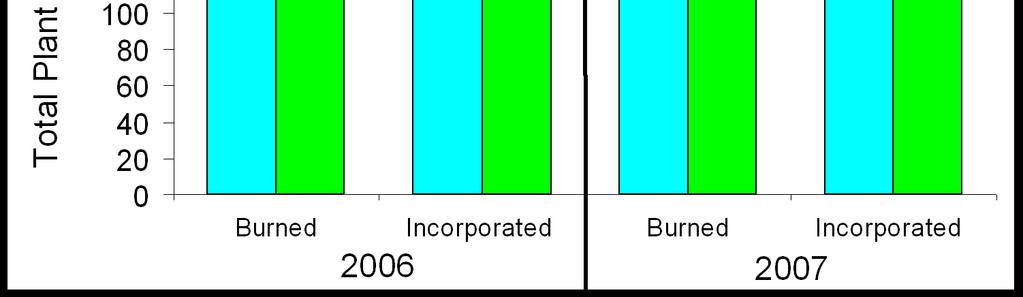
16 Grain yield response to N in burned and incorporated fields (1) Incorporated fields showed no response to N (2) In the burned fields there was an N response (3) Fertilizer N rates can be reduced by 25 lb/ac without compromising yield under straw incorporation (4) Growers have not modified their N management practices to obtain the most benefit. lb acre -1 at 14% moisture Burned Incorporated -25 SP +25
17 Fertility management: Fertilizer placement How much aqua N should be applied relative to starter-n?
18 Represents data from 12 on-farm locations over a 3-year period
19 Does this work in growers fields Same total N rate Aqua + starter All N as aqua In research in 5 grower fields 2 treatments in each field Conventional practice (CP): Aqua + starter N Same N rate as CP but all applied aqua Grain yields were taken at end of season with using a combine with a yield monitor.

20 Grower test - field scale Grain yields (lb/ac) Aqua + starter ,530 Field 1 9,710 Field 2 8,530 Field 3 10, ,350 All N as aqua 10,000 10,040 9,420 10,570 10,200 Difference
21 Do you need to apply N to the surface? Higher yields for the same amount of N fertilizer if all N is applied as aqua. Improved N use efficiency Cheaper N costs Potential for one less pass over the field during the busy planting season. If applying P and K are required then these can be applied at a different time.

22 N management for early season drain fields Fertility management: alternative systems

23 Nitrate accumulation across all sites following the drain
24 N uptake
25 Grain yield as affected by N timing Same take home message as for conventional systems Best to apply all N as aqua


26 Fertility management: alternative establishment systems
27 Alternative establishment systems Stale seedbed Flush of water to bring up weeds may also increase NO3 accumulation before flooding No-till Fertilizer needs to be applied on the surface
28 Grain yields at RES System lb/ac 14% moisture WS-conventional DS-conventional WS-stale WS-stale-notill DS-stale-notill ANOVA ns ns ns ns ns Grain yields are from the main plot with 150 lb N/ac
29 Grain yield response to N rate, timing and N source Wet seeded Conventional Wet seeded Stale seedbed LSD=1103 LSD=619 Total N N treatment AS Drill seeded Stale seedbed
30 Take home message Different N rates were required to achieve maximum yields in the different systems WS conventional: 100 lb N/ac WS no till stale seedbed: 150 lb N/ac DS no till stale seedbed: 100 lb N/ac Splitting the N requirement did not improve yields Ammonium sulfate never performed better than urea. In one case it performed significantly poorer.


31 Fertility management: K management Function osmoregulation stomata function (transpiration) cellular ph cell wall synthesis readily transported Deficiency symptoms Dark green plants with yellowish brown leaf margins Dark brown spots first appear on older leaves Potassium deficiency
32 Occurrence of K deficiency in CA In the red soils in the eastern part of the valley These soils receive irrigation water that has lower K concentrations. Sacramento and Feather rivers 1.30 ppm K Yuba river 0.50 ppm K Where straw has been routinely removed. 80% of the K is in the straw at harvest. Winter flooding with high flow rates removes K.
33 Aggregate Sheath Spot and K AgSS rating y = -0.65x R 2 = Incorporated Removed Midseason leaf K concentration (% )
34 Fertility management: P management


35 Phosphorus deficiency Symptoms Stunted dark green plants reduced tillering Function membrane integrity energy storage phloem transport
36 Phosphorus management in California rice systems. Frequency of P deficiencies Less than 10% of CA rice soils respond significantly to added P fertilizer. Determining the P status of your soil. Soil test Plant tissue test Input-output P budget How much do should you apply? When should you apply? P management and algae
37 Determining the P status of your soil Soil test Olsen P test (sodium-bicarbonate) above 6-9 ppm 20% of the soils with Olsen P less than 9 ppm had significant yield responses to applied P fertilizer Bray test not good for CA rice soils Plant tissue test Y-leaf tissue test. P concentration at 35 DAS 0.2% P 60% of sites with Y-leaf of 0.2% or less had significant yield responses to applied P fertilizer Input-output P budget
38 P management effects on soil P 35 y = x R² = Olsen P (ppm) Annual P budget (lb P2O5/yr)
39 Determining the P status of your soil Soil test Olsen P test (sodium-bicarbonate) above 6-9 ppm 20% of the soils with Olsen P less than 9 ppm had significant yield responses to applied P fertilizer Bray test not good for CA rice soils Plant tissue test Y-leaf tissue test. P concentration at 35 DAS 0.2% P 60% of sites with Y-leaf of 0.2% or less had significant yield responses to applied P fertilizer Input-output P budget
40 Determining the P status of your soil Soil test Olsen P test (sodium-bicarbonate) above 6-9 ppm 20% of the soils with Olsen P less than 9 ppm had significant yield responses to applied P fertilizer Bray test not good for CA rice soils Plant tissue test Y-leaf tissue test. P concentration at 35 DAS 0.2% P 60% of sites with Y-leaf of 0.2% or less had significant yield responses to applied P fertilizer Input-output P budget
 Straw removal (0.")
41 Input-output P budget: Think of soil as a phosphorus bank When managed correctly P fertilizer is relatively immobile in soils. No gas losses Little is lost through water Little lost by leaching Inputs Fertilizer Outputs Grain removal (0.23% P / 0.52% P 2 O 5 ) Straw removal (0.08% P / 0.18% P 2 O 5 )
42 Input-output P budget Develop a budget Inputs (lb/ac of P2O5 as fertilizer) Outputs (lb/ac removed in grain and straw) Develop such a budget (5 yr average) In our study the only sites with significant yield responses had negative P budgets
43 P budget effects on soil P and yield response 35 y = x R² = Olsen P (ppm) Annual P budget (lb P2O5/yr)
44 Input-output P budget Calculate your own budget Develop a budget Inputs (lb/ac of P2O5 as fertilizer) Outputs (lb/ac removed in grain and straw) Develop such a budget over at least a 5 yr period take average
45 Only grain removed P fertilizer added (lb P 2 O 5 /ac) Grain yield (cwt@14%) P balance (lb P 2 O 5 /ac)
46 Grain yield Remove grain and ½ of straw P fertilizer added (lb P 2 O 5 /ac) P balance (lb P 2 O 5 /ac)
47 How much P fertilizer should you Soils have very high P levels based on soil test (i.e. above 20 ppm) and positive P budget Apply no P Soils have very low P (less than 6) and a negative P budget Build up soil P In most cases where P is not limiting use a maintenance strategy Apply what is removed by the crop How much is removed? apply? Olsen P (ppm) y = x R² = Annual P budget (lb P2O5/yr)
48 Maintenance applications based on crop removal Grain yield 4%) Only grain removed P fertilizer added (lb P 2 O 5 /ac) P balance (lb P 2 O 5 /ac) P removed (lb P 2 O 5 /ac) Grain Grain + 1/2 straw Grain yield (cwt)
49 Phosphorus management in California rice systems. Frequency of P deficiencies Less than 10% of CA rice soils respond significantly to added P fertilizer. Determining the P status of your soil. Soil test Plant tissue test Input-output P budget How much do should you apply? When should you apply? P management and algae
50 Procedures Two locations Butte county Both had low soil P levels P treatments in rings 0, 14, 28, and 42 DAS Measurements Soil extractable P Y-leaf P concentrations (35 DAS) Water P concentrations: 2X/week from P application to 3 wk after Yield (only available for 1 site at this time) Algae
51 Soil P status and algae Dry Weight Per Square Meter (G) kg P ha at Flooding MYERS 7 Days After Treatment Site M Dry Weight Per Square Meter (G) kg P ha at Flooding RYSTR 7 Days After Treatment Site R 0 N Y N Y N Y + P 0 N Y N Y N Y + P 05/13 05/27 06/10 Date 05/26 06/09 06/23 Date
 10000 8000 6000 4000 2000 Site R 0 No P P at planting P 14 DAS P 28 DAS P 42 DAS 0 No P P at planting P day 14 P day 28 P day")
52 Grain yield response to delayed P applications b a a a a c ab ab a b Grain yield 14%) Site M Grain yield Site R 0 No P P at planting P 14 DAS P 28 DAS P 42 DAS 0 No P P at planting P day 14 P day 28 P day 42
53 Delayed P application effects on water quality May 12 May 22 May 1 Jun 11 Jun 21 Jun 1 Jul 11 Jul No P M No P R 22 May 1 Jun 11 Jun 21 Jun 1 Jul 11 Jul 21 Jul
54 Summary of P management In P limited fields such as those used in this study Spring applications and applications up to 28 DAS give similar yields If Fall applications are made, a higher P rate may be needed For P sufficient fields (maintenance P application)-90-95% of CA rice fields P applications can be made in the Fall, early spring or after planting. Delaying P applications reduces algae growth. P applications should be made at least 2 weeks before the onset maintenance flow (or other drainage event) to avoid potential water quality problems. When applying P use a P source that has the lowest amount of N possible (i.e ). If this P is applied during the season (at planting or delayed) reduce the amount of N being applied from the total N rate you want to apply.
55 Fertility management: Putting it all together
56 Modified fertility program Aqua N application (as much as possible) Option: apply P early Starter blend 30 DAS Option: apply Fall P spring tillage plant - midseason - harvest - winter flood - spring


")


57 Modified fertility program Option: apply P early Aqua N application (as much Thank as possible) you Starter blend 30 DAS Option: apply Fall P spring tillage plant - midseason - harvest - winter flood - spring