REPORT ON AREA, PRODUCTION, PRODUCTIVITY AND PRICES OF AGRICULTURE CROPS IN KARNATAKA
|
|
|
- Dorcas Thornton
- 5 years ago
- Views:
Transcription
1 DES No: 9 : of 2015 Government of Karnataka REPORT ON AREA, PRODUCTION, PRODUCTIVITY AND PRICES OF AGRICULTURE CROPS IN KARNATAKA DIRECTORATE OF ECONOMICS AND STATISTICS BENGALURU
2
3 REPORT ON AREA, PRODUCTION, PRODUCTIVITY AND PRICES OF AGRICULTURE CROPS IN KARNATAKA DIRECTORATE OF ECONOMICS AND STATISTICS BENGALURU
4
5 PREFACE Agricultural Statistics, particularly those relating to area, production and productivity have a very important role to play in the overall statistical system of the State. One of the key statistical publications being brought out by the Directorate of Economics and Statistics is Area, Production, Productivity and Prices of Agriculture Crops in Karnataka for This report, with Annual Season and Crop Statistics Report as the base for which the Record of Rights, Tenancy and Crop Inspection (Pahani) written by the Village Accountant is the principal source, depicts districtwise land use and further, seasonwise, cropping pattern, agricultural conditions and sourcewise and cropwise area irrigated. This report contains data on production and productivity of agriculture crops. Additionally it contains data on prices of agricultural produce. The Publication is prepared in the Agricultural Statistics Division of the Directorate of Economics and Statistics. welcome. Constructive suggestions for enhancing quality of the report are most Place: Bangalore Date:
6
7 CONTENTS No. Particulars Page No. 1. Introduction 1 2. Seasonal Conditions 1 3. Land Utilisation 1 4. Sources of Irrigation 3 5. Details of Sourcewise Area Irrigated 4 6. Cropping Pattern 6 7. Details of Cropwise Area Irrigated 8 8. Area, Production and Productivity of Crops Index Numbers of Area, Production and Productivity of Crops Price Trend Farm Harvest Prices Index Numbers of Farm Harvest Prices Consumer Price Index Numbers for Agricultural Labourers Agriculture Wages Livestock Census ANNEXURES : 1 TO *****
8
9 AREA, PRODUCTION, PRODUCTIVITY AND PRICES OF AGRICULTURE CROPS IN KARNATAKA, Introduction: Agriculture is still one of the priority sectors of the State s economy, particularly rural economy, not with standing its diminishing share in the State domestic product. Several policies and programs are being planned and implemented by government from time to time to improve productivity. Besides improved techniques for the development of agriculture and higher agriculture production, timely and sufficient rainfall and weather conditions are also crucial factors. During the year under report, the total cropped area has decreased by about 10.0 lakh hectares untimely rainfall. 2. Seasonal Conditions: 2.1 During the agriculture year , the actual rainfall in the State was 1369 mm as against the normal of 1197 mm, an increase of 14.4%. Rainfall was excess in 5 districts, {Bangalore (U), Belgaum, Dakshina Kannada, Hassan, and Udupi). Normal in 16 districts (Bagalkote, Bangalore (R), Chamarajanagar, Chikballapur, Chickmagalur, Davanagere, Dharwad, Haveri, Kodagu, Kolar, Mandya, Mysore, Ramanagar, Shimoga, Tumkur and Uttara Kannada). Deficit in all other 9 districts (Bellary, Bidar, Bijapur, Chitradurga, Gadag, Gulbarga, Koppal, Raichur and Yadgir). But there was excess rainfall during Kharif, normal in Rabi and scanty in Summer seasons. The season wise actual and normal rainfall are given in Table 1 and districtwise and season wise details in Annexure 1. Table - 1 Season wise rainfall condition in the State, Season Rainfall (in mm) Normal Actual Departure from Normal Rainfall (%) Rainfall Pattern Kharif Excess Rabi Normal Summer Scanty State Normal Source : Rainfall section, DES 3. Land Utilization: 3.1 The total geographical area of the State is classified into; (1) forest (2) land put to non-agricultural use (3) barren and uncultivable land (4) permanent pastures and other grazing land (5) cultivable waste (6) miscellaneous trees and groves etc., not included in net
10 2 area sown (7) current fallows (8) other fallow land and (9) net area sown. Details of land use during compared with are in Table - 2. Table 2 Classification of geographical area according to land use during and No Category % to total Area (in hectare) geographical area Forest Land put to non - agricultural use Barren & un cultivable land Cultivable waste Permanent pastures & other graz. Land 6 Land under miscellaneous tree, groves etc., Current fallow Other fallow land Net area sown Total Geographical Area The net area sown in the State decreased by hectares during over Net area under cultivation during was 52.2% as against 55.3% during The percentage of area covered under different uses of land to the total geographical area remains the same in the categories of Forest, Land put to non agricultural use, Barren and uncultivable land, Cultivable waste, Permanent pastures and other grazing land and Land under miscellaneous tree crops groves etc., not included under net area sown, but varies in respect of current fallow, other fallow and Net area sown during the year under review. Districtwise land use area for the year is given in Annexure 2. The Pie chart of the same is given in Annexure Category wise Land Use Area: (a) Forest: Out of the total geographical area, 30,71,833 hectares i.e., 16.1%, is covered by forests. During the year , the forest area remains same compared to The largest forest area was in Uttara Kannada district (26.5%) followed by Shimoga and Chamarajnagar (9.0% each) and the lowest was in Bijapur (0.06%). (b) Land put to non-agricultural use: Area covered under this category of land was 14,32,956 hectares in accounting for 7.5% of the total geographical area. Among
11 3 the districts, the percentage of area covered under this category was highest in Bangalore (U) (8.3%) followed by Bellary (7.6%) and then by Shimoga (6.1%) and the lowest area was in Gadag (0.7%). (c) Barren and uncultivable land: Total area covered under this category of land was 7,86,621 hectares during , which constitutes 4.1% of the total geographical area in the State. The largest area under this category was in Tumkur (8.6%) followed by Dakshina Kannada (7.5%) and Bellary (6.8%) and lowest in Dharwad (0.5%). (d) Cultivable waste: During , the total area under this category of land was 4,13,284 hectares, which accounts for 2.2% of the total geographical area in the State. Tumkur district had the highest area (15.2%) followed by Mandya (10.1%) and lowest in Gadag (0.2%) (e) Permanent pastures and other grazing land: In the State, total area under this category of land was 9,08,393 hectares or 4.8% of the total geographical area during The largest area was in Shimoga (18.0%) followed by Chitradurga and Chickmagalur (9.8% each) and Lowest in Gadag (0.3%). (f) Land covered under miscellaneous trees, crops, groves etc., not included in net area sown: During the year , the total area under this category of land was 2,85,013 hectares which works out to 1.5% of the total geographical area in the State. The largest area was in Udupi (16.4%) followed by Dakshina Kannada (11.1%) and Shimoga (9.4%) and lowest in Dharwad (0.07%). (g) Current fallows: Total area covered under the category current fallows increased to 16,717,87 hectares during from 11,99,134 hectares during Percentage of area under current fallows during was 8.8%. The largest area was in Raichur and Belgaum (13.6%) each followed by Bijapur (12.9%) and lowest in Udupi (0.02%). (h) Other fallow land: In the State, total area under the category other fallow land was 5,38,550 hectares during , which works out to 2.8% of the total geographical area as against 4,26,458 hectares during The largest area was in Koppal (14.9%) followed by Raichur (8.7%) and lowest in Kodagu (0.7%). (i) Net area sown: The net area sown in the State was 99,41,399 hectares during which accounts for 52.2% of the total geographical area. It was 1,05,22,653 hectares (55.3%) during The largest net area sown was in Gulbarga district (9.0%) followed by Belgaum (7.7%) and Bijapur (7.5%) and lowest in Bangalore (U) (0.5%). 4. Sources of Irrigation: 4.1 The main sources of irrigation in the State were wells, tanks, tube/bore wells and reservoirs. The State had 6236 kms length of canals spread over 24 districts. There were 4,43,926 open wells, 6,88,757 tube/bore wells, 33,300 tanks, and 53 reservoirs during the
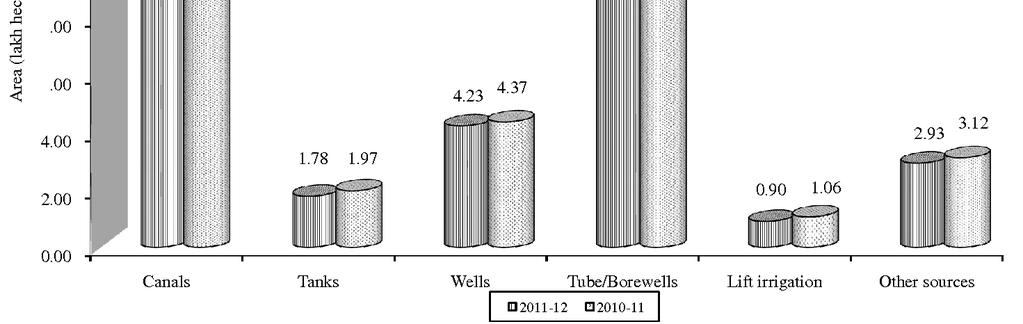
12 4 year under report. Maximum number of open wells were located in Belgaum (62,995) followed by Bijapur (42,387) and Dakshina Kannada districts (40,090). Tube/bore wells were maximum in Tumkur (1,21,133) followed by Kolar (79,791). Hassan had the highest number of 6,066 tanks and the lowest is in Gadag, 30 tanks. Districtwise number of canals, wells, tube/bore wells, tanks and other details are given in Annexure Details of Sourcewise Area Irrigated: 5.1 Out of the 1,20,59,367 hectares of gross cropped area during , 41,36,864 hectares of area was irrigated. The percentage of gross area irrigated was 34.3% during as against 32.8% during Out of 99,41,399 hectares of net area sown during , the net area irrigated was 34,40,425 hectares. The percentage of net area irrigated to net area sown works out to 34.6 as against 33.2 during The percentage of gross cropped area irrigated to gross cropped area sown was largest in Shimoga (65.0%) followed by Mandya (61.7%) and lowest in Kodagu (1.3%). Similarly, the percentage of net area irrigated to net area sown was largest in Shimoga (62.8%) followed by Mandya (60.9%) and lowest in Kodagu (1.4%). District wise details are shown in Annexure In the State, out of 41,36,864 hectares of gross cropped area irrigated, 37.2%, 35.6%, 11.5%, 4.7%, 2.8% and 8.1% of area was irrigated by tube/bore wells, canals, wells, tanks, lift irrigation and other sources respectively. The net area irrigated was 34.2%, 37.1%, 12.3%, 5.2%, 2.6% and 8.5% through canals, tube/bore wells, wells, tanks, lift irrigation and other sources respectively. Source wise area irrigated during is presented in Table - 3 and districtwise details in Annexure 5. The Bar chart depicting the same is given in Annexure and Table 3 Sourcewise area Irrigated during Source of Net area % to State Gross area % to State No. Irrigation irrigated (in hect) total irrigated (in hect) Total 1 Canals (33.1) (35.6) 2 Tanks (5.6) (5.2) 3 Wells (12.5) (11.7) 4 Tube/Borewells (36.7) (36.3) 5 Lift irrigation (3.1) (3.1) 6 Other sources (8.9) (8.1) State (100.0) (100.0) (figures in the bracket is for the year ).
13 5 5.3 (a) Area irrigated by Canals: About lakh hectares of gross cropped area was irrigated by canals during as against lakh hectares during The gross cropped area irrigated by canal was the highest in Raichur (2.1 lakh hectares) followed by Bellary and Bijapur (1.3 lakh hectares). The net area irrigated by canals was 11.8 lakh hectares as against 11.6 lakh hectares during Raichur had the largest net area irrigated (1.7 lakh hectares) followed by Bijapur and Mysore (1.1 lakh hectares). (b) Area irrigated by Tanks: Before the formation of major irrigation projects, tank irrigation was popular in the State. During , the gross cropped area irrigated by tanks was 1.96 lakh hectares. The largest gross cropped area irrigated by tanks was in Shimoga (0.6 lakh hectares) followed by Hassan (0.3 lakh hectares) and least in Koppal (175 hectares). Net area irrigated by tanks in the State was 1.8 lakh hectares. The largest net area irrigated by tanks was in Shimoga (0.5 lakh hectares) followed by Hassan (0.26 lakh hectares) and least in Koppal (175 hectares). (c) Area irrigated by Wells: Gross cropped area irrigated by wells was 4.7 lakh hectares during as against 5.0 lakh hectares during The largest gross area irrigated was in Belgaum (1.6 lakh hectares) and Bijapur (0.9 lakh hectares). Net area irrigated by wells was 4.2 lakh hectares as against 4.4 lakh hectares during The largest net area irrigated by wells was in Belgaum (1.4 lakh hectares) followed by Bijapur (0.8 lakh hectares). (d) Area irrigated by Tube/Bore Wells: Gross area irrigated through tube / bore wells was 15.4 lakh hectares during as against 15.5 lakh hectares during The largest gross area irrigated by tube / bore wells was in Belgaum (1.8 lakh hectares) followed by Tumkur (1.6 lakh hectares). The net area irrigated through the source tube/bore wells was 12.8 lakh hectares in The largest net area irrigated was in Belgaum 1.6 lakh hectares followed by Tumkur district (1.4 lakh hectares). (e) Area irrigated by Lift Irrigation: Gross area irrigated under lift irrigation was 1.2 lakh hectares during The largest gross area irrigated was in Bellary (0.5 lakh hectares) followed by Belgaum (0.2 lakh hectares). Net area irrigated under lift irrigation scheme in the state was 0.9 lakh hectares during The largest net area irrigated was in Bellary (0.3 lakh hectares) followed by Belgaum (0.2 lakh hectares). (f) Area irrigated by other sources of Irrigation: In the State, 3.4 lakh hectares of gross area and 2.9 lakh hectares of net area was irrigated by other sources of water like seepage, streams, ponds, river, pickups etc. The largest gross (1.3 lakh hect) and net (1.1 lakh hect) area was irrigated by Bagalkote District. 5.4 District wise percentage of area irrigated through different sources of irrigation is given in Annexure - 6. Gross cropped area irrigated was 41.4 lakh hectares and net area irrigated was 34.4 lakh hectares in the State. Thus, the area irrigated more than once was 7.0 lakh hectares during as against 7.9 lakh hect area in The area
14 6 irrigated more than once was largest in Bellary (0.95 lakh hectares) and Belgaum (0.72 lakh hectares) and least in Kodagu (30 hectares) during Cropping Pattern: 6.1 During the net area cultivated in the State was 99,41,399 hectares and area sown more than once was 21,17,968 totaling to 12,059,367 as gross cropped area compared to 13,062,163 hectares during Gross cropped area was largest in Belgaum district (8.4%) followed by Gulbarga (8.1%). 6.2 The gross cropped area under food crops was 9,091,234 hectares (75.4%) and that of non-food crops was 2,968,133 hectares (24.6%). It is observed that there is an decrease in area under both food and nonfood crops of about 807,776 & 195,020 hectares respectively. Details of area under different crops and their percentage shares for the years and are given below in Table - 4 Table 4 Gross cropped area under different crops during the year and No. Name of the Crop Area (hect) % to Total Area (hect) % to Total I Food crops 1 Paddy Jowar Bajra Maize Ragi Wheat Navane Save Haraka 17 Neg 3 Neg 10 Other MMs 275 Neg 284 Neg Total (1 to 10) Bengal gram Tur Horse gram Black gram Green gram Avare
15 7 No. Name of the Crop Area (hect) % to Total Area (hect) % to Total 17 Cowpea Other pulses Neg Total (11to 18) Total food grains Sugarcane Palm 421 Neg 241 Neg 21 Chillies Cardamum Arecanut Fruits Vegetables Other food crops Total food crops (1 to 26) Ground nut Sesamum Safflower Sunflower Mustard 4119 Neg 3710 Neg 32 Linseed Nigerseed Soyabean Castor Other oilseeds 3732 Neg 3532 Neg Total (27 to 36) Coconut Cotton Mulberry Tobacco Other non food crops Total non food crops (27 to 40) Total (1 to 40) (Neg =Negligible as it is less than 0.1%)
16 8 6.3 The area was increased in Maize, Saave and Haraka and decreased in all other cereals and pulses in compared to The area under sugarcane, Palm, Cardamum, Arecanut and Fruits increased and area decreased in chillies, vegetables and other food crops. Area under all oilseeds decreased except under Safflower, Mustard, Soyabean and other oilseeds. Area under Coconut and Cotton were increased and Tobacco, Mulberry and other non food crops were decreased during compared to Area under some food and nonfood crops decreased due to untimely rain and change of crops and the area under some food and nonfood crops increased due to good demand and price in market and profitability. District wise area covered under food and non-food crops with their percentage to State s total are presented in Annexure Details of Crop wise Gross Area Irrigated: 7.1 Totally, 41,36,864 hectares or 34.3 % of gross cropped area was irrigated in the State during as against 32.8 % during Paddy crop alone occupied 25.6 % of the Gross irrigated area. The other major crops irrigated (Gross) were Maize (12.6 %) and Sugarcane (15.6%). Totally 80.6% of the gross irrigated area was under food crops. In that 46.0 % of the area was under cereals and minor millet crops. 7.4% and 4.2% of the Gross irrigated area was under oilseeds and pulses respectively. Crop wise gross area irrigated during is given in Table - 5. Table 5 Cropwise Gross Area Irrigated (GAI) during & No Name of the Crop Gross area irrigated % of crop area irrigated to (in GAI of Gross area hectares) all crops under crop Gross area irrigated (in hectares) % of crop area irrigated to GAI of Gross Area all crops under crop I Food crops 1 Paddy Jowar Bajra Maize Ragi Wheat M Millets 196 Neg Neg 1.2 Total (1 to 7)
17 No Name of the Crop Gross area irrigated % of crop area irrigated to (in GAI of Gross area hectares) all crops under crop Gross area irrigated (in hectares) % of crop area irrigated to GAI of Gross Area all crops under crop 8 Bengalgram Tur Other Pulses Total (8 to 10) Total food grains (1 to 10) Sugarcane Palm 207 Neg Neg Con.& spice Fruits & vegetables Total food crops II Non Food Crops 15 Groundnut Castor 149 Neg Neg Sesamum 699 Neg Neg Mustard 447 Neg Neg Linseed 19 Neg Neg 1 Neg Neg 20 Safflower 251 Neg Neg Sunflower Soyabean Nigerseed 51 Neg Neg 1.4 Total (15 to 23) Coconut Cotton Tobacco Mulberry Other non food crops Total non food crops All crops (Total)* (Neg: Negligible as it is less than 0.1%)
18 10 8. Area, Production and Productivity of Crops: Production estimates are prepared in respect of 60 principal crops taking into account the area as recorded in reconciliation of crop area statistics and Annual season and crop statistics Report and the yield rate obtained on the basis of the results of crop cutting experiments. In respect of fruit and vegetable crops, yield rates as per the results of crop cutting experiments conducted under the scheme Crop Estimation Survey on Fruit and Vegetable Crops are taken in to account. For the calculation of production estimates of crops for which no crop cutting experiments were conducted, the yield rates were calculated through oral enquiry of farmers for Nigerseed, Mustard, Papaya, Coconut, Dry Ginger, Cardamom, Garlic, Blackpepper, Coriander, Korle, Madaki, Peas, Cashewnut, Arecanut, Topioca, Sweetpotato and Mesta and by traditional method for Haraka, Baragu and Sunhemp. The area under unauthorized cultivation is also taken care for estimation of production. The cropwise details are as follows. 8.1 Cereals and Minor Millets: Paddy, Jowar, Ragi, Bajra, Maize and Wheat are the important cereals and navane, save are the minor millets grown in the State. Total of these cover 51.2 lakh hectares of the total cropped area in the State during the year under review as against 54.5 lakh hectares during Area, production and productivity of these crops during and are presented in Table - 6. Table 6 Area, Production and Productivity of Cereals and Minor Millets No. Crop Area* (lakh hectares) Production (lakh tonnes) Productivity (kgs per hectare) Rice Jowar Ragi Bajra Maize Wheat Total Cereals Navane Save Total MMs Total Cereals and MMs MM - minor millets. Totals may not tally due to rounding off of the figures * - Area in this table includes unauthorized cultivation area also.
19 Total area covered under cereal crops and minor millets are decreased from 54.5 to 51.2 lakh hectares compared to previous year. Among cereals, Paddy crop alone covered 14.2 lakh hectares followed by maize 13.5 lakh hectares. The area of Cereals and Minor millets was largest in Belgaum (4.3 lakh hectares) followed by Davanagere and Bijapur (3.6 lakh hectares) During the total production of cereals and minor millets was lakh tonnes as against lakh tonnes during The yield rate decreased from 2369 to 2204 kgs per hectare compared to previous year. Production of Cereals and Minor millets was highest in Davangere (10.8 lakh tonnes) followed by Belgaum (8.7 lakh tonnes). The yield of cereals and minor millets was highest in Shimoga (3567 kgs per hect) followed by Davangere (3187 kgs per hectare) and lowest in Gulbarga (1058 kgs per hectare). 8.2 Pulses: Bengalgram, Tur, Horsegram, Blackgram, Greengram, Cowpea and Avare are the principal pulses cultivated in the State. Compared to previous year, area of pulses decreased from 27.9 to 23.0 lakh hectares. The yield of Blackgram, Avare, Cowpea increased, and that of all other pulses are decreased. Crop wise details are seen in Table-7. Table-7 Area, Production and Productivity of Pulses No. Crop Area * (lakh hectares) Production (lakh tonnes) Productivity (Kgs per hectare) Gram Tur Horsegram Blackgram Greengram Avare Cowpea Others Total * - Area includes unauthorized cultivation area also Area under pulses was largest in Gulbarga (5.9 lakh hectares) followed by Bijapur (2.4 lakh hectares) The area production and productivity of pulses were decreased from 27.9 to 23.0 lakh hectares, 15.3 to 10.2 lakh tonnes and 578 to 472 Kgs/ hectare compared to This decrease was mainly due to deficit rain and bad weather condition.
20 12 The production recorded highest under pulses in Gulbarga (3.1 lakh tonnes) followed by Bidar (0.8 lakh tonnes). Yield of pulses was highest in Kolar (1612 kgs per hect) followed by Ramanagar (1042 kgs per hect) and lowest in Koppal (221 kgs per hect). 8.3 Total Food grains: The total area under food grains in the State was 74.1 lakh hectares during as against 82.4 during This area was largest in Gulbarga (8.5 lakh hectares) followed by Bijapur (6.0 lakh hectares) and least in Bangalore (Urban) (0.3 lakh hectares) Total food grains production in the State was lakh tonnes during as against lakh tonnes during The highest production was in Davanagere (10.9 lakh tonnes) followed by Belgaum (9.0 lakh tonnes) and the lowest in Bangalore (Urban) (0.8 lakh tonnes). Districtwise details are in Annexure The yield rate of food grains of Karnataka State was 1667 kgs per hectares and it was highest in Shimoga (3525 kgs per hect) followed by Davanagere (3082 kgs per hect) and lowest in Gulbarga (708 kgs per hect). 8.4 Oilseeds: The important oilseed crops grown in the State are Groundnut, Sunflower, Safflower, Sesamum, Castor, Linseed, Soya bean, Mustard and Niger seed. Total area under oilseeds in the State was 14.1 lakh hectares during as against 16.2 during Crop wise area, production and productivity of oilseed crops are given in Table- 8. Table- 8 Area, Production and Productivity of Oil Seeds No. Crop Area * (lakh hectares) Production (lakh tonnes) Productivity (Kgs per hectares) Groundnut Sunflower Safflower Sesamum Castor Linseed Soyabean Rape & Mustard Niger seed Total Neg negligible * - Area includes unauthorized cultivation area also
21 Compared to , the area under Total Oilseeds has decreased. The area is increased under soyabean, decreased under Groundnut, Sesamum, Sunflower. The area under Safflower, Rape & Musturd, Nigerseed, Castor and Linseed remains the same. The largest area registered in Belgaum (1.4 lakh hectares) followed by Bijapur (1.2 lakh hectares) Total production of oilseeds decreased during the year compared to , from 10.9 to 8.8 lakh tonnes. The total production of oilseeds was highest in Belgaum (1.3 lakh tonnes) followed by Bidar (1.0 lakh tonnes). The average yield was highest in Udupi (2476 kgs per hectare). District wise details are given in Annexure-8. The Bar chart showing the Area, Production and Productivity of Cereals & Minor Millets, Pulses, Food grains and Oilseeds for the year and are given in Annexure 8.1.1, 8.1.2, and Commercial Crops: Cotton, Sugarcane and Tobacco are the important commercial crops grown in the State. Table 9, gives the three dimensional details. Table - 9 Area, Production and Productivity of Commercial Crops No. Crop Area # (Lakh hectares) Production (lakh tonnes) Productivity (Kgs per hectares) Cotton Sugarcane (H) Tobacco Note: *Production of Cotton in lakh bales of 170 kgs in lint form, **Productivity of Sugarcane in tonnes per hectare # - Area includes unauthorized cultivation also The Area, Production and Productivity of cotton increased and decreased in Sugarcane and Tobacco during the year compared to previous year. 8.6 Horticulture Crops: The important horticulture crops of the State are Mango, Banana, Grapes, Guava, Sapota, Papaya, Lemon, Cashewnut, Coconut, Topioca, Sweet potato, Onion, Potato, Chillies, Tomato, Brinjal, Beans, Turmeric etc. Table-10 contains data on Area, production and yield of horticulture crops.
22 14 Table 10 Area, Production and Productivity of Horticulture Crops Area Production Productivity Crop (000 hectares) (000 tonnes) (Kgs per hectares) No Mango Banana Grapes Guava Sapota Papaya Cashewnut-Raw Cashewnut Processed 8 Pomogranate Lemon Coconut Tapioca Sweet Potato Onion Potato Tomato Brinjal Beans Turmeric Cabbage Area under Mango, Banana, Grapes, Guava, Sapota, Pomegranate, Lemon, Coconut and Turmeric increased,area under Cashewnut both raw and processed, Sweet potato, Onion, Potato, Tomato, Brinjal, Beans, Cabbage decreased. And area remains same under Papaya and Tapioca during compared to Production of all crops increased except Papaya, Tapioca, Onion, Tomato, Beans and Cabbage. Yield of all crops increased except Papaya, Tapioca and Onion during Condiments and Spice Crops: Dry Chillies, Dry Ginger, Cardamom, Garlic, Black Pepper, Arecanut and Coriander are the important Condiment and Spice crops of Karnataka. The area of condiments and spice crops increased except Dry Chillies, Dry Ginger and Coriander compared to
23 Production of all Condiments and Spices decreased except Garlic and remains same under cardamom. Yield of all Condiments and Spices decreased except cardamam and Coriander. Area Production and Productivity of condiments and spices are given in Table Table 11 Area, Production and Productivity of Condiments & Spices No. Crop Area (Thousand hects) Production (Thousand tones) Productivity (Kgs per hect) Dry Chillies Dry Ginger Cardamom Garlic Pepper Arecanut-Raw Arecanut-Processed Coriander Index Number of Area, Production and Productivity of Crops: 9.1 The index numbers of area, production and productivity (with as base year) for the year and were compiled for 37 crops. Sub group wise details are given in Table Table 12 Index Numbers of Area, Production and Productivity (Base year : ) No. Crop Area Production Productivity Cereals Pulses Food grains Oilseeds Fibres Plantation crops Condiments and spices Fruits & vegetables Misc.crops Non Food crops All Crops
24 Price Trend: 10.1 The wholesale and retail prices of important crops were collected fortnightly by the District Statistical Officer from the head quarter Agriculture Produce Marketing Committees of Agricultural Marketing Department based on which annual average wholesale and retail prices of selected commodities are worked out and presented in Table Table 13 Annual Wholesale & Retail Prices of important commodities for & No. Commodities Wholesale Prices (Rs.Per Quintal) Retail Prices (Rs.Per Kg) % % 1 Rice (Coarse) Jowar (white) Bajra Ragi Maize Wheat Gram Turdhal Horsegram Blackgram Greengram Potato Onion Dry Chillies (Byadagi) Source : SIP, Division, DES 10.2 The annual average wholesale prices of Jowar, Ragi, Maize, Wheat, Gram, Tur, Black Gram, Green Gram and Dry Chillies are in increasing trend the other Commodities have shown decreasing trend during The wholesale prices varied from % for Onion to 39.41% for Gram During the annual average retail prices, of Jowar, Bajra, Maize, Wheat, Gram, Black Gram, Potato and Dry Chillies are in increasing trend and all other commodities
25 17 shown decreasing trend during The retail prices varied from % for Onion to 30.18% for Gram. 11. Farm Harvest Prices: 11.1 The farm harvest prices of agriculture produce were collected in order to gauge the price levels which prevailed during the peak harvesting period. These prices for important crops for the year and are presented in Table Table - 14 Farm Harvest Prices* of Important agriculture crops for & State's average farm harvest prices (Rs.per quintal) Commodities No % variation 1 Paddy Jowar (Kharif) Jowar (Rabi) Ragi Maize Bajra Wheat Bengalgram Tur Horsegram Greengram Blackgram Drychillies Groundnut Sesasum Castor Linseed Sugarcane Tobacco Coconut** Potato Onion Cotton Source : SIP Division, DES * = based on season wise reports ** = 1000 nuts
26 The prices of all commodities except Black gram, Sesamum, Linseed, Potato, Onion and Cotton showed an increasing trend during over Index Number of Farm Harvest Prices: 12.1 The index number of farm harvest prices were calculated for 19 crops under the sub-groups viz., cereals, pulses, food crops, oilseeds, fibres and miscellaneous crops in the State with triennium ending as base year. The details for and are presented in Table Table 15 Index Number of Farm Harvest Prices for & (Base Year : ) No Sub-groups Index Number % variation 1 Cereals Pulses Food Crops Oil Seeds Fibres Miscellaneous Crops Non food Crops All Commodities Source : SIP Division, DES 12.2 The index numbers of all sub groups increased except fibers decreased during It was highest in respect of miscellaneous crops followed by non food crops. 13. Consumer Price Index Numbers for Agricultural Labourers: 13.1 The consumer price index number of agricultural labourers for food groups stood at 640 points and the general index at 631 points in July At the end of the year i.e., in June 2012, the number was 704 for food group and 696 for general group. Table 16 provides these index numbers month wise, for Table 16 Consumer Price Index Number of Agricultural Labourers in Karnataka Month Food General July, August, September,
27 19 Month Food General October, November, December, January, February, March, April, May, June, Source : SIP Division, DES 14. Agriculture Wages: 14.1 The districtwise, class wise, details of agricultural wages for the year are given in Annexure - 9. There was an increase in the wages of carpenter, blacksmith during the year compared to The wages of skilled labourers and agricultural laborers in dry land, wet land and garden land has increased in compared to that of The state average wage of Carpenters, Black smiths and Mochis has increased by 30.6%, 31.0% and 32.4% respectively during The increase in wages during compared to is seen in Table -17. It may be observed that the wages of women is lower than that of their counterparts in all the categories. District-wise details are in Annexure-9 Table -17 Agriculture Labourers Wages - State Average for the year Cate gory Sex Dry Land Wet Land Garden Land % of in % of in crease crease % of in crease A B C D M F M F M F M F
28 20 Note: A= Labourers at the time of ploughing, digging, sowing, interculturing, watering and uprooting B= Labourers at the time of manuring, transplanting, weeding, reaping and picking C= Activities like cattle, sheep and goat grazing D= Harvesting in areca and coconuts, peeling the coconuts, arecanuts, trimming and spraying in areca and coconut gardens and any other operations relating to arecanut and coconut gardens M= Male, F= Female. 15. Livestock Census: 15.1 The data collected on quinquennial census during 2012 on livestock and agricultural machinery are given in Annexure During livestock census 2012, compared to livestock census 2007, the total livestock population was decreased by 11.8%, out of which cattle s share was -9.43% and that of buffaloes was 19.8%. During the same period the number of sheeps, Horses & Ponies, mules and Poultry registered an increase of 0.19%, 16.75%, % and 25.94% respectively but showed a decline to the extent of -22.1% in the number of Goats, -37.5% in Donkeys and % in Camels. Due to use of mechanized implements in live stock sector, the Agricultural implements both human and animal operated are too less in the field. So, that is not available in 19 th Live Stock Census, No of equipments used in live stock sector is seen in Annexure-10. * * * * *
29 21 ANNEXURE
30 22
31 23 Sl No ANNEXURE : 1 DISTRICTWISE NORMAL AND ACTUAL RAINFALL DURING KHARIF (in mms) April 2011 to August 2011 DISTRICTS Apr-11 May-11 Jun-11 Jul-11 Aug-11 N A Cl N A Cl N A Cl N A Cl N A Cl N A Cl 1 BAGALKOTE E E N N E E 2 B'LORE(R) E N D N E E 3 B'LORE(U) E E N N E E 4 BELGAUM E D E N E E 5 BELLARY N N N N N N 6 BIDAR E D S E E N 7 BIJAPUR E N D N N N 8 CHAMARAJANAGAR E D N D N N 9 CHICKBALLAPUR E E D N E E 10 CHIKMAGALUR E D N D N D 11 CHITRADURGA E D N D N N 12 D.KANNADA E D E N E N 13 DAVANAGERE E D E D E N 14 DHARWAR E D E D E N 15 GADAG E D D N E N 16 GULBARGA E D D E N N 17 HASSAN E E E N E E 18 HAVERI E D E D N N 19 KODAGU E D E N N N 20 KOLAR E N D E E E 21 KOPPAL E N D N N N 22 MANDYA E N S D N N 23 MYSORE E D N D E N 24 RAICHUR N S N N N D 25 RAMANAGAR E E S N N E 26 SHIMOGA E S E N N N 27 TUMKUR E N N N E E 28 UDUPI E S E N E N 29 U.KANNADA E S E N N N 30 YADGIR E N D N N N AVERAGE RAINFALL E D E N E E Note: E= Excess, N = Normal, D = Deficit, S = Scanty, A = Actual, C = Classification Normal : 50 years if Average Rainfall ( )
32 24 ANNEXURE : 1 (contd) DISTRICTWISE NORMAL AND ACTUAL RAINFALL DURING RABI (in mms) No. DISTRICTS Sep-11 Oct-11 Nov-11 Dec-11 Sept 2011 to Dec 2011 N A Cl N A Cl N A Cl N A Cl N A Cl 1 BAGALKOTE S N 28 0 S 7 0 S D 2 B'LORE(R) S N D 16 5 S D 3 B'LORE(U) D N N 11 4 S N 4 BELGAUM E N 35 5 S 6 0 S N 5 BELLARY S D 30 7 S 10 0 S S 6 BIDAR S D 19 0 S 7 0 S S 7 BIJAPUR S S 24 0 S 7 0 S S 8 CHAMARAJANAGAR S N E 28 9 S D 9 CHICKBALLAPUR S N N 14 9 D D 10 CHIKMAGALUR E N N 11 0 S N 11 CHITRADURGA S N D 9 0 S D 12 D.KANNADA E E E 18 4 S E 13 DAVANAGERE D N 37 8 S 6 0 S D 14 DHARWAR D E 41 5 S 7 0 S N 15 GADAG S D 32 0 S 7 0 S S 16 GULBARGA S D 21 1 S 5 0 S S 17 HASSAN E E E 10 1 S E 18 HAVERI N N S 7 0 S N 19 KODAGU E N E 18 0 S E 20 KOLAR S N N D D 21 KOPPAL S S 22 2 S 6 0 S S 22 MANDYA S N E 16 2 S N 23 MYSORE D E E 13 0 S N 24 RAICHUR S S 51 0 S 14 0 S S 25 RAMANAGAR S E E 5 1 S N 26 SHIMOGA E N N 5 0 S E 27 TUMKUR S N N 9 1 S D 28 UDUPI E N E 15 1 S E 29 U.KANNADA E N D 10 0 S E 30 YADGIR S D 23 0 S 5 0 S S AVERAGE RAINFALL N N N 11 1 S N Note: E= Excess, N = Normal, D = Deficit, S = Scanty, A = Actual, C = Classification Normal : 50 years if Average Rainfall ( )
33 25 ANNEXURE : 1 (contd) DISTRICTWISE NORMAL AND ACTUAL RAINFALL DURING SUMMER (in mms) No DISTRICTS Jan-12 Feb-12 Mar-12 Jan 2012 to March 2012 Annual N A Cl N A Cl N A Cl N A Cl N A CI 1 BAGALKOTE 1 0 S 2 0 S 6 0 S 9 0 S N 2 B'LORE(R) 2 0 S 7 0 S 8 1 S 17 1 S N 3 B'LORE(U) 1 0 S 3 0 S 5 0 S 9 0 S E 4 BELGAUM 2 1 D 1 1 N 7 0 S 10 2 S E 5 BELLARY 1 0 S 2 0 S 3 0 S 6 0 S D 6 BIDAR 5 0 S 8 0 S 11 0 S 24 0 S D 7 BIJAPUR 2 0 S 3 1 S 6 0 S 11 1 S D 8 CHAMARAJANAGAR 3 1 S 6 0 S 12 0 S 21 1 S N 9 CHICKBALLAPUR 2 1 D 3 0 S 6 2 S 11 3 S N 10 CHIKMAGALUR 2 0 S 2 0 S 12 0 S 16 0 S N 11 CHITRADURGA 1 0 S 1 0 S 5 0 S 7 0 S D 12 D.KANNADA 3 0 S 2 2 N 9 2 S 14 4 S E 13 DAVANAGERE 1 0 S 1 0 S 4 0 S 6 0 S N 14 DHARWAR 3 0 S 4 0 S 8 0 S 15 0 S N 15 GADAG 1 0 S 1 0 S 4 0 S 6 0 S D 16 GULBARGA 4 0 S 3 0 S 9 0 S 16 0 S D 17 HASSAN 2 0 S 2 0 S 8 3 S 12 3 S E 18 HAVERI 1 0 S 1 0 S 5 0 S 7 0 S N 19 KODAGU 4 1 S 5 1 S 19 6 S 28 8 S N 20 KOLAR 2 2 N 4 1 S 8 1 S 14 4 S N 21 KOPPAL 1 0 S 1 0 S 2 0 S 4 0 S D 22 MANDYA 2 0 S 4 0 S 9 0 S 15 0 S N 23 MYSORE 2 0 S 4 1 S 11 0 S 17 1 S N 24 RAICHUR 1 0 S 5 0 S 10 0 S 16 0 S D 25 RAMANAGAR 1 0 S 2 0 S 4 0 S 7 0 S N 26 SHIMOGA 1 0 S 1 0 S 5 1 S 7 1 S N 27 TUMKUR 1 0 S 2 0 S 6 4 D 9 4 D N 28 UDUPI 3 0 S 1 0 S 5 0 S 9 0 S E 29 U.KANNADA 1 0 S 1 0 S 3 0 S 5 0 S N 30 YADGIR 4 0 S 4 0 S 6 0 S 14 0 S D AVERAGE RAINFALL 2 0 S 3 0 S 8 1 S 13 1 S N E= Excess, N = Normal, D = Deficit, S = Scanty, A = Actual, C = Classification Normal : 50 years if Average Rainfall ( )
34 26 ANNEXURE -2 CLASSIFICATION OF TOTAL GEOGRAPHICAL AREA IN KARNATAKA, (Area in Hectares) Geographical Area Classification of Area Not Available for Cultivation District No. Professional Cultivable Village Papers Forest Survey Land put to Nonagricultural uses Uncultivable Land Barren & Waste BAGALKOT BANGALORE(U) BANGALORE(R) BELGAUM BELLARY BIDAR BIJAPUR CHAMARAJANAGAR CHIKKABALLAPURA CHICKMAGALUR CHITRADURGA D.KANNADA DAVANGERE DHARWAD GADAG GULBARGA HASSAN HAVERI KODAGU KOLAR KOPPAL MANDYA MYSORE RAICHUR RAMANAGARA SHIMOGA TUMKUR UDUPI U.KANNADA YADGIR STATE
35 27 ANNEXURE -2 (contd) CLASSIFICATION OF TOTAL GEOGRAPHICAL AREA IN KARNATAKA, (Area in Hectares) Classification of Area Total Area sown more Uncultivated land excluding fallow land Fallow Land District Cropped than once No. Permanent Pastures & Miscellaneous Tree Current Other Fallow Net Area Area (14)-(13) other grazing land Crops, Groves(*) Fallows Land Sown BAGALKOT BANGALORE(U) BANGALORE(R) BELGAUM BELLARY BIDAR BIJAPUR CHAMARAJANAGAR CHIKKABALLAPURA CHICKMAGALUR CHITRADURGA D.KANNADA DAVANGERE DHARWAD GADAG GULBARGA HASSAN HAVERI KODAGU KOLAR KOPPAL MANDYA MYSORE RAICHUR RAMANAGARA SHIMOGA TUMKUR UDUPI U.KANNADA YADGIR STATE
36 28
37 29 ANNEXURE - 3 SOURCES OF IRRIGATION IN KARNATAKA, Canals Wells District Government Number of Tube/Borewells No. Number Length (Kms.) Government Private Total BAGALKOT BANGALORE(U) BANGALORE(R) BELGAUM BELLARY BIDAR BIJAPUR CHAMARAJANAGAR CHIKKABALLAPURA CHICKMAGALUR CHITRADURGA D.KANNADA DAVANGERE DHARWAD GADAG GULBARGA HASSAN HAVERI KODAGU KOLAR KOPPAL MANDYA MYSORE RAICHUR RAMANAGARA SHIMOGA TUMKUR UDUPI U.KANNADA YADGIR STATE
38 30 ANNEXURE - 3 (contd) SOURCES OF IRRIGATION IN KARNATAKA, Wells Lift irrigation Number of other wells used for Irrigation purpose only District No. Government Private Total Government Private Total Masonry Non-masonry Masonry Non-masonry BAGALKOT BANGALORE(U) BANGALORE(R) BELGAUM BELLARY BIDAR BIJAPUR CHAMARAJANAGAR CHIKKABALLAPURA CHICKMAGALUR CHITRADURGA D.KANNADA DAVANGERE DHARWAD GADAG GULBARGA HASSAN HAVERI KODAGU KOLAR KOPPAL MANDYA MYSORE RAICHUR RAMANAGARA SHIMOGA TUMKUR UDUPI U.KANNADA YADGIR STATE
39 31 ANNEXURE - 3 (contd) SOURCES OF IRRIGATION IN KARNATAKA, Number of Number of Tanks Number of Pumpsets Number of District Wells not With ayacut of 40 With ayacut of less No Reservoirs Total Electrical Diesel Total in use hectares or more than 40 hectares BAGALKOT BANGALORE(U) BANGALORE(R) BELGAUM BELLARY BIDAR BIJAPUR CHAMARAJANAGAR CHIKKABALLAPURA CHICKMAGALUR CHITRADURGA D.KANNADA DAVANGERE DHARWAD GADAG GULBARGA HASSAN HAVERI KODAGU KOLAR KOPPAL MANDYA MYSORE RAICHUR RAMANAGARA SHIMOGA TUMKUR UDUPI U.KANNADA YADGIR STATE
40 32 ANNEXURE - 4 DISTRICTWISE PERCENTAGE OF AREA SOWN TO AREA IRRIGATED, (Area in Hectares) Gross Area Net Area Sown Irrigated % GAI to GAS Sown Irrigated % NAI to NAS Sl No. District BAGALKOT BANGALORE(U) BANGALORE(R) BELGAUM BELLARY BIDAR BIJAPUR CHAMARAJANAGAR CHIKKABALLAPURA CHICKMAGALUR CHITRADURGA D.KANNADA DAVANGERE DHARWAD GADAG GULBARGA HASSAN HAVERI KODAGU KOLAR KOPPAL MANDYA MYSORE RAICHUR RAMANAGARA SHIMOGA TUMKUR UDUPI U.KANNADA YADGIR STATE
41 33 No District ANNEXURE - 5 SOURCEWISE AREA IRRIGATED IN KARNATAKA, (Area in Hectares) Gross / Net area irrigated by (in Hectares) Government Canals Tanks Wells Gross Net Gross Net Gross Net BAGALKOT BANGALORE(U) BANGALORE(R) BELGAUM BELLARY BIDAR BIJAPUR CHAMARAJANAGAR CHIKKABALLAPURA CHICKMAGALUR CHITRADURGA D.KANNADA DAVANGERE DHARWAD GADAG GULBARGA HASSAN HAVERI KODAGU KOLAR KOPPAL MANDYA MYSORE RAICHUR RAMANAGARA SHIMOGA TUMKUR UDUPI U.KANNADA YADGIR STATE
42 34 No. District ANNEXURE - 5 (contd) SOURCEWISE AREA IRRIGATED IN KARNATAKA, (Area in Hectares) Gross / Net area irrigated by (in Hectares) Tube / Bore Wells Lift Irrigation Other sources Total Gross Net Gross Net Gross Net Gross Net BAGALKOT BANGALORE(U) BANGALORE(R) BELGAUM BELLARY BIDAR BIJAPUR CHAMARAJANAGAR CHIKKABALLAPURA CHICKMAGALUR CHITRADURGA D.KANNADA DAVANGERE DHARWAD GADAG GULBARGA HASSAN HAVERI KODAGU KOLAR KOPPAL MANDYA MYSORE RAICHUR RAMANAGARA SHIMOGA TUMKUR UDUPI U.KANNADA YADGIR STATE
43 35