Comparing Relative Risk of Producing Malting Barley
|
|
|
- Jasper Watts
- 5 years ago
- Views:
Transcription


1 Comparing Relative Risk of Producing Malting Barley Steven Edwardson Executive Administrator North Dakota Barley Council West Fargo, North Dakota Great Lakes Hop & Barley Conference March 13, 2018 Kalamazoo, MI
2 Overview TRENDS Review malt barley production and market trends in the U. S. FACTORS Outline the factors growers utilize in crop enterprise selection. RISK Identify and quantify risks of producing malting barley in comparison with other crops. SHIFT Outline the shift from purchasing malting barley as a commodity to procuring it as an ingredient. OUTLOOK Summarize the outlook for U. S. barley production.
3 Barley Planting Trends U. S. barley growers have been planting barley at a declining rate since the mid 1980 s. Acreage peaked in the mid 1980 s at approximately 12 million acres. In recent years, acreage trends have been in the range of 2 to 3 million acres. Production area declined at a rate of 310,000 acres per year from
4 U. S. Barley Acreage Trends Barley area harvested (acres) in the U. S. from 1980 through Data Source: USDA National Ag Statistics Service.
5 Barley Production Trends Likewise, barley production has decreased in the U. S. since the 1980 s. Production peaked at approximately 600 million bushels in Today, production is the area of 150 to 200 million bushels.
6 U. S. Barley Production (Bushels) USDA National Ag. Statistics Service.
7 U. S. Barley Acres Harvested (in Millions of Acres) Period: Source: USDA-ERS
8 Barley Acreage Trends for National Barley Growers Association Member States Percent Area Planted (Acres) Change From STATE to 2017 Idaho 610, , , , , ,000-12% Maryland 60,000 75,000 70,000 50,000 50,000 50,000 0% Minnesota 115,000 90,000 75, ,000 95,000 80,000-16% Montana 900, , , , , ,000-22% North Dakota 1,060, , ,000 1,120, , ,000-30% Oregon 56,000 63,000 50,000 49,000 45,000 47,000 4% Washington 185, , , , ,000 95,000-14% 2,986,000 2,833,000 2,450,000 3,069,000 2,630,000 2,092,000 United States: 3,637,000 3,528,000 3,031,000 3,623,000 3,059,000 2,481,000-19% Minnesota % of U. S.: 3% 3% 2% 4% 3% 3% North Dakota % of U. S.: 29% 22% 20% 31% 24% 21% NBGA % of U. S. Acres 82% 80% 81% 85% 86% 84%
9 The Shift to Corn and Soybeans U. S. farmers shifted their crop production systems from wheat and barley to more corn and soybeans. New production regions in the northern plains (e. g. North Dakota) provided farmers with new crop enterprise opportunities in corn and soybeans. Easier production, less storage time, market risk management tools, faster inventory turning rates, and prompt payment on delivery impacted the shift from malting barley to corn and soybeans.
10
11
12

13
14 Area Harvested (acres) for Selected U. S. Crops (Data Source: USDA-NASS)
15 Area Planted (acres) to Selected Crops in North Dakota Data Source: USDA-NASS
16 Barley Utilization and Distribution Historically, the majority of U. S. barley production was utilized in animal feed. As improvements in genetics allowed corn to be produced in new regions, livestock producers shifted from barley to corn as a source of animal feed. The decline in barley acreage resulted in less production from which malting companies could select barley for malting and brewing purposes. The rapid decline in barley production caused the malting and brewing industry to shift its barley acquisition strategies from open market purchasing to contracting malting barley as a specialty crop.
17 Understanding the Barley Utilization Shift The following chart assists in understanding the shift in barley utilization. Barley utilization in livestock feed (the red line) declined from a peak of approximately 310 million bushels in 1981 to approximately 50 million bushels in Barley exports (the green line) were largely for livestock feed. Less barley used in feed in the U. S. translated to less supplies for the export market. The blue line is largely production utilized in malting and brewing. Efficiencies in malting and brewing have assisted in generally consistent use of approximately 150 million bushels per year. A brief surge in feed barley exports to Japan in 2007 and 2008 largely forced the malting and brewing industry to develop a new procurement strategy for malting barley.
18 Trends in Barley Utilization and Distribution in the U. S. Million Bushels USDA-ERS Feed Grains Database
19 How Growers Decide Which Crops to Plant Crop production is very similar to other manufacturing processes. There are two key components in any manufacturing business. Turning inventory. Generating cash flow. Growers have chosen to produce less malting barley for the following reasons: There are many other choices of crops to plant. The risk of not achieving the malting barley price is too great. Corn and soybeans are easier to store, market, and sell. Corn and soybeans offer less downside risk and greater upside profit potential. Lending institutions consider barley to be too risky.
20 Selecting a Crop Enterprise The North Dakota Barley Council utilized a grower focus group to outline crop selection decision factors. Two general categories in crop selection were identified. Crop quality factors. Crop business management factors. Growers identified specific factors in each category for malting barley, corn, soybeans, and spring wheat.
21 Crop Quality Factors Corn and soybeans. Test weight (bulk density) and moisture content. Malting barley. Bulk density, germination, mycotoxins, plump kernels, protein, heat damage, frost damage, sprout damage, moisture. Malting barley is the only crop that must be delivered in a living state.
22 Crop Business Management Factors Profitability. Storage. Length of time crop is stored on the farm, requirements for maintaining integrity of the stored crop, and storage costs. Price transparency. Malting barley does not have a futures market, thus making price discovery more challenging. Availability of crop insurance for risk management. Impact on cash flow (e. g. timeliness of sales and payments). Banker support. Some bankers consider malting barley to be too risky. Crop management intensity. Barley fields must be continuously monitored for weed control, disease control, harvest timing, etc. Stored barley also needs to be monitored.
23 Scoring the Factors Growers scored the factors in each category. Score of 1 (green): easy to achieve. Score of 2 (orange): more difficult and requires more management. Score of 3 (red): very difficult and requires considerable skill and management. The result was a heat map that provided a color matrix of the grower decision process.
24 Heat Map Quality Factors HARD RED MALTING FACTORS UNITS SPRING WHEAT BARLEY CORN SOYBEANS Crop Quality Factors --Falling Numbers seconds Test weight (bulk density) lbs/bu Protein % Moisture % Germination % Mold in seed crease visual Deoxynavalenol (DON) ppm Heat damage % Frost damage % Sprout damage % Color visual Plump Kernels % TOTAL SCORE FOR QUALITY:
25 Heat Map: Business Management HARD RED MALTING Crop Business Management Factors UNITS SPRING WHEAT BARLEY CORN SOYBEANS --Gross margin $/acre Storage on farm NA Storage payments for on farm $/bu Price transparency NA Receipt of payment Days Banker support NA Crop insurance coverage $/acre Crop management intensity NA TOTAL SCORE FOR BUSINESS FACTORS: TOTAL SCORE:
26 Grower Focus Group Results Malting barley requires more management time and skill. Corn and soybeans are much easier to produce and sell, and are nearly idiot proof. The risk of malting barley production must be quantified to help buyers understand and compare risks between malting barley, corn, soybeans, and wheat.
27 QUANTIFYING CROP ENTERPRISE RISK What is the probability of malting barley being competitively profitable with corn, soybeans, and wheat? How do we measure downside risk? And conversely upside potential. Why should a grower plant malting barley? What is the risk reward scenario?
28 What is Downside Risk? Here is an Example Malting Barley Yield: 100 bushels per acre. Malt Barley Price: $4.00 per bushel Feed Barley Price: $2.00 per bushel Gross Revenue Comparison 100 bu/ac x $4.00/bu = $ per acre. 100 bu/ac x $2.00/bu = $ per acre. Difference between malt and feed: $ per acre. Downside risk is the probability of not achieving malt and thus selling at a price that cannot provide sufficient profitability (and likely will result in a loss). Can the grower afford to risk $ per acre. On 1000 acres, this is $200,
29 Modeling Comparative Risk The North Dakota Barley Council funded a project at North Dakota State University (NDSU) to quantify and compare the risk of producing malting barley in comparison with spring wheat, corn, and soybeans. The objective was to measure the variability in return to labor and management. (Yield x Price) Variable Costs = Return to Labor and Management (RLM). Variable costs include seed, fertilizer, weed control, disease control, and machinery costs. This level of comparison allows one to move from a static crop budget to a dynamic crop budget.
30 Risk Measurement Components Crop quality factors. Yield. Price. Return to labor and management. Crop insurance. This is the first time a project of this level of detail has been developed for malting barley.
31 Materials and Methods The project was conducted in 2013 and utilized crop enterprise budgets developed at NDSU, which focused on two regions in North Dakota. The north central region, where malting barley competes with corn, soybeans, and wheat, but corn is more difficult to produce. The central region, where corn and soybeans have largely displaced malting barley and other crops.
32 Materials and Methods Crop budget data was summarized in an Excel (an add-on program that works in Excel) was utilized to calculate all possible combinations of return to labor and management, thus quantifying the entire range of profit and loss potential.

33 YIELD, PRICE, AND QUALITY COMPONENTS OF COMPARATIVE RISK STUDY
34
35
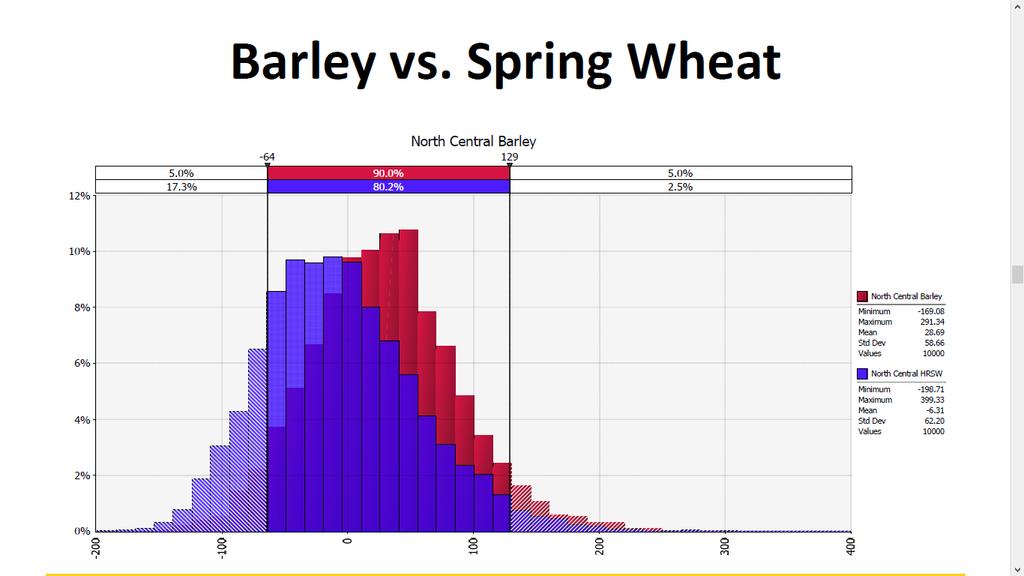
36 REGION: NORTH CENTRAL NORTH DAKOTA. MALTING BARLEY AND SPRING WHEAT UNDER PRESSURE FROM SOYBEANS AND CORN AGRICULTURAL STATISTICS DISTRICTS NORTH DAKOTA DIVIDE WILLIAMS NW BURKE MOUNTRAIL RENVILLE WARD BOTTINEAU MCHENRY ROLETTE TOWNER CAVALIER PEMBINA PIERCE RAMSEY NC NE BENSON WALSH NELSON GRAND FORKS GOLDEN VALLEY SLOPE BOWMAN BILLINGS SW MCKENZIE STARK DUNN HETTINGER ADAMS WC MCLEAN MORTON GRANT MERCER OLIVER SC SIOUX WELLS EDDY FOSTER GRIGGS STEELE TRAILL SHERIDAN BURLEIGH KIDDER STUTSMAN BARNES CASS CENTRAL EC EMMONS LOGAN LAMOURE RANSOM RICHLAND SE MCINTOSH DICKEY SARGENT Source: N.D. Agricultural Statistics

37 Malting barley has a higher mean and a lower standard deviation than spring wheat. However, spring wheat has higher upside profit potential (maximum of $ per acre vs $ per acre for barley).
, and also have lower potential for loss (-$141.14 per acre compared to -$154.")
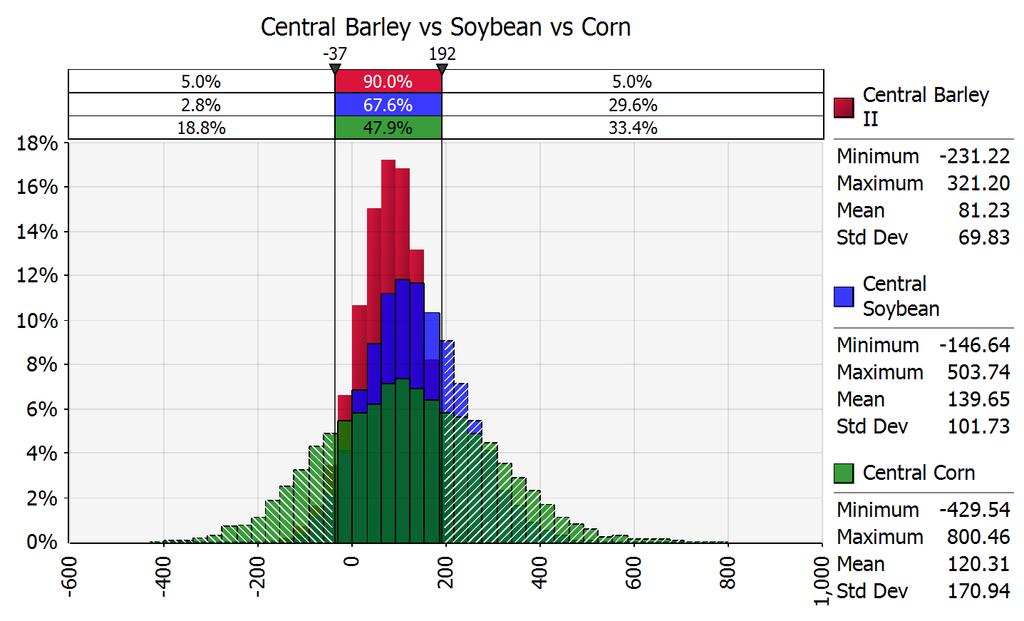
38 Malting barley has a lower mean than soybeans. Soybeans have a higher maximum profit potential ($ per acre compared with $ per acre for malting barley), and also have lower potential for loss (-$ per acre compared to -$ per acre for malting barley.

39 The average return per acre for malting barley and corn was very similar ($87.04 vs. $89.24). Corn had higher variability in profit, with a larger maximum profit potential ($ vs. $349.76).
40 REGION: CENTRAL NORTH DAKOTA. CORN AND SOYBEANS HAVE DISPLACED WHEAT AND BARLEY IN MUCH OF THIS REGION. AGRICULTURAL STATISTICS DISTRICTS NORTH DAKOTA DIVIDE WILLIAMS NW BURKE MOUNTRAIL RENVILLE WARD BOTTINEAU MCHENRY ROLETTE TOWNER CAVALIER PEMBINA PIERCE RAMSEY NC NE BENSON WALSH NELSON GRAND FORKS GOLDEN VALLEY SLOPE BOWMAN BILLINGS SW MCKENZIE STARK DUNN HETTINGER ADAMS WC MCLEAN MORTON GRANT MERCER OLIVER SC SIOUX WELLS EDDY FOSTER GRIGGS STEELE TRAILL SHERIDAN BURLEIGH KIDDER STUTSMAN BARNES CASS CENTRAL EC EMMONS LOGAN LAMOURE RANSOM RICHLAND SE MCINTOSH DICKEY SARGENT Source: N.D. Agricultural Statistics
41
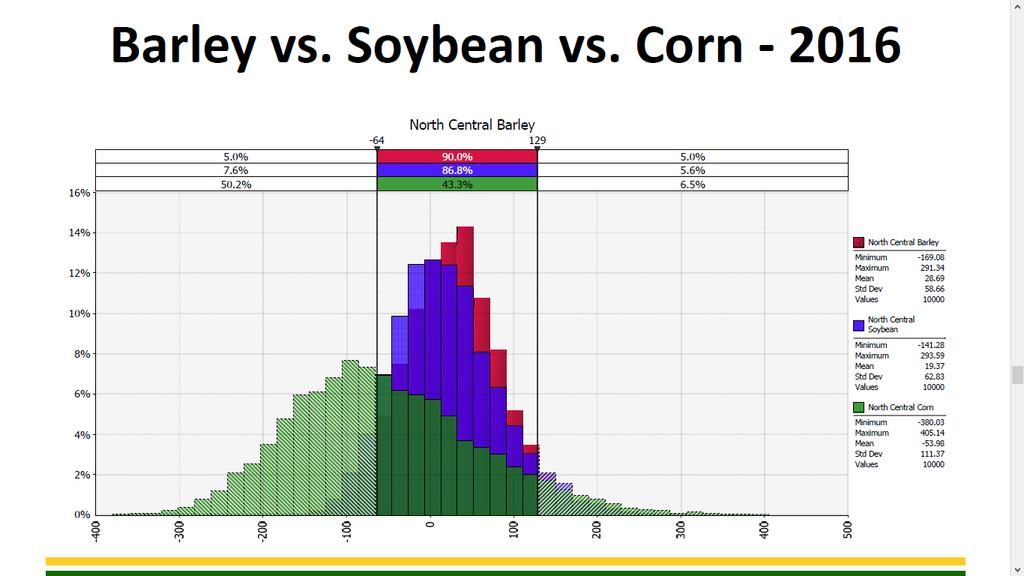
42 Fast Forward to 2016 Using the same procedures, did the overall risk scenario change with new market prices?

43 Yields and Prices for 2016 for North Central Region
44

45
46
47 OVERALL PROJECT RESULTS The relative risks of producing malting barley, spring wheat, corn, and soybeans, can be quantified and compared. Malting barley contracting programs implemented by the industry have helped stabilize production. Malt barley must be procured as an ingredient, not traded as a commodity.
48 PROCUREMENT SHIFT Malting barley contracting programs provide benefits to buyers and growers. Secure a base of malting barley production. Minimize volatility in purchasing. Developing long term business relationships with growers. Spread risk.


49 Have Malt Barley Contracting Programs Improved? Yes!
50 PROCUREMENT - CONTRACTING Malting barley is a specialty crop produced under contract and sourced as an ingredient. Buyers have implemented contracting procure malting barley from growers. Contract components include but are not limited to: Area produced (acres, hectares). Quantity produced (bushels, tons). Price and terms of payment. Best management practices (planting, fertilizer, etc.). Storage and delivery (when and where). Quality specifications (plump, protein, germination). Act of God (Force Majeure).
51 The Barley Buyer May or may not have a background in production agriculture. May not completely understand the number of crop choices available to growers. May consider buying barley is similar to purchasing other supplies and ingredients (e. g. packaging). How do we educate?
52 CROP INSURANCE A new crop insurance product for malting barley was deployed in Submitted to USDA Risk Management Agency (RMA) by ND Barley Council and Watts and Associates (a private insurance developer). The insurance product insures malting barley based upon malting industry purchasing practices. Cooperative effort between growers, industry, and crop insurance. Data for rating was provided by the malting industry. Crop insurance is vital for risk management and securing production.
53 Summary and Outlook Growers will raise malting barley under the following criteria. It must be profitable in comparison to corn, soybeans, wheat, and other crops. It must have crop insurance. It must provide an acceptable risk/reward scenario. U. S. buyers need to support growers with stable contract and delivery programs to maintain a consistent supply of malting barley.
54
55 THANK YOU
56 Follow-Up Education The North Dakota Barley Council can provide follow-up education on malting barley. Crop enterprise analysis (production costs & returns). Contracting production with growers. Crop insurance. Comparative risk evaluation with other crops. For further information Steven Edwardson, M. Sc. Executive Administrator North Dakota Barley Council 1002 West Main Avenue #2 West Fargo, ND Tel: Internet:
57 The North Dakota Barley Grower Area planted in ND: 520,000 Acres in 2017 (source: USDA-NASS) Number of growers: approximately 3,400 (source: USDA-FSA). Average acres per grower is approximately 155. Range: 80 acres to 3,000 acres. Other crops: corn, soybeans, wheat, canola, flax, lentils, sunflowers, etc.
58 Barley Basics Test weight (bulk density) 48 lbs/bu. 60 kg/hl. Average yield in North Dakota 57 bushels per acre (USDA NASS 15 year average). Average production per grower 150 acres x 57 bu/ac = 8,835 bushels (Approximately 9 semi-truck loads)