MARTINSON AG. March 29, 2018 WHEAT
|
|
|
- Earl Holt
- 5 years ago
- Views:
Transcription

1 MARTINSON AG March 29, 2018 WHEAT Wheat began the week by opening the overnight session with gains but slowly faded throughout the session to end the day lower in all three exchanges. Early support came from another weekend of disappointing rain in the Southern Plains as most of the rain was reported falling in the eastern regions of the winter wheat belt. Forecasts are calling for more rain systems to form in the next 10 days, but again all are expected to miss the winter wheat region. Light support came from reports Iraq bought 50 TMT of US wheat. But once the morning s disappointing export inspections estimate was released, wheat started it retracement, which proceeded to end the session. Expectations that the afternoon s Crop Progress report will show improving wheat conditions started the sell-off while technical pressure extended it. All of the wheat markets closed lower Tuesday on worries of increased spring wheat planted acres and improving winter wheat crop conditions. KS, OK and TX all saw a slight improvement in g/e ratings, although the overall crop conditions remain poor and there is little chance of rain for the southern Great Plains in the next 10 days. The states were rated: MT: 65% g/e, 31% fair, 4% p/vp (increase of 11% in March), CO: 39% g/e, 40% fair, 21% p/vp (increase of 6% in March), KS: 13% g/ex, 38% fair, 49% p/vp (increase of 2% from last week), OK: 9% g/e, 37% fair, 54% p/vp (increase of 4% from last week), and TX: 12% g/e, 25% fair, 63% p/vp (increase of 2% from last week). Wednesday s session saw the wheat markets all closing lower on forecasts for rain for the winter wheat regions and expected higher spring wheat planted acres in Thursday s report. Losses were also caused by a sharply higher US dollar. Early estimates for Thursday s Planting Intentions report has all wheat acreage at 46.3 million vs 46.0 million last year. Winter wheat acres are expected to be at 32.5 million vs 32.6 million in Jan and 32.7 million last year. Spring wheat acres are estimated at 11.5 million vs 11.0 million last year. Early estimates for the Quarterly Grains stocks report has all wheat stocks at BB vs BB last year. Thursday s USDA report were mixed for wheat as the Grain Stocks estimate was neutral while the acreage was bearish. Stocks were in line with expectations BB vs expectations of BB and BB last year. But wheat acreage was negative as not only did spring wheat acres come in higher than expected (an increase of million) but winter wheat acreage was also higher (100,000 acres) than USDA s January acreage estimate. ND producers are looking at increase spring wheat acres by 1.05 million while MN producers are looking at planting 440,000 more acres. May MW support is at $5.90 while resistance is at $6.35. Last week s wheat export shipments pace was estimated at 10.2 MB and sales were at MB. After 42 weeks, wheat shipments were at 77% of USDA s expectations (vs 98% last year) while sales are at 91% of expectations (vs 5-year average of 93%). With 10 weeks left in wheat s export marketing year, shipments need to average 21.0 MB and sales need to average 8.7 MB to make USDA s projection of 925 MB. For the week, May MW was at $5.785, down cents, May Chicago was at $4.51, down 9.25 cents, and May KC was at $4.6725, down 12 cents.

2 CORN Corn started the week by opening the overnight session higher and trading with gains throughout the overnight session. But just as was the case in the other grains, corn lost its gains going into the close and ended lower. Early support came from another week of disappointing rains in Argentina as well as from in the Southern Plains. Meanwhile the Delta and southern Corn Belt regions get soaked, which in turn will delay planting progress slightly. Brazil is reporting corn harvest at 43% complete vs 52% average. Argentina s production estimate saw another drop as officials are now estimating the crop at 32 MMT vs USDA s 36 MMT. Reports have China s ethanol imports at 52 million gallons with 50 million coming from the US, the highest amount imported since May Late session pressure spilled over from the lower wheat and soybean complex with light pressure coming from the morning s disappointing export inspection. On Tuesday, corn traded in a 4-cent range in an uneventful day and then closed unchanged. Corn planting in the southern US is running ahead of schedule with TX at 43% planted (vs. 33% average), AR at 18% (vs. 9% average), MS at 28% (vs. 17% average) and LA at 63% (vs. 46% average). The eastern Plains and Delta regions could receive 1 to 2 inches of rain in the next 10 days, which could slow planting progress. In Wednesday s session, corn finished near unchanged as the wait continues for fresh news from Thursday s USDA reports. Ethanol production for last week declined by 10,000 barrels per day to million barrels/day, while stocks dropped 41 million gallons to 957 million gallons. In export news, Taiwan purchased 65,000 MT of US corn in their last tender. New estimates for Argentina s corn crop are coming in at 29 to 31 MMT (vs. USDA s last estimate of 36 MMT) while Brazil s second crop corn is estimated at 63 MMT vs. 70 MMT last year. Early estimates for Thursday s Planting Intentions report has corn acreage at 89.4 million vs 90.2 million last year and 90.0 million for the Ag Outlook. Early estimates for the Quarterly Grains Stocks report has corn stocks at 8.7 BB vs 8.6 BB last year. Thursday s USDA report was mixed for corn. Corn s stocks estimate was higher than expected coming in at BB vs expectations of 8.71 BB and 8.62 BB last year. The net result, USDA will likely reduce corn demand in the next monthly crop production report. But the bearish stocks estimate was more than overshadowed by a friendly acreage estimate. Producers are expected to plant million acres of corn this year vs expectation of 89.4 million (1.39 million less) and million last year (2.1 million less). May corn support is at $3.63 while resistance is at $3.90. Last week s corn export shipments pace was estimated at 45.4 MB and sales were at 53.3 MB. After 29 weeks, corn shipments were at 41% of USDA s expectations (vs 79% last year) while sales were at 82% of expectations (vs 5-year average of 79%). With 23 weeks left in corn s export marketing year, shipments need to average 57.5 MB and sales need to average 17.2 MB to make USDA s projections of BB. For the week, May corn was at $3.8775, up 10.5 cents
 vs USDA s 47 MMT. Brazil is reporting soybean harvest at 65% complete vs 62% average.")
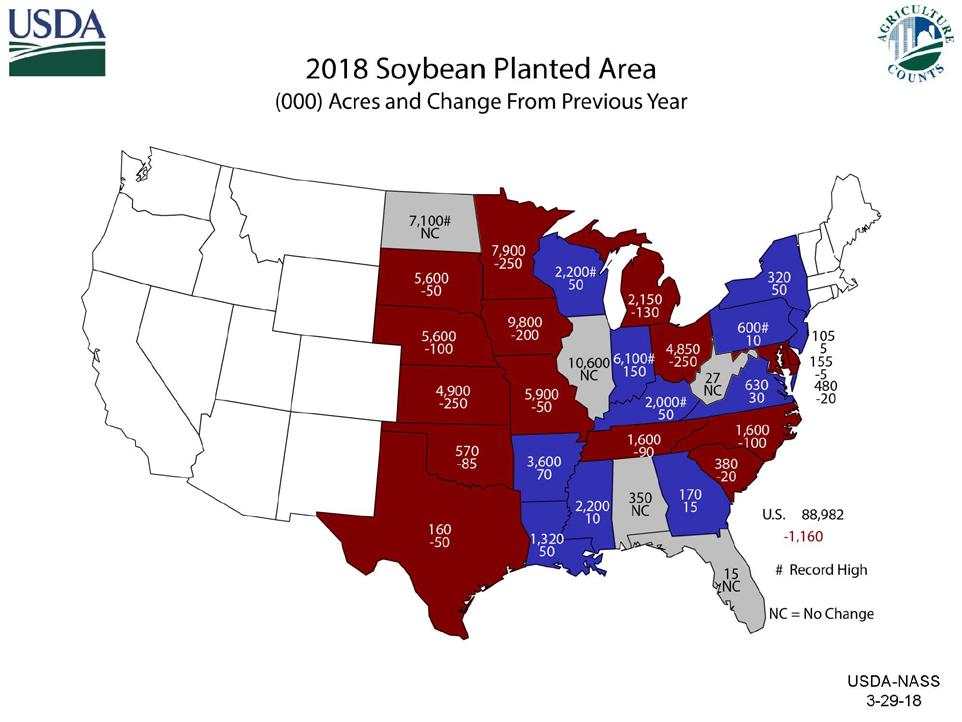
3 SOYBEAN Soybeans began the week by trading with solid gains in the overnight session with most of the strength coming from another disappoint rain event in Argentina. Argentina lowered their production estimate to 39.5 MMT (many are estimating it closer to 37 MMT) vs USDA s 47 MMT. Brazil is reporting soybean harvest at 65% complete vs 62% average. US soybean exports to China for the month of Feb were down 24% vs last year while Brazil s exports to China saw a 154% increase. In other export news, an unknown destination was in and bought 132 TMT of soybean overnight. Soybean s gains were short lived as once the day session started. Soybeans slowly started to retreat and once soybean meal turned lower, soybeans had no hope of holding gains. In Tuesday s session, soybeans closed lower on worries of increased US planted acres this spring and increasing estimates of Brazil s crop (which could break last year s record of MMT). Brazil is expected to export a record 72 MMT of soybeans this year, up from 68 MMT last year. Soybeans finished lower on Wednesday, with the new crop contracts seeing 4 cent losses on concerns that US planted acres will be higher in tomorrow s report. A Brazilian consultant has increased their soybean crop estimate to MMT, which if accurate would shatter last year s record of MMT. However, Brazil s increase is outweighed by the 15 to 20 MMT drop in Argentina s production vs. last year. Early estimates for Thursday s Planting Intentions report has soybean acreage at million vs 90.1 million last year and 90.0 million for the Ag Outlook. Early estimates for the Quarterly Grains Stocks report has soybean stocks at 2.03 BB vs 1.7 BB last year. larger than corn for 2018, but much lower than expected and bullish soybeans. May soybean support is at $10.15 and resistance is at $ Last week s soybean export shipments pace was estimated at 21.5 MB and sales were at 11.7 MB. After 29 weeks, soybean shipments were at 73% of USDA s expectations (vs 85% last year) while sales were at 90% of expectations (vs 5-year average of 93%). With 23 weeks left in soybean s export marketing year, shipments need to average 24.6 MB and sales need to average 9.3 MB to make USDA s projections of BB For the week, May soybeans were at $ , up 16.5 cents. May soybean meal was at $ up $6.10. Thursday s USDA reports were mixed for soybeans as well. Soybean stocks are estimated at 2.11 BB vs expectations of 2.03 BB (77 MB more) and 1.74 BB last year (368 MB more). The biggest surprise in USDA s reports came in the acreage estimate. Soybean acres are expected to drop compared to last year. USDA put soybean acres at million acres vs expectations of million (2.07 million less) and million last year (1.16 million less). Soybean acreage is still

 added selling.")
4 CATTLE Live cattle started the week by trading on both sides of the fence, but then recovered to trade with decent gains and looked to close in a perfect recovery. But once cattle traded to resistance, sell orders were triggered which pushed cattle back into the red. Early selling was tied to Friday s negative COF report, which continues to show larger than expected placements. Expectations that beef supplies are going to see a huge increase in the second quarter of 2018 (which starts next week) added selling. Lower boxed beef prices and the lack of a cash trade added to the selling pressure. In Tuesday s session, live cattle saw strong gains early in the session, but then slipped to close with just minor gains due to the light volume in the cattle markets. Cash trade continued to be quiet on Tuesday. Cattle closed with small gains on Wednesday. Technical buying helped to support the live cattle market. But gains were kept in check by a softer cash market as cash bids came in at $120 to $121, $5 lower than last week. The FCE Online Auction report no sales, 409 head were offered. Feeder cattle began the week by following the live cattle market and posting triple digit losses by the close. Early support came from technical buying as traders tried to correct an oversold market condition. But sell orders overwhelmed the market once feeders traded to minor resistance. On Tuesday, feeder cattle saw strong gains early in the session, but then slipped to close with just minor gains due to the light volume in the cattle markets. Wednesday s session saw feeder cattle trading higher across the board with most contracts getting support from technical buying as traders try and correct an oversold market condition. Light support spilled over from a lower grain complex. For the week, April live cattle was at $ down $2.30 while April feeders were at $ down $
5 CANOLA/SUNFLOWER Canola started the week by opening higher and trading with gains throughout the session. Early support spilled over from the higher US soybean complex. A lower Canadian dollar added to the support. But a late session sell-off in the US soybean complex trimmed gains late. In Tuesday s session, canola finished mixed with the May contract closing slightly higher on a weaker Canadian dollar and the deferred contracts closing lower along with the lower soybean market. Canola planted acres are expected to be higher this year. While US prospective planting numbers will be released on Thursday, Stats Canada s first survey-based estimates won t be out until the end of April. USDA is estimating 2018 canola acreage at 2.08 million acres, unchanged from last year. ND is expecting to plant 1.65 million acres of canola, up 4% from last year. All sunflower acreage is expected to drop 1% to million. ND is expecting to increase sunflower acres by 3%. May canola support is at $ while resistance is at $ Thursday s cash canola bids in Velva were at $18.14 and cash sunflower bids in Fargo were at $ For the week, May canola was up $3.10 at $ Canadian. On Wednesday, canola followed the soybean market lower in a light trading day. Expectations are that tomorrow s USDA planting intentions and ending stocks reports will be bearish canola. Losses were limited by weakness in the Canadian dollar. RECOMMENDATIONS 2016 Corn 2016 Soybeans 2016 Wheat 10% $4.08 5/25/16 15% $ /29/16 10% $5.05 9/23/16 20% $4.38 6/15/16 15% $9.95 4/20/16 20% $5.89 1/17/17 20% $3.65 1/17/17 20% $ /15/16 15% $5.65 5/1/17 25% $3.85 6/7/17 25% $ /17/17 20% $6.05 6/7/17 25% $3.64 2/7/18 25% $ /6/17 10% $6.35 6/14/17 100% $3.89 ave. 100% $10.39 ave. 75% 2017 Corn 2017 Soybeans 2017 Wheat 15% $3.95 4/13/17 10% $ /22/16 15% $5.65 5/1/17 10% $4.05 6/7/17 25% $ /12/17 10% $6.05 6/7/17 25% $3.64 2/7/18 40% $ /6/17 10% $6.35 6/14/17 15% $ /21/18 50% 90% 35% 2018 Corn 2018 Soybeans 2018 Wheat 15% $3.94 2/7/18 15% $ /6/17 15% $4.06 3/6/18 15% $ /21/18 15% $ /6/18 30% 45% 0%


6 CROP INSURANCE Production Hail: Production hail is designed to be coupled with your MPCI policy to cover the portion of the crop left unprotected by your MPCI policy. Sales closing and available crops vary by company, but in general you can choose a coverage factor of 100% to 120% of your APH yield. You can also choose a lower price percentage to lower the premium. You must have a hail loss to collect. Payment will be the lesser of the appraised hail loss or the actual harvested production. If the crop does rebound after the appraisal, your loss can be reduced. Losses cannot be paid until after harvest. Production Hail Example: Ransom county corn with a 165 APH at 75% RP 165 APH x 75% = 124 bu RP guarantee You can choose a percentage of the $3.96 price election to lower your premium. You will still have a loss trigger at 198 bushels. Production hail coverage in this scenario with $ of liability would cost $20.22/acre. Basic coverage at $ of liability would cost $12.89/acre. However, production hail pays out much faster see the chart below: % Loss Basic Payout Prod Hail 120% Payout 5 $14.70 $ $29.30 $ $58.60 $ $87.70 $ $ $ APH x 120% production hail factor = 198 bu loss trigger Production hail will cover the top 74 bushels only ( ). If you have an appraised hail loss and harvest less than 198 bu/ acre, you will receive a production hail payment. Production hail coverage = 74 bu x $3.96 RP price election = $ coverage Our office will be closed on Friday, March 30, since the markets will be closed for Good Friday. The markets will reopen Sunday evening. This material has been prepared by a sales or trading employee or agent of Martinson Ag Risk Management LLC. and is, or is in the nature of, a solicitation. This material is not a research report prepared by Martinson Ag Risk Management s Research Department. By accepting this communication, you agree that you are an experienced user of the futures markets, capable of making independent trading decisions, and agree that you are not, and will not, rely solely on this communication in making trading decisions. DISTRIBUTION IN SOME JURISDICTIONS MAY BE PROHIBITED OR RESTRICTED BY LAW. PERSONS IN POSSESSION OF THIS COMMUNICATION INDIRECTLY SHOULD INFORM THEMSELVES ABOUT AND OBSERVE ANY SUCH PROHIBITION OR RESTRICTIONS. TO THE EXTENT THAT YOU HAVE RECEIVED THIS COMMUNICATION INDIRECTLY AND SOLICITATIONS ARE PROHIBITED IN YOUR JURISDICTION WITHOUT REGISTRATION, THE MARKET COMMENTARY IN THIS COMMUNICATION SHOULD NOT BE CONSIDERED A SOLICITATION. The risk of loss in trading futures and/or options is substantial and each investor and/or trader must consider whether this is a suitable investment. Past performance, whether actual or indicated by simulated historical tests of strategies, is not indicative of future results. Trading advice is based on information taken from trades and statistical services and other sources that Martinson Ag Risk Management believes are reliable. We do not guarantee that such information is accurate or complete and it should not be relied upon as such. Trading advice reflects our good faith judgment at a specific time and is subject to change without notice. There is no guarantee that the advice we give will result in profitable trades
7 Summary of March 29, 2018 USDA Reports USDA March 1 US Grain Stocks (million bushels) USDA March Average Trade Estimate Change from Estimate Last Year Change from Last Year Corn 8,888 8, , Soybeans 2,107 2, , Wheat 1,494 1,498 (4) 1,659 (165) USDA 2018 Prospective Plantings (million acres) Corn - US (1.394) (2.141) Corn - ND (0.370) Corn - MN (0.550) Soybeans - US (2.074) (1.160) Soybeans - ND Soybeans - MN (0.250) All Wheat - US Spring Wheat - US Spring Wheat - ND Spring Wheat - MN Cotton Sorghum (0.003) Oats (0.043) Barley (0.365) (0.195) Rice (0.067) Total US Grains/Cotton (2.800) (0.700)

8
9
10
11