Performance of SE Cattle When Placed on Feed. Gary D. Fike Beef Cattle Specialist Certified Angus Beef LLC Manhattan, KS
|
|
|
- Clinton Roberts
- 5 years ago
- Views:
Transcription

1 Performance of SE Cattle When Placed on Feed Gary D. Fike Beef Cattle Specialist Certified Angus Beef LLC Manhattan, KS
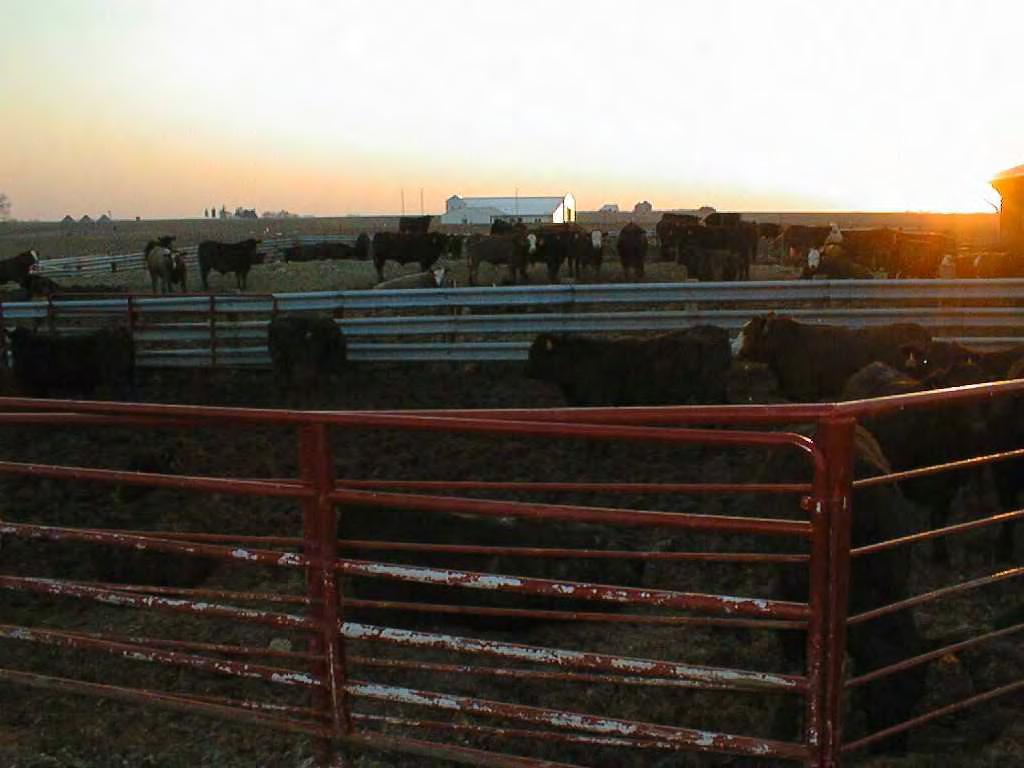
2 Tri-County Steer Carcass Futurity (TCSCF) First year 35 consignors steers What is the most profitable steer in the feedlot? Last 8 years, 50,270 steers and heifers from Iowa, South Carolina, Indiana, Georgia, Virginia, Alabama, Illinois, Kentucky, Mississippi, Tennessee, Minnesota, Florida, West Virginia, North Carolina, Missouri and Manitoba Ten member board has oversight of cattle fed at 10 different feedlots
3
4
5 SE vs. MW Cattle n=27,538 steers and heifers 15 states represented Midwest States - Iowa, Missouri, Indiana, Illinois, and Minnesota Southeast States - Georgia, Virginia, Alabama, South Carolina, Mississippi, Tennessee, Florida, North Carolina, West Virginia and Kentucky Consigned to the Iowa Tri-County Steer Carcass Futurity (TCSCF) from Minimum 28 day preconditioning period prior to feedlot delivery

6 Whose cattle are better: SE vs. MW?

7 Whose cattle are better: SE vs. MW?
8
9
10
11
12 Materials & Methods Cattle were fed at 10 different feedlots Fed a common dietary energy level Administered similar implant and health protocols Depending on distance hauled, vaccinated, weighed, implanted and body condition scored within 4 days of arrival Weighed on test after 28 to 35 days on feed Disposition scored 3 or 4 times Average Daily Gain (ADG) determined from initial weight (within 4 days of arrival) to harvest weight Feed to Gain (F:G) determined using the Cornell Net Carbohydrate Model
13 Materials & Methods Consignors submitted birth dates, breed of sire and breed of dam information Delivery value of calf determined by USDA AMS reporter in home state Feedlots recorded health treatments All death losses were posted by a veterinarian Cattle were harvested when visually evaluated to have 1 cm of external fat cover USDA and detailed carcass measures recorded
14 Effect of region of origin on ADG, Final Wt, Pulls & Death Loss Item Southeast Midwest No of Head 18,228 9,310 Arrival Wt, lb Delivery Age, days Final Wt, lb Overall ADG, lb 640 a a 1173 a 3.17 a 628 b b 1181 b 3.21 b Morbidity Rate Treatment Cost, $/hd Mortality Rate 15.22% c $5.01 c 1.43% c 20.76% d $7.38 d 1.76% d a b P<.001 c d P<.05
15 Effect of region of origin on Carcass Traits and Yield Grades Item Southeast Midwest No of Head 18,228 9,310 Hot Carcass Wt, lb Fat Cover, in Ribeye Area, sq in Calculated Yield Grade 723 a.44 a 12.2 a 2.84 a 727 b.43 b 12.4 b 2.78 b % Yield Grade 1 & 2 % Yield Grade 3 % Yield Grade 4 & a a 2.04 c b b 1.52 d a b P<.001 c d P<.05
16 Item Southeast Midwest Effect of region of origin on Quality Grade No of Head 18,228 9,310 % Prime % Choice % Select % Standard 1.14% 67.94% 28.33% 2.59% 1.01% 69.28% 27.22% 2.48% % CAB 21.57% a 19.02% b a b P<.001
17 Effect of region of origin on profit Item Southeast Midwest No of Head 18,228 9,310 Profit $/Hd $48.63 a $37.31 b a b P< Market value at home determined by USDA AMS Market Reporter - Trucking bill charged to each calf based on feedlot arrival weight - Value of dead cattle and expenses included in profit analysis
18 Summary In 27,538 calves originating from 15 states fed in 10 southwest Iowa feedlots SE calves compared to MW calves were: 1. Heavier on delivery to feedlot 11 lb. 2. Older on delivery to feedlot 71.4 days of age. 3. Fewer health treatments: 5.54% less. 4. % Choice or better was not different. 5. CAB acceptance was greater by 2.55% 6. Returns were greater by $11.32.
19 Southeastern Heifers Sourced from a salebarn Order for #2 Angus heifers; few mixed colored cattle in each load Shipped to High Plains feedlot 342 head 71.7% Choice & Prime 5.0%) 27.7% CAB ADG 2.9; F:G % YG 1-3 Avg ~ $ 52/hd over cash market; sold on packer grid
20 Best Management Practices Have No Boundaries Cow-calf producers who retain ownership are financially responsible for genetics, health and management of their calves Early adopters of genetic evaluation tools Utilize a team of advisors to adopt available technologies to improve calf health and performance Tired of someone else benefiting from their efforts in health and management Believe in working and sharing information with other producers
21 Effect of morbidity on final weight, feedlot gain and days on feed Number of treatments NT ST 2T No of Head 22,830 3,080 1,628 Arrival Wt., lb 641 a 613 b 608 b Final Wt., lb 1,181 a 1,155 b 1,142 c ADG, lb 3.21 a 3.06 b 2.95 c Days on Feed 170 a 179 b 183 c abc P<0.05
22 Effect of morbidity on carcass traits Number of treatments NT ST 2T Hot carcass wt 727 a 711 b 703 c Dressing % 61.5% a 61.3% b 60.9% b Fat cover, in.45 a.42 b.39 c Calculated Yield Grade 2.85 a 2.69 b 2.60 c % YG 1&2 58.4% a 68.4% b 73.7% c abc P<0.05
23 Effect of morbidity on quality grade Number of treatments NT ST 2T P Value % Prime 1.2% 0.6% 0.7% % Choice 70.3% 61.1% 52.7% < % Select 26.6% 34.5% 37.7% < % Standard 2.0% 3.9% 8.8% <0.0001
24 Effect of morbidity on treatment cost and mortality Number of treatments NT ST 2T Treatment cost $0.00 a $23.40 b $54.07 c Mortality Rate* 0.10% 5.49% 14.13% abc P<0.05 * Overall effect of morbidity on mortality rate P<0.0001
25 Difference in dollars returned per head relative to the number of treatments Number of treatments NT ST 2T Death loss discount *, $ PAR Treatment cost **, $ PAR ADG reduction #, $ PAR Yield grade premium, $ PAR Quality grade discount, $ PAR Light carcass discount, $ PAR Dark cutter adjustment, $ PAR Total difference, $ PAR * Accounts for cost of gain investment and lost carcass value. ** Includes medicine, labor and chute/equipment charges. # Based on additional carcass weight gained during the feeding period.


26 Lung Adhesions No Lung Adhesion Lung Adhesion
27 Carcasses with Lung Adhesions 25,861 carcasses did not have lung adhesions 1105 carcasses had lung adhesions 808 head were not treated in the feedlot 297 head were treated in the feedlot The tables compare carcasses without lung adhesions, carcasses with lung adhesions that were not treated and treated cattle with lung adhesions
28 Effect of lung adhesions on feedlot gain No Lung Adhesion Yes Not Treated Yes Treated No of carcasses 25, % of Carcasses 95.9% 3.0% 1.1% Arrival Weight ADG, lb Final Weight 1,179 1,163 1,145
29 Effect of lung adhesions on carcass traits No Lung Adhesion Yes Not Treated Yes Treated Hot Carcass Wt Dressing % 61.5% 60.7% 60.3% Fat cover, in % YG 1&2 60.1% 60.6% 75.4% Carcass value, $/hd $1,005 $966 $932
30 Effect of lung adhesions on quality grade No Lung Adhesion Yes Not Treated Yes Treated % Prime 1.1% 0.9% 0.0% % CAB 20.9% 17.0% 8.5% % Choice 68.7% 62.6% 52.5% % Select 27.8% 32.6% 40.4% % Standard 2.5% 3.96% 7.1%
31 Effect of lung adhesions on morbidity, treatment costs and profit No Lung Adhesion Yes Not Treated Yes Treated Morbidity rate 13.4% 0.0% 100.0% % untreated 86.6%% 100.0% 0.0% Treatment costs, $/hd $4.64 $0.00 $36.82 Profit $/hd $58.19 $27.16 $-22.37
32 Summary of Health Treatments Comparing 2T to NT cattle 1. Mortality and treatment costs increased with the number of treatments 2. Final weight was lighter by 40 lb % reduction in ADG more days on feed % points reduction in % Choice quality grade % points reduction in % CAB acceptance rate
33 Summary of Lung Adhesion Comparing carcasses with lung adhesions to none 1. Morbidity rate and treatment costs were higher % reduction in ADG % points reduction in % Choice quality grade % points reduction in % CAB acceptance rate

34

35