Table of Contents. Introduction 1. Agriculture in Montgomery County 3. Recommendations 33. Key Takeaways 22. Existing Local Food Promotion Programs 25
|
|
|
- Lesley Spencer
- 5 years ago
- Views:
Transcription


1
2
3 Table of Contents Introduction 1 Greater Philadelphia s Regional Food System 1 A Stakeholder-Based Planning Process 2 Agriculture in Montgomery County 3 History 3 Characteristics of Montgomery County Today 4 Land Use 4 Agricultural Analysis of Montgomery County 5 Land in Farms 5 Farm Characteristics 8 Operator Characteristics 9 Agriculture Industry 10 Farmland Preservation 19 Key Takeaways 22 Existing Local Food Promotion Programs 25 Buy Fresh Buy Local 25 Pennsylvania CSA Guide 25 PA Preferred 25 Direct from the Farm: A Guide to Buying Local in Montgomery County 26 Crave Montco 26 Challenges and Opportunities to Promoting Local Food in Montgomery County 27 Challenges 27 Lack of Identity as an Agricultural Community 27 Regulations 27 Lack of Distribution Networks 28 Lack of Processing Facilities 29 Lack of Access to Affordable Farmland 29 Opportunities 30 Increased Consumer Demand and Awareness of Local Food 30 Location, Location, Location 31 Increase in Intermediate Distribution Channels 31 Recommendations 33 Support a Vision for Local Food Procurement in Montgomery County 33 Encourage Local Food Procurement 33 Support Local Nurseries That Grow Native Plants 34 Create a County Food Policy Council 35 Coordinate Supply Chain Efforts 37 Convene Food System Stakeholders 37 Support Farm to Institution Within Montgomery County 39 Tap Into the Growing Craft Beer Scene 42 Draw on Fair Food's Grain Value Chain Efforts 43 Support Farmers Growing Malting Barley and Hops 46 Develop a Montco Local Ale Trail 49 Expand Local Food Promotion Efforts 50 Leverage Existing Promotional Programs 50 Buy Local Challenge/Buy Local Week 51 Implement a Montco Food Bucks Program 53 Recognize Local Food System Partners 54 Review County and Municipal Policies to Better Support Local Farmers 55 Promote Model Sign Ordinances 55 i
4 Develop Model Agritourism Zoning 56 Continue to Support Farmland Preservation Initiatives 57 Acknowledgments 61 Works Cited 63 Appendix 67 Stakeholder Analysis 67 Introduction 67 Purpose 67 Development of Questions 67 Methodology 67 Key Stakeholder Interviews 67 Interested Citizens Online Survey 69 Cover Image: Willow Creek Farm in Worcester Township, PA Source: Montgomery County Planning Commission ii
5 Table of Figures Figure 1: Number of Farms in Montgomery County, Figure 2: Average Farm Size in Montgomery County, Figure 3: Characteristics of Montgomery County 5 Figure 4: Montgomery County Land Use (2015) 6 Figure 5: Farms and Land in Farms 7 Figure 6: Detailed Types of Farmland in Montgomery County 7 Figure 7: Change in the Average Size of Farms in Montgomery County 8 Figure 8: Farms by Size in Montgomery County 8 Figure 9: Average Age of Principal Farmers 9 Figure 10: Farming as Primary Occupation 10 Figure 11: Number of Days Worked Off Farm 10 Figure 12: Market Value of Products Sold 11 Figure 13: Value of Sales by Commodity Group in Montgomery County 12 Figure 14: Proportion of Commodities Produced by Sales Within Montgomery County (2012) 13 Figure 15: Farms by Value of Sales in Montgomery County 13 Figure 16: Montgomery County Farms by NAICS Code (2012) 14 Figure 17: Selected Vegetable Production 15 Figure 18: Comparing Direct Sales 16 Figure 19: Direct Sales as a Percent of Total Sales 16 Figure 20: Comparing Selected Direct Sales Practices (2012) 17 Figure 21: Farm Income and Expenses 18 Figure 22: Sources of Farm-Related Income (2012) 19 Figure 23: Estimated Market Value of Land and Buildings ( Average per Acre) 30 Figure 24: Breweries and Distilleries in Montgomery County 44 Figure 25: Hop Production 48 Appendix Figure 1: Interview Respondents by Stakeholder Group 67 Figure 2: Advantages and Opportunities 68 Figure 3: Challenges 68 Figure 4: Recommendations 69 Figure 5: Where Do You Buy Local Food Products? 70 Figure 6: What Are The Top 3 Factors That You Consider When Shopping For Food? 70 Figure 7: How Much Would You Be Willing To Spend To Buy An Apple Grown In Montgomery County If A Non-Local Apple Costs $1 At Your Regular Grocery Store? 71 Figure 8: Annual Household Income 71 iii

6 Horses in Douglass, PA Source: Montgomery County Planning Commission
7 Introduction Eat Local Montco: Montgomery County s Local Food Promotion Strategy is based on the ongoing work of the Delaware Valley Regional Planning Commission (DVRPC) and the Montgomery County Planning Commission (MCPC). This strategy seeks to strengthen county farms, bolster the health and quality of life of county residents, and implement the county s comprehensive plan, Montco 2040: A Shared Vision, by promoting local food to county residents, institutions, and businesses. It analyzes the county s current agricultural and food system resources, acknowledging the challenges of local food production, distribution, and marketing, while at the same time making recommendations to strengthen local farms by linking local producers with local buyers, consumers, restaurants, and institutions. Greater Philadelphia s Regional Food System DVRPC, Greater Philadelphia s Metropolitan Planning Organization, is actively working to address critical food system issues in its nine-county region. In 2010, DVRPC published the Greater Philadelphia Food System Study, which evaluated the natural, economic, and social resources of Greater Philadelphia s foodshed: the 100-mile radius around Philadelphia that serves as the theoretical source of local food. Eating Here: Greater Philadelphia s Food System Plan, published in 2011, identified opportunities to further develop the FOOD SYSTEM regional economy, DVRPC defines a food system as: A set of strengthen the interconnected activities or sectors that grow, manufacture, transport, sell, prepare, region s agricultural and dispose of food from the farm to the sector, decrease plate to the garbage can or compost pile. 1 food waste and want, improve 1 Delaware Valley Regional Planning Commission, Municipal Implementation Tool #18 (Philadelphia: Delaware Valley Regional Planning Commission, April 2010). FOOD ECONOMY Many studies have found that supporting the local food sector can help to grow the local economy. Like the food system, the food economy is comprised of interrelated components that include both the production and consumption of food. In an attempt to define local food economy, Sustainable Seattle noted that, On the production side, [the food economy] consists of all businesses involved in the production, processing, distribution, and retailing (including restaurants) of farm and food products. On the consumption side, it includes households and institutions, such as hospitals, which feed people as part of what they do." 2 All of these actors spend money, either buying food or buying components along the food supply chain. On the production side, food producers employ people in the business of growing, distributing, and preparing food. Theoretically, the more money that can be spent locally from local farms to local restaurants the more money stays and circulates in the local economy. Looking more comprehensively, the New Haven Food Action Plan found that strengthening our local food economy will create jobs, encourage neighborhood development, and funnel much-needed dollars back into the community." 3 public health, protect the region s soil and water resources, and encourage collaboration. Eating Here included nine farming and sustainable agriculture recommendations, including supporting greater collaboration between local governments and farmers to ensure that communities maintain affordable farmland, adopt farm-friendly planning policies and zoning ordinances, improve the environment, and work toward food security and food system resiliency. 2 Viki Sonntag, Why Local Linkages Matter: Findings from the Local Food Economy Study, (Sustainable Seattle, 2008), Why-Local-Linkages-Matter.pdf. 3 New Haven Food Policy Council, New Haven Food Action Plan (New Haven, CT: New Haven Food Policy Council, 2012). 1

8 In 2015, DVRPC had the opportunity to apply its regional food system planning experience and expertise at the county level. DVRPC partnered with MCPC to develop Eat Local Montco, a strategy for supporting Montgomery County farms and food producers through market-based approaches. Supporting local farmers and food producers is good for Montgomery County because it will not only help to maintain Montgomery County s agricultural heritage and way of life, but it will also help to grow the local economy. The food system is an important part of the county s economy as local food production, preparation, and distribution offer entrepreneurial opportunities and keep money circulating in the local economy. By interviewing many different people, DVPRC collected information about other programs, initiatives, projects, and reports; gathered diverse recommendations; and detected gaps in research, support services, infrastructure, programs, and policies. This survey effort informed and shaped the subsequent research and strategies recommended in Eat Local Montco. Eat Local Montco is organized into four primary sections: Agriculture in Montgomery County, Existing Local Food Promotion Programs, Challenges and Opportunities to Promoting Local Food in Montgomery County, and Recommendations. A Stakeholder-Based Planning Process DVRPC began its planning process by performing a stakeholder analysis. The stakeholder analysis helped to provide a comprehensive and on-the-ground view of the food system landscape in Montgomery County. Between November 2015 and April 2016, DVRPC conducted 30 stakeholder interviews and held one focus group for farmers market managers. Additionally, 122 individuals completed an online survey that focused on consumer preferences and demand for local food (see Appendix for additional analysis). DVRPC selected individuals and organizations from all aspects of the food system and intentionally sought contacts from across the county s 67 municipalities. Interviewees included: Food System Partners; Farmers; Retailers; Restaurant Owners; Distributors; Manufacturers; Farmers' Market Managers; Institutions; and Interested Citizens. Erdenheim Farm Equestrian Center In Whitemarsh, PA Source: Montgomery County Planning Commission 2

9 Agriculture in Montgomery County Eat Local Montco provides an opportunity to review the history of agriculture in Montgomery County. It offers a chance to look back at where farming in Montgomery County has been, understand what it is like today, and consider what assets and opportunities exist to continue to support farming in Montgomery County in the future. Eat Local Montco will assist in identifying actions that the county, its partners, and broader food system stakeholders can take to sustain farming as an economically viable way of life in the county. History Montgomery County has a rich agricultural heritage that predates its founding in The area s first inhabitants, the Lenni Lenape Indians, were an agrarian people who raised corn, beans, and squash. 4 Early European settlers established farms to grow food not only for their families, but also to sell at markets both in Philadelphia and abroad. Montgomery County s proximity to Philadelphia, and the global markets its ports served, shaped early agricultural practices in Montgomery County and continues to play an important role in the county s food system today. In the 18th century, southeastern Pennsylvania farms, including those in Montgomery County, produced a wide variety of crops including wheat, rye, barley, oats, corn, potatoes, and hay. Wheat was an important export for the region, with local farmers selling their crops to Philadelphia mills, which then turned the wheat into flour to sell throughout the states and overseas. 5 With the growth of affluent customers in Philadelphia and the development of more well-maintained roads, cattle and dairy became one Decorated Red Barn, Lansdale, PA Source: Historic American Building Survey of the dominant products of Montgomery County farmers in the first half of the 19th century. In Agricultural Resources of Pennsylvania, c , the Pennsylvania Historical and Museum Commission notes, By 1860 Montgomery County led the state in total farm butter production (3 million plus pounds) and per-farm butter production (about 660 pounds). Towards the end of the 19th century, poultry farming became a more important part of the region s agricultural production with both Bucks and Montgomery Counties ranking at the top of the state in the number of commercial poultry farms. Additionally, hay remained an important crop for Montgomery County farmers throughout the 19th and 20th centuries. 4 Delaware Tribe of Indians, Foods Eaten by the Lenape Indians: Official Website of the Delaware Tribe of Indians," June 27, 2013, foods-eaten-by-the-lenape-indians/ (accessed September 6, 2016). 5 Pennsylvania Agricultural History Project, "Agricultural Resources of Pennsylvania, c : Southeastern Pennsylvania Historic Agricultural Region, c ," Pennsylvania Historical and Museum Commission, agriculture/files/context/southeastern_pennsylvania.pdf (accessed August 28, 2016). The 20th century brought many changes for farms both in Montgomery County and across the country. As shown in Figure 1: Number of Farms in Montgomery County, , the number of farms in Montgomery County dropped significantly after 1880, falling from over 6,000 farms in 1880 to just under 600 farms in Between 1850 and 1982 the 3

10 Figure 1: Number of Farms in Montgomery County, Number of Farms Source: Pennsylvania Agricultural History Project, USDA Census of Agriculture Historical Archive, USDA Census of Agriculture average farm size increased, growing from a low of 48 acres per farm in 1880 to a high of 101 acres per farm in 1982, before shrinking back to a size of 52 acres per farm in 2012 (see Figure 2: Average Farm Size in Montgomery County, ). For most of the 20th century the average farm size increased as farms became more and more specialized, even though the number of farms decreased. The increasing costs of farming, especially the higher cost of farmland, necessitated the expansion of remaining farms to take advantage of economies of scale and ensure a profit. Both of these changes are reflective of other, larger trends like technological advancements and suburbanization, which changed how and where people lived, and ultimately led to more development and less farming in historically rural communities. Characteristics of Montgomery County Today Today, Montgomery County is a very diverse county, with highly developed and densely populated communities located predominantly in the eastern portion of the county, and more rural, agricultural communities located in Figure 2: Average Farm Size in Montgomery County, Average Farm Size (Acres) Source: Pennsylvania Agricultural History Project, USDA Census of Agriculture Historical Archive, USDA Census of Agriculture the western half of the county. The American Community Survey reported that in 2014, over 800,000 people lived in Montgomery County, making it the third most populous county in Pennsylvania behind Philadelphia and Allegheny Counties. Montgomery County has a high population density, with over 1,675 people per square mile. This is nearly six times more dense than Pennsylvania as a whole, which has a population density of 285 people per square mile. See Figure 3: Characteristics of Montgomery County for additional information on land area and population. Land Use In 2015, the most common type of land use in Montgomery County was Residential Single Family Detached, which covered 27.5 percent of the county. Agriculture, which includes grassland, pasture and hay, and cultivated crops, was the third most common land use type, covering 15.4 percent of the county. Concentrations of agricultural land are located 4
11 Figure 3: Characteristics of Montgomery County 2014 Population (persons) Total Land Area (sq. miles) Population Density (persons per sq. mile) Total Agricultural Lands (sq. miles) Montgomery County Pennsylvania United States Montgomery County as part of Pennsylvania 809,372 12,758, ,107, % ,743 3,531, % 1, N/A 48 12,038 1,428, % CENSUS OF AGRICULTURE The USDA collects a great amount of agricultural data on a regular basis. These time-series data provide agronomists, farmers, policymakers, planners, and others with facts about the country s ever-changing and diverse agriculture industry. The first Census of Agriculture was conducted in 1840 as part of the decennial population census by the U.S. Department of Commerce s Bureau of the Census. In 1997, the USDA took over the collection and administration of the Census of Agriculture. Because the census has changed over time and terms have been redefined, previous data cannot always be compared to more recent data. For example, changes to the definition of land in farms now allows for acreage in farm stands, outbuildings, and wastelands to be included. This redefinition and inclusion of more acreage makes it appear that more land is currently in production than in previous census years. Number of Farms ,309 2,109, % Total Market Value of Agricultural Products Sold ($1,000) $25,594 $7,400,781 $394,644, % Source: USDA 2012, US Census 2010, American Community Survey, US Census 2014 around the central and northwestern portions of the county. Upper Hanover, Douglass, and New Hanover Townships have the greatest amount of agricultural land, with 4,770, 4,315, and 3,620 acres RESIDENTIAL SINGLE FAMILY DETACHED respectively. Large A zoning classification that generally areas of developed refers to a building designed for, and land are concentrated occupied exclusively as, a residence for only one family and having no party wall in along the Philadelphia common with an adjacent building. border and along the major transportation routes, such as I-76 and PA 309. See Figure 4: Montgomery County Land Use (2015) on page 6 for an illustration of Montgomery County s land use in Agricultural Analysis of Montgomery County Land in Farms According to the United States Department of Agriculture (USDA) 2012 Census of Agriculture, Montgomery County had 596 farms and 30,780 acres of land in farms, or land related to agricultural production (i.e., cropland, pastureland, orchards, and land under farm buildings). This is 123 fewer farms and 11,128 fewer acres of land in farms than the county had in This represents a 17 percent decrease in the number of farms and a 27 percent decrease in the land in farms during the five-year period. As shown in Figure 5: Farms and Land in Farms on page 7, Montgomery County experienced a loss of farms and farmland at a much greater rate than both the state and the country as a whole between 2007 and

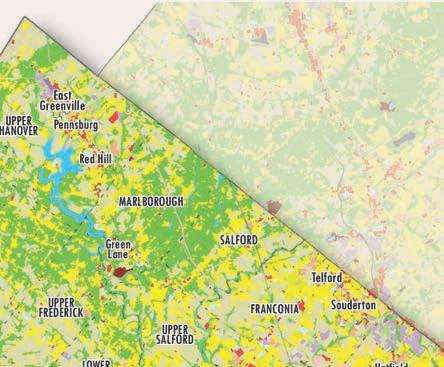
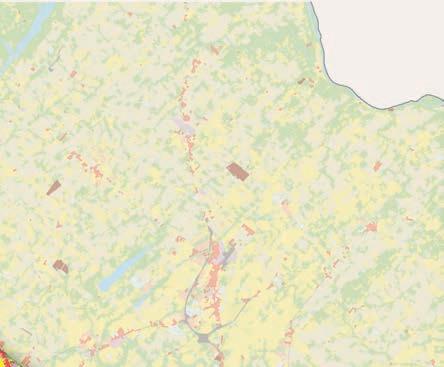
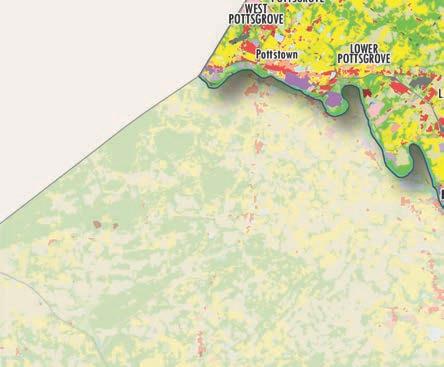
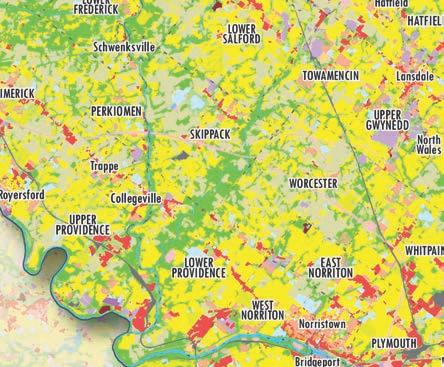
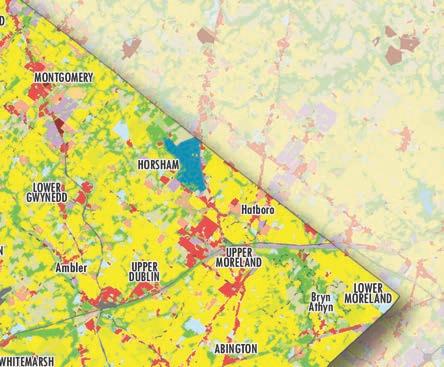
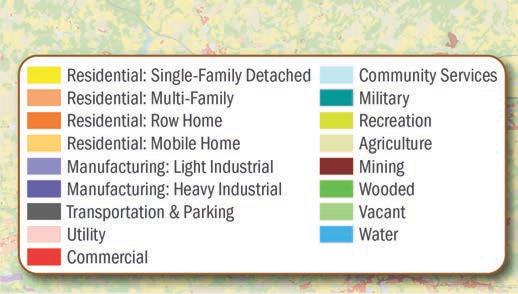
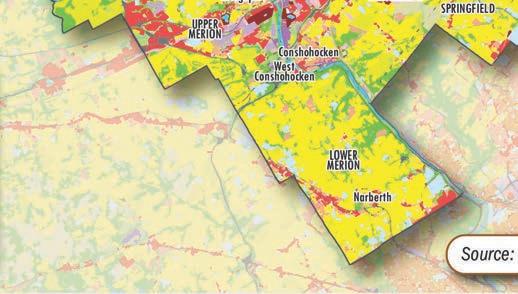
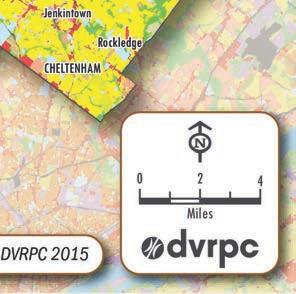
12 6 Figure 4: Montgomery County Land Use (2015)
13 Figure 5: Farms and Land in Farms Montgomery County Change from % Change Farms (number) % Land in Farms (acres) Pennsylvania 41,908 30,780-11,128-27% Farms (number) 63,163 59,309-3,854-6% Land in Farms (acres) United States 7,809,244 7,704, ,800-1% Farms (number) 2,204,792 2,109,303-95,489-4% Land in Farms (acres) Source: USDA 2012, ,095, ,527,657-7,568,183-1% The greater rate of decline is not surprising given Montgomery County s developed character and location within a major metropolitan area. Additionally, the loss of farms and farmland follows the historical trend that began in 1880 and continues today as land values, economic opportunity, and cultural preferences make farming less profitable and less attractive to subsequent generations of farmers. Types of Farmland The USDA s Census of Agriculture categorizes farmland into four broad and overlapping types: cropland, pastureland, woodland, and other uses, such as farmsteads, buildings, and wastelands (on-farm dumps, manure lagoons, spray fields, etc.). Montgomery County has more cropland (59 percent) than any other type of farmland, while the United States as a whole has almost equal amounts of pastureland and cropland. In Montgomery County, 16 percent of farmland is pastureland, 14 percent is woodland, and 11 percent is for other uses. Comparatively, the nation s farmland comprises 43 percent cropland, 45 percent pastureland, 8 percent woodland, and 4 percent for other uses. Figure 6: Detailed Types of Farmland in Montgomery County compares data from the 2007 Census of Agriculture to the 2012 Census. Notably, the amount of "land in farmsteads, buildings, etc." was the only category that increased between 2007 and Also of note is the relatively small decline in both "permanent pastureland" and "woodland pastureland." These comparatively small decreases may indicate that farmers are retiring and transitioning their land to less intensive uses. The large decreases in "harvested cropland" and "cropland used only for pasture" may also indicate land lost to development. Figure 6: Detailed Types of Farmland in Montgomery County Detailed Types of Farmland 2007 (acres) 2012 (acres) Absolute Change ( ) % Change ( ) Harvested cropland 20,997 16,516-4,481-21% Other cropland (idle, summer fallow, 4,033 1,735-2,298-57% failures) Cropland used only for pasture 3, ,116-88% Permanent pastureland 4,580 4, % Woodland not pastured 5,305 4,025-1,280-24% Woodland pastured % Land in farmsteads, buildings, etc. 3,185 3, % Source: USDA 2012,


14 Farm Characteristics In the last century, two significant changes occurred in agriculture: the increased practice of mechanized harvesting and government price supports. These two changes encouraged farm operators to increase the size of their farms to gain economic efficiencies and reduce the amount of farm labor needed. These changes also led to the concentration of agricultural production in fewer, larger farms. In 1935, the United States had 6.8 million farms. Today, there are 2.1 million farms. However, during this time, the average farm size nearly tripled, so that the average decrease in farmland was relatively small. Figure 1 and Figure 2 show that Montgomery County experienced a similar decline in the number of farms with a modest increase in farm size between 1850 and More recently, however, the county has experienced significant decreases in both the number of farms and the average size of farms. As shown in Figure 7: Change in the Average Size of Farms in Montgomery County, between 1997 and 2012, the average size of farms in Montgomery County decreased by 30 percent. In 2012, the average farm size in Montgomery County was 52 acres, but the median farm size was only 19 acres, which indicates that almost all of Montgomery County's farms are much smaller than the USDA average for a small family farm (see Farm Size on page 9). This small farm size is consistent with the fact that over 24 percent of Montgomery County s farms are smaller than 10 acres. That number continues to increase as the smallest category of farms (one to nine acres) grew by 15 percent between 2007 and 2012 (see Figure 8: Farms by Size in Montgomery County). The largest category of farms (1,000 to 1,999 acres) increased by 200 percent during this time period; however the absolute number of farms in this category only increased from one to three. This increase could be the result of the consolidation of smaller farm enterprises, or simply the result of differences in survey collection and response rates. Figure 8: Farms by Size in Montgomery County 1,000 OR MORE Figure 7: Change in the Average Size of Farms in Montgomery County TO TO Acres 50 TO TO 49 Acres TO Number of Farms Source: USDA 2012, Source: USDA 2012, 2007, 2002 The number of smaller-scale production farms that we more often associate with traditional family farms ranging from 10 to 179 acres in 8

15 FARM SIZE The USDA categorizes family farms as small, midsize, or large based on gross case farm income: Small: Less than $350,000 Midsize: Between $350,000 and $999,999 Large: More than $1,000,000 The USDA may also classify farms by acreage with small family farms averaging 231 acres, large family farms averaging 1,421 acres, and very large family farms averaging 2,086 acres. 6 6 Sources: 2012 Census of Agriculture: Farm Typology, Volume 2, Subject Series, Part 10: January 2015 and Mary Dunckel, "Small, Medium, Large - Does Farm Size Really Matter?" (Michigan State University Extension, November 14, 2013) size decreased by 24 percent. However, these small- to medium-scale row crop farms (such as corn and soybeans), vegetable farms, dairies, and orchards still make up the majority (69 percent) of Montgomery County s farms. Operator Characteristics While the number and size of farms in Montgomery County has declined in recent years, the average age of farmers has increased. According to the 2012 Census of Agriculture, the average age of principal operators in Montgomery County was 59.2, up from 58.8 in This is higher than the average age of principal farmers in surrounding counties, across the state, and across the country (see Figure 9: Average Age of Principal Farmers). The higher average age may be due in part to retired farmers holding onto their land as well as a lack of a new generation of farmers to take over existing farms. DVRPC s Greater Philadelphia Food System Study found that counties with more active agriculture communities may attract, support, and nurture new farmers through informal social and family structures or more formal new-farmer programs. Figure 9: Average Age of Principal Farmers Change % Change Berks County % Bucks County % Chester County % Lancaster County % Montgomery County % Pennsylvania % United States % Source: USDA 2012, 2007 Primary Occupation The loss in the total number of farms and the trend towards the consolidation of farms highlights the fact that it is increasingly difficult for farmers to make a living off of their farms. Many farmers work outside of the farm to supplement their farm income. Other farmers may choose to Lloyd Gottshall with bearded barley in Limerick, PA Source: Montgomery County Planning Commission 9

.")

16 farm as a lifestyle choice or hobby, and have no expectation of living off of their farm s income. In 2007, less than half of Montgomery County farmers listed farming as their primary occupation. However, as shown in Figure 10: Farming as Primary Occupation, 55 percent of Montgomery County farmers listed farming as their primary occupation in This represents an almost 30 percent increase in the percent of principal farmers who list farming as their primary occupation. Although this increase parallels both state and national trends, it is surprising since many Montgomery County farms struggled to make a profit (see Market Value of Products Sold on page 10). The increase may indicate that the remaining farmers are committed to farming as an occupation, and that farmers who could not support themselves through farming have moved on to other professions. Figure 10: Farming as Primary Occupation at farming or ranching, which still allows for the farmer to spend a significant amount of time working off the farm. In 2012, 59.2 percent of Montgomery County s principal farmers spent at least one day per week working off the farm. As seen in Figure 11: Number of Days Worked Off Farm, over 42 percent of Montgomery County farmers (252 principal farmers) spent over half the year working outside of the farm. Figure 11: Number of Days Worked Off Farm 200 DAYS OR MORE 100 TO 199 DAYS TO 99 DAYS UNITED STATES PENNSYLVANIA TO 49 DAYS NONE MONTGOMERY COUNTY 0% 10% 20% 30% 40% 50% Percent of Principal Farmers 0% 10% 20% 30% 40% 50% 60% Percent of Principal Farmers with Farming as a Primary Occupation Source: USDA 2012, 2007 Additionally, the census does not provide data on the occupation or income of farmers family members. Farmers family members often hold jobs outside of the farm, which help to subsidize the farm s income and provide additional benefits like health insurance. It is also worth noting that the USDA defines primary occupation as the operator spent 50 percent or more of his/her work time during 2012 Source: USDA 2012, 2007 Agriculture Industry Montgomery County s agriculture industry can be evaluated with several indices, including the market value of products sold, farms by sales, commodities produced, fruit and vegetable production, and farm-related income and expenses. Market Value of Products Sold Between 2002 and 2012, the value of crop and livestock production, adjusted for inflation, decreased by 44 percent in Montgomery County. 10
17 Figure 12: Market Value of Products Sold Absolute Change ( ) % Change ( ) Montgomery County $45,629,893 $32,986,425 $25,594,000 -$20,035,893-44% Average per Montgomery County Farm $62,593 $45,879 $42,943 -$19,650-31% Pennsylvania $5,481,715,344 $6,381,099,126 $7,400,781,000 $1,919,065,656 35% Average per Pennsylvania Farm $94,341 $101,026 $124,783 $30,442 32% United States $258,373,689,489 $326,503,311,505 $394,644,481,000 $136,270,791,511 53% Average per United States Farm $121,360 $148,087 $187,097 $65,737 54% Source: USDA 2012, 2007 During that same period, the value of production increased in both Pennsylvania and the United States by 35 and 53 percent, respectively (see Figure 12: Market Value of Products Sold). Several factors may have contributed to the decrease in market value of products sold in Montgomery County, specifically a decrease in farm size and a growth in hobby farms. Between 2007 and 2012, farms in Montgomery County got smaller, with the average farm shrinking from 58 to 52 acres. This may not seem like a large decrease, but farming is a land-intensive business that has slim margins for profitability. Reducing a farm s size, possibly from selling a portion of a farm property for development, can decrease the amount of crops or livestock a farm is able to raise, and thereby lessen the overall market value of products sold. Another trend that may have led to the decrease in market value is the growth of hobby or lifestyle farms. More people are living on large lots of five to 20 acres and maintain a preferential farmland tax assessment by operating small-scale agricultural activities. Most hobby farms are maintained without the expectation of being a primary or even secondary source of income and therefore tend to reduce the overall value of products sold. 7 Dollar figures are expressed in 2012 dollars, and have been adjusted for inflation based on the Bureau of Labor Statistic s Consumer Price Index for the Philadelphia Metro area. Montgomery County s top agricultural commodities in 2012 were: Nursery, greenhouse, and floriculture products (45 percent); Grains, oilseeds, dry beans, and dry peas (14 percent); Milk and other dairy products (8 percent); Cattle and calves (7 percent); and Other crops and hay (7 percent). This indicates that Montgomery County s agricultural area specializes in high-value products that can be grown on smaller farms located close to suburban markets, such as nursery crops. Figure 13: Value of Sales by Commodity Group in Montgomery County and Figure 14: Proportion of Commodities Produced by Sales Within Montgomery County (2012) illustrate this specialization. Some commodities, such as milk and other dairy products, and poultry and eggs, are generally raised closer to urban markets. Anecdotal research reports that dairy products tend to travel shorter distances (under 500 miles) from producers to markets than other commodities. Pennsylvania s agricultural industry concentrates on slightly different products than Montgomery County. In 2012, 27 percent of the total market value of products sold statewide was derived from milk and other dairy products, 18 percent from poultry and eggs, 16 percent from grain 11


18 Figure 13: Value of Sales by Commodity Group in Montgomery County 8 $16,000,000 $14,000,000 $12,000, $10,000,000 $8,000,000 $6,000,000 $4,000,000 $2,000,000 $0 Aquaculture Cattle and Calves Cut Christmas Trees, Etc. Fruits, Nuts, Berries Grains, Oilseeds, Dry Beans Hogs and Pigs Horses, Ponies, Etc. Milk and Other Dairy Products Nursery, Other Other Crops Greenhouse, Animials and and Hay Etc. Other Animal Products Poultry and Eggs Vegetables, Melons, Etc. Source: USDA 2012, 2007 production, 13 percent from nursery, greenhouse, and floriculture products, and 10 percent from cattle and calves. 8 Dollar figures are expressed in 2012 dollars, and have been adjusted for inflation based on the Bureau of Labor Statistic s Consumer Price Index for the Philadelphia Metro area. When comparing Montgomery County to Pennsylvania, it is important to note that Montgomery County has only 0.4 percent of the state s agricultural lands, about 1 percent of the state s farms, and produces 0.3 percent of the state s market value of agricultural products. Montgomery County, by market value, produces 2.7 percent of the state s horses and 12
19 ponies, 1.2 percent of nursery, greenhouse, and floriculture products, and 0.7 percent of vegetables, melons, potatoes, and sweet potatoes. This indicates that these three categories account for a greater percentage of Montgomery County's overall agricultural production than in other parts of the state. Figure 14: Proportion of Commodities Produced by Sales Within Montgomery County (2012) 7% 1% 3% 4% 7% 2% 2% $499,999, as compared to 15 percent of all Pennsylvania farms. These farms typically represent successful family farms. Less than two percent of all Montgomery County farms and about five percent of all Pennsylvania farms reported sales of $500,000 or more. These farms may be extremely large family farms or corporate farms. See Figure 15: Farms by Value of Sales in Montgomery County for a more complete breakdown. Figure 15: Farms by Value of Sales in Montgomery County $500,000 OR MORE 45% 8% 14% 4% 4% Annual Value of Products Sold $100,000 TO $499,999 $50,000 TO $99,999 $25,000 TO $49,999 $10,000 TO $24,999 $5,000 TO $9,999 2,500 TO $4, Aquaculture (1%) Horses, Ponies, Etc. (4%) LESS THAN $2,500 Cattle and Calves (7%) Milk and Other Dairy Products (8%) Cut Christmas Trees, Etc. (2%) Nursery, Greenhouse, Etc. (45%) Number of Farms Fruits, Nuts, Berries (2%) Other Crops and Hay (7%) Source: USDA 2012, 2007 Grains, Oilseeds, Dry Beans (14%) Poultry and Eggs (3%) Hogs and Pigs (4%) Vegetables, Melons, Etc. (4%) Source: USDA 2012 Farms by Value of Sales In both Pennsylvania and Montgomery County, the overwhelming majority of farms gross less than $50,000 a year in sales. About 85 percent of Montgomery County farms reported gross sales of less than $50,000 in Only 6.5 percent reported sales between $100,000 and Commodities Produced The USDA also categorizes farms by North American Industrial Classification System (NAICS) codes. While many farms grow and sell different agricultural products falling into several NAICS codes, farms only self-identify as one NAICS code, usually the code with the highest sales. Although we cannot see how diversified a given farm may be, we can see how diversified Montgomery County is. 13

20 Figure 16: Montgomery County Farms by NAICS Code (2012) shows that 27 percent of the county s farms are engaged in animal aquaculture and other animal production, which includes the raising of bees, horses and other equine, and rabbits and other fur-bearing animals. This is not surprising as there are a number of horse farms and stables in Montgomery County. Over 18 percent of Montgomery County farms specialize in greenhouse, nursery, and floriculture production. In addition to more standard floriculture and horticulture production, this category also includes the large-scale production of fruits and vegetables in greenhouses as well as Christmas trees. Other crop farming, which constitutes over 17 percent of Montgomery County farms, is defined as establishments primarily engaged in (1) growing crops such as tobacco, cotton, sugarcane, hay, sugar beets, peanuts, agave, herbs and spices, and hay and grass seeds, or (2) growing a combination of the valid crops with no one crop or family of crops accounting for onehalf of the establishment s agricultural production. Crops not included in this category are oilseeds, grains, vegetables and melons, fruits, tree nuts, greenhouse, nursery, and floriculture products. Based on this definition and the lack of tobacco and cotton sales, other crop farming in Montgomery County is probably comprised of mostly hay farms. Figure 16: Montgomery County Farms by NAICS Code (2012) Flowers at the Ambler Farmers' Market Source: Montgomery County Planning Commission Commodities by NAICS Code Number of Farms Proportion of Montgomery County Farms Oilseed and grain farming (1111) % Vegetable and melon farming (1112) % Fruit and tree nut farming (1113) % Greenhouse, nursery, and floriculture production (1114) % Other crop farming (1119) % Beef cattle ranching and farming (112111) % Cattle feedlots (112112) 0 0.0% Dairy cattle and milk production (112120) % Hog and pig farming (1122) 7 1.2% Poultry and egg production (1123) % Sheep and goat farming (1124) % Animal aquaculture and other animal production (1125, 1129) % Montgomery County Total % Source: USDA 2012 Fruit and Vegetable Production Much of the discussion about local food centers on the production, distribution, sale, and consumption of fruits and vegetables. Fruit and vegetable producers of various sizes and different agricultural practices tend to engage in direct marketing more than any other type of 14

21 producer, and therefore may be the most visible producers in the local food marketplace. However, these farmers make up only 7.8 percent of Montgomery County farms, based on NAICS code, and only 12 percent of all farms reporting any fruit and vegetable production. Between 2007 and 2012, Montgomery County lost over half of its land used for vegetables, falling from 712 acres in 2007 to 303 acres in Two types of vegetables saw the majority of the lost acreage: sweet corn and pumpkins (see Figure 17: Selected Vegetable Production). Although, they collectively accounted for 87 percent of the reduction in acreage in vegetable production, both sweet corn and pumpkins remain the most popular vegetables in production in Montgomery County. Together they comprised 68 percent of all acres harvested in Figure 17: Selected Vegetable Production WATERMELONS POTATOES 2007 ALL OTHER VEGETABLES 2012 CUCUMBERS BELL PEPPERS SQUASH, ALL SNAP BEANS TOMATOES IN THE OPEN PUMPKINS SWEET CORN Acres Source: USDA 2012, 2007 Less detailed information is available for fruit production. In 2012, 17 farms reported a total of 120 acres of land in orchards. In 2007, the county had 247 acres in orchards, a loss of 126 acres. In 2012, over half of all of Montgomery County s orchard land was in apple trees (70 acres). Grapes, which have increased in popularity over the last 20 years as many growers have become winemakers, account for 5 farms and 13 acres of vines. As is more common for counties closer to urban areas, Montgomery County grows considerably more produce for fresh market than for processing. In 2012, 299 of the 303 acres of land used for vegetables were harvested for fresh market. Fresh market vegetables may end up at a farmers market or may be sold to a produce wholesaler, who may then sell to a supermarket chain or restaurant. Direct Sales Direct sales, sometimes referred to as direct marketing, are one way that producers get their products to a market. Direct sales can yield more income to producers by eliminating third-party distributors. As evidenced by popular media coverage and the increases in Community Supported Agriculture (CSA) operations and farmers markets, a significant segment of consumers is increasingly interested in purchasing food directly from the producer. In 2012, Montgomery County farmers sold $1.35 million worth of product through direct sales. This constituted 5.3 percent of all of the county's agricultural sales in 2012 and was an increase of 47 percent in the total DIRECT SALES The USDA refers to direct sales as agricultural products sold directly to individuals for human consumption and defines it as the value of products sold from roadside stands, farmers markets and pick-yourown sites. Nonedible products, such as flowers, wool, or plants, are excluded. Additionally, sales from vertically integrated operations that do their own processing and marketing are also excluded. 9 9 USDA, 2012 Census of Agriculture Appendix B: General Explanation and Census of Agriculture Report Form 15

22 value of direct sales from 1992, adjusting for inflation. Most of the surrounding counties saw similar increases in direct sales during this 20 year period; however only Bucks and Montgomery Counties experienced steep increases in 2007 and steep declines in 2012 (see Figure 18: Comparing Direct Sales). Additionally, even though Lancaster had the highest amount of direct sales year over year, direct sales constituted a greater percentage of total sales for both Bucks and Montgomery Counties (see Figure 19: Direct Sales as a Percent of Total Sales:) indicating that although small, direct sales are still an important part of farm income for Montgomery County farmers. Figure 18: Comparing Direct Sales 10 Total Value of Direct Sales $12,000,000 $10,000,000 $8,000,000 $6,000,000 $4,000,000 Figure 19: Direct Sales as a Percent of Total Sales Change ( ) Berks County 0.9% 0.7% 0.8% -0.2 Bucks County 2.6% 3.9% 6.1% 3.5 Chester County 0.7% 0.8% 0.6% -0.1 Lancaster County 0.7% 0.9% 0.8% 0.1 Montgomery County 2.0% 2.8% 5.3% 3.3 Pennsylvania 1.0% 1.3% 1.2% 0.2 Source: USDA 1992, 2002, 2012 all Montgomery County farms market their products directly to retail outlets and 1.3 percent market their products through CSAs. Another 5.9 percent of Montgomery County farms produced and sold value-added commodities like cheese, fruit jams, bottled milk, and wine. While this is a relatively small percentage of Montgomery County farms, it represents a larger percentage of total farms than at the statewide level. The higher percentage is to be expected as farms in Montgomery County are generally closer to urban markets and therefore, retail and CSA customers. $2,000,000 $ Dollar figures are expressed in 2012 dollars, and have been adjusted for inflation based on the Bureau of Labor Statistic s Consumer Price Index for the Philadelphia Metro area. Berks County Chester County Bucks County Lancaster County Source: USDA 2012, 2007, 2002, 1997, 1992 Montgomery County Figure 20: Comparing Selected Direct Sales Practices (2012) on page 17 provides more details on the different direct marketing practices that farms in each of the selected counties and the state use. 5.9 percent of 10 Dollar figures are expressed in 2012 dollars, and have been adjusted for inflation based on the Bureau of Labor Statistic s Consumer Price Index for the Philadelphia Metro area. Ambler Farmer's Market Source: Montgomery County Planning Commission 16

23 Figure 20: Comparing Selected Direct Sales Practices (2012) Marketed Products Directly to Retail Outlets Produced and Sold Value-added Commodities Marketed Products Through CSAs Number of Farms in Berks County Percent of All Berks County Farms 14.2% 6.3% 6.6% Number of Farms in Bucks County Percent of All Bucks County Farms 8.7% 9.4% 2.3% Number of Farms in Chester County Percent of All Chester County Farms 5.7% 5.3% 1.9% Number of Farms in Lancaster County Percent of All Lancaster County Farms 6.0% 5.2% 1.6% Number of Farms in Montgomery County Percent of All Montgomery County Farms 5.9% 5.9% 1.3% Number of Farms in Pennsylvania 2,379 3, Percent of All Pennsylvania Farms 4.0% 5.3% 0.9% FARM INCOME CATEGORIES The Census of Agriculture collects data on a number of income sources for farmers, including Market Value of Projects Sold, Government Payments, and Farm-Related Income: Market Value of Products Sold: This category represents income earned from the sale of agricultural products, including direct sales. Government Payments: The USDA notes that "government payments to farmers include conservation payments, direct payments, loan deficiency payments, disaster payments, and payments from other federal programs." Farm-Related Income: The USDA defines farm-related income as "payments received for rent, custom work on other farms, forest product sales, recreational services provided, patronage dividends, crop and livestock insurance payments, and other activities and services closely related to the agricultural operation." USDA, 2012 Census Highlights: Farm Economics - Record High Agricultural Sales; Income and Expenses Both Up, ACH12-2, May Source: USDA 2012 Farm Income and Expenses In 2012, Montgomery County farms sold $25.6 million in agricultural products and incurred $33 million in production expenses. Between 2007 and 2012, income from sales decreased by 22 percent, adjusted for inflation, while production expenses decreased at a slightly slower rate of 19 percent. See Figure 21: Farm Income and Expenses on page 18 Income and Expenses for more detail. Squash at the Lansdale Farmers' Market Source: Montgomery County Planning Commission 17
24 Figure 21: Farm Income and Expenses % Change Market Value of Products Sold Production Expenses Government Payments Received Farm-Related Income Net Cash Income All Montgomery County Farms $32,986,425 $25,594,000-22% Average per Montgomery County Farm $45,879 $42,943-6% All Pennsylvania Farms $6,381,099,126 $7,400,781,000 16% Average per Pennsylvania Farm $101,026 $124,783 24% All Montgomery County Farms $40,613,465 $33,088,000-19% Average per Montgomery County Farm $56,486 $55,517-2% All Pennsylvania Farms $5,392,765,282 $6,041,767,000 12% Average per Pennsylvania Farm $85,378 $101,869 19% All Montgomery County Farms $261,448 $293,000 12% Average per Montgomery County Farm $2,901 $4,655 60% All Pennsylvania Farms $83,460,225 $86,359,000 3% Average per Pennsylvania Farm $4,785 $5,395 13% All Montgomery County Farms $3,495,498 $5,368,000 54% Average per Montgomery County Farm $20,205 $27,668 37% All Pennsylvania Farms $216,460,506 $309,738,000 43% Average per Pennsylvania Farm $12,130 $14,092 16% All Montgomery County Farms -$3,870,094 -$1,833,000 53% Average per Montgomery County Farm -$5,383 -$3,076 43% All Pennsylvania Farms $1,288,254,575 $1,755,111,000 36% Average per Pennsylvania Farm $20,396 $29,593 45% Source: USDA 2012, 2007 For farms to stay profitable, many farmers look to other sources of income. In Montgomery County, "farm-related income" (see Farm Income Categories on page 17) increased between 2007 and 2012 at a rate higher than the state as a whole. Farm-related income includes insurance payments, dividends or payments from a cooperative, or other agricultural services, such as planning, plowing, spraying, animal boarding, and animal breeding. While income from agritourism and recreational 13 Dollar figures are expressed in 2012 dollars, and have been adjusted for inflation based on the Bureau of Labor Statistic s Consumer Price Index for the Philadelphia Metro area. services increased by 1,335 percent between 2007 and 2012, and is the fastest growing source of income for farmers in Montgomery County, it only accounts for 15.9 percent of all farm-related sources of income. See Figure 22: Sources of Farm-Related Income (2012) on page 19 for a visual breakdown of farmers farm-related income, which does not include the sale of agricultural products. By far the largest category of farm-related income is other farm-related income sources. The USDA defines this broad category as income derived 18
 Gross Cash Rent or Share Payments (2%) Other Farm-Related Income Sources (77%) Patronage Dividents and Refunds From Cooperatives (0%) from animal boarding, animal breeding")

25 Figure 22: Sources of Farm-Related Income (2012) Source: USDA % 77% 2% 3% 2% Agritourism and Recreational Services (16%) Crop and Livestock Insurance Payments (2%) Customwork and Other Agricultural Services (3%) Gross Cash Rent or Share Payments (2%) Other Farm-Related Income Sources (77%) Patronage Dividents and Refunds From Cooperatives (0%) from animal boarding, animal breeding (excluding horse breeding), state fuel tax refunds, farm-generated energy, and other income sources not explicitly mentioned. In Montgomery County, this may reflect the high number of farms that offer horse boarding or have alternative energy sources like windmills located on their property. Net cash income, which is calculated by subtracting production expenses from total sales, government payments, and other farm-related income, is a measure of a farm s profitability. In both 2007 and 2012, all of Montgomery County s farms combined reported negative net cash income; however the overall county farm losses shrunk between 2007 and A decrease in loss of net cash income could imply that some of the county s less profitable farms ceased operations between 2007 and Farmland Preservation Affordable land that is protected from development is one of the most important resources that will support future generations of farming. Farmers need access to less expensive land because agriculture is land intensive, has slim margins for profitability, and prices fluctuate according to domestic and international markets. As development pressure increases, the need to preserve farmland also increases since development often increases the value of land. In Montgomery County, farmland is particularly well-suited for land development, as it is usually cleared and level, has access to groundwater, and is relatively close to employment centers. Farmland preservation originated as a growth management technique in the 1960s when state and local governments saw an explosion of suburban development. Today, farmland can be permanently protected through a variety of means. One way is for a landowner to sell or donate a development easement the right to develop land for nonagricultural purposes to a government or a nonprofit land trust. This is the most common farmland preservation technique. Another option is to transfer the development rights of the agricultural land to another piece of land, thus decreasing its development potential. This is referred to as Transfer of Development Rights or TDR. A landowner can also restrict the development potential of land through a deed restriction. Lastly, farmland can be purchased outright through a fee-simple sale to another farmer. This approach is sometimes used when a landowner wishes to retire but has no heirs to continue farming. Preserved Farm Sign Source: Montgomery County Planning Commission Montgomery County is one of 58 Pennsylvania counties that participates in the Pennsylvania Agricultural Conservation Easement Purchase Program (ACEPP). Also known as Act 43, the ACEPP allows county governments to protect active 19
.")
26 was supplemented by $1.1 in county appropriations. 14 As of June 2017, the average price per acre of preserved farmland in Montgomery County was $11,388, which was the second most expensive behind Delaware County (which has only preserved two farms). 15 Farmland Preservation Areas Source: Montgomery County Planning Commission farmlands by purchasing agricultural conservation easements that limit the future use of the land to agricultural activities. At the state level, the program is funded through cigarette taxes, the Environmental Stewardship Fund, and other sources. Montgomery County may also choose to contribute county funding to its farmland preservation efforts. The amount and source of the funds is at the discretion of the County Commissioners. Additionally, townships and boroughs can contribute funding to preserve farms within their jurisdictions. All three sources (state, county, and municipal) can be combined or used independently to preserve farms in Montgomery County. In 2017, Montgomery County received $2.6 million from the Pennsylvania Agricultural Conservation Easement Purchase Program. This funding As of August 2017, there were 160 farms totaling 9,404 acres preserved in Montgomery County under the farmland preservation program. This represents about 3 percent of Montgomery County s total land area and 31 percent of the county s total agricultural lands. According to Montco 2040: A Shared Vision, The Comprehensive Plan for Montgomery County, the county aims to preserve a total of 14,600 acres and 246 farms by Statewide, 5,169 farms in 58 participating counties (539,180 acres of farmland) have been preserved as of June While this is a significant number of preserved farms, it only represents 1.9 percent of the state s total land area and 7 percent of the state s total agricultural lands. Comparatively, Montgomery County has preserved a much larger percentage of both the county s land area and agricultural lands. 14 Montco Happening, "Another Farm Permanently Preserved in Montgomery County" (June 2017), August 28, 2017). 15 Pennsylvania Department of Agriculture, Bureau of Farmland Preservation, 2016 Annual Report, Act 149 of 1988 (May 2016), Documents/Final%20Copy%20Farmland%20Preservation%202016%20Annual%20Report. pdf (accessed July 10, 2017). 20

27 Lansdale Farmers' Market Source: Montgomery County Planning Commission
28 Key Takeaways MOST OF MONTGOMERY COUNTY'S FARMS ARE SMALL FAMILY FARMS The majority of Montgomery County farms are small and getting smaller. In 2012, 75 percent of Montgomery County farms were less than 50 acres and almost a quarter were less than 10 acres. Additionally, the average farm size in Montgomery County is more than four times smaller than the USDA average for a small farm. Although it takes farms of all sizes to produce food and preserve Montgomery County's quality of life, small farms often have a harder time remaining profitable since they aren't able to take advantage of economies of scale. MONTGOMERY COUNTY IS LOSING FARMS AND FARMLAND The number of farms and the amount of land in farms in Montgomery County decreased substantially between 2007 and Although this parallels similar trends at both state and national levels, the decline in Montgomery County was much greater. A number of forces, including the high cost of farmland and slim profit margins, may have contributed to the loss of farmland. High land values can make it hard for new farmers to start farming and often make it attractive for current farmers to sell their land for other, non-agricultural uses. NURSERY, GREENHOUSE, AND FLORICULTURE PRODUCTS ARE MONTGOMERY COUNTY'S TOP AGRICULTURAL COMMODITIES Although we often think of farmers as growing fruits and vegetables, many Montgomery County farms grow nursery, greenhouse, and floriculture products, such as Christmas trees, garden plants, flowers, trees, grasses, and shrubs. Given the perishability of nursery stock and the transportation costs of moving many trees, these products are particularly well-suited to Montgomery County given its proximity to a large population center. Additionally, products like cut flowers and Christmas trees can have larger profit margins, making them ideal for areas with high start-up costs (land values) like Montgomery County. OVER 25 PERCENT OF MONTGOMERY COUNTY FARMS RAISE BEES, HORSES, OR RABBITS Although nursery products account for the greatest percentage of sales in Montgomery County, the greatest percentage of farms self-report as primarily engaging in animal production, which includes the raising of bees, horses and other equine, and rabbits and other fur-bearing animals. While this doesn't reflect the fact that some farms produce multiple types of agricultural products, it does mirror the high number of horse farms and stables in the county. Combined, animal production and nursery production make up nearly half of all farms in Montgomery County. This illustrates that the county's agricultural industry specializes in high-value products valued by suburban and urban markets that can be grown on smaller farms. OVER HALF OF MONTGOMERY COUNTY FARMERS CONSIDER FARMING TO BE THEIR PRIMARY OCCUPATION Fifty-five percent of Montgomery County farms listed farming as their primary occupation, which means that over half of Montgomery County's farmers are trying to make their living primarily from their farm. However, only 33 percent of farms reported net gains in farm income in 2012, indicating that many farmers even those who consider farming to be their primary occupation need outside sources of income to continue to operate. Given the gap between the percent of profitable farms and the percent of farmers who consider farming to be their primary occupation, we can assume that Montgomery County farmers would like to find additional ways to improve their farm's financial viability. 22
29 MONTGOMERY COUNTY FARMERS AREN'T MAKING A LOT OF MONEY FROM THEIR FARMS The average Montgomery County farmer sold almost $43,000 worth of agricultural products in This is about one-third of what the average Pennsylvania farm sold and one-fifth of what the average farm sold, nationwide. Additionally, 72 percent of Montgomery County farms sold less than $20,000 worth of agricultural products and 1.5 percent of Montgomery County farms sold more than $500,000 worth of agricultural products. This tells us that a very small number of Montgomery County farms are making money by growing and selling agricultural products. Many Montgomery County farms rely on other farm-related sources of income like government payments, agritourism, and animal boarding, as well as non-farm-related income like outside jobs and spouses to remain operational. MONTGOMERY COUNTY FARMS, IN AGGREGATE, ARE LOSING MONEY In both 2007 and 2012, all of Montgomery County's farms combined reported negative net cash income, which is calculated by subtracting production expenses from total sales, government payments, and other farm-related income. In 2012, the average Montgomery County farm reported a net loss of $3,076. Not every farm lost money; instead, this data may point to the large number of hobby farms in the county that are not intended to make a profit. The negative net cash income also highlights the fact that it can be very hard to earn a profit from farming, especially in an area with high land values. DIRECT SALES ARE A VERY SMALL PART OF OVERALL FARM SALES Although many people's interaction with farmers are through direct sales outlets like farmers' markets, direct sales are not a large part of Montgomery County farmers' revenue stream. In 2012, they accounted for only 5.3 percent of Montgomery County's agricultural sales, which represents a decrease of almost 50 percent from While direct sales can be more lucrative for the farmer, they require significant amounts of time not only staffing the stall but also driving to and from the various markets. For many small farms with few employees, this can be a serious challenge. AGRITOURISM AND RECREATIONAL SERVICES ARE THE FASTEST GROWING SOURCES OF INCOME In Montgomery County, income from agritourism and recreational services increased 1,335 percent between 2007 and 2012, adjusted for inflation. After other farm-related income sources, such as animal boarding, it represents the second-largest farm-related income source at 16 percent. This illustrates that agritourism, which includes pick-your-own programs and hayrides, supplements the sale of agricultural products and can help farmers bridge a gap in profits. Farmers are increasingly interested in incorporating agritourism enterprises into their business model as they look for ways to remain viable in a competitive market. 30 PERCENT OF AGRICULTURAL LANDS ARE PERMANENTLY PRESERVED The county government has made farmland preservation an important strategy for protecting farms in Montgomery County. To date, it has successfully preserved 160 farms for a total of 9,404 acres, or 30 percent of all agricultural lands. Montgomery County has preserved a much larger percentage of both the county's land area and agricultural lands than the state of Pennsylvania as a whole. However, the average price per acre of farmland in the county is the second most expensive in the state, which illustrates the need for funding to support this program, especially since the county aims to preserve an additional 5,196 acres of farmland by

30 Lansdale Farmers' Market Source: Montgomery County Planning Commission
31 Existing Local Food Promotion Programs Several local food promotion programs are available to Montgomery County farmers, food producers, and retailers. Some are part of larger, national efforts, while others are more local, homegrown resources. The following summarizes a few programs that stakeholders referenced during the interviews. Buy Fresh Buy Local The national Buy Fresh Buy Local marketing campaign was created in 2003 by the FoodRoutes Network to support local producers and encourage a greater appreciation for regional food, unique flavors, and seasonality. Participating businesses make a commitment to the program by selling locally-grown food or other products made with locally-grown food. There are currently over 70 Buy Fresh Buy Local campaigns operating in 20 different states. In Pennsylvania, Buy Fresh Buy Local is coordinated by the Pennsylvania Association for Sustainable Agriculture (PASA), with eight local chapters organized by an alliance of agencies across the Commonwealth. Fair Food, an organization that works to unite local farmers with businesses and consumers, manages Buy Fresh Buy Local Greater Philadelphia. According to Becky Clawson, the Business Member Services Associate with PASA, the power of the model relies on a strong local organization that is well-integrated into the community. Members, known as partners, typically pay annual dues to access local campaign materials and connect to the broader network. Currently, Montgomery County does not coordinate a Buy Fresh Buy Local chapter, though the county is included in the Greater Philadelphia Chapter. counties across Pennsylvania, known as the Pennsylvania CSA Guide. The Guide notes what general products each farm offers, whether they offer fall or winter shares, and whether they offer financial assistance for low-income customers. The Guide only lists farms that are both PASA members and Buy Fresh Buy Local Partners that elected to be included in the guide. Three Montgomery County farms are listed in the 2016 Guide: Living Hope Farm, Longview Farm and Market (Greener Partners), and Pennypack Farm and Education Center. PA Preferred PA Preferred is a statewide marketing program, housed within the Pennsylvania Department of Agriculture, that promotes Pennsylvania producers and retailers who sell local food and agricultural products. Established in 2003 and signed into law in 2011, PA Preferred is a membership-based program with over 2,000 members currently enrolled. Benefits of membership include access to the PA Preferred logo, networking, and match-making services. Membership is free and available online. In order to be considered for membership, retailers and producers have to meet specific criteria. For example, grocery stores are able to advertise that they sell PA Preferred items in their stores, although they cannot use the PA Preferred label on all items. Organizations that support local food, but are not considered producers or retailers, can become members as well. Recently, PA Preferred launched a Homegrown by Heroes program to connect veterans to local food production opportunities, and to promote their businesses. Nationally, the Homegrown by Heroes program is administered by the Farmer Veteran Coalition. Pennsylvania CSA Guide PASA, the largest statewide, member-based sustainable farming organization in the United States, compiles a list of CSA programs in 25

32 Direct from the Farm: A Guide to Buying Local in Montgomery County In 2016, the Montgomery County Planning Commission, in partnership with the Montgomery County Farm Bureau and the Penn State Cooperative Extension Montgomery County, published Direct From the Farm: A Guide to Buying Local in Montco. The guide, which is an update to Shop Local Save Land Pennsylvania: A Guide to Farms and Farm Markets in Montgomery County, features information on 59 farms and 12 farmers markets. For each farm, the guide provides a brief summary, address, and contact information, as well as public hours of operation for most farms. The guide also contains a map with locations of all the farms and farmers markets. Hard copies of the guide are available at MCPC's offices in Norristown. It is also available on the county s website. Crave Montco Billed as, "The official dining guide of Valley Forge and Montgomery County," Crave Montco is a branding and promotional effort of the Valley Forge Tourism and Convention Board (VFTCB). Although not specific to locally-grown food, Crave Montco highlights restaurants, cafes, bakeries, and bars in Montgomery County. The VFTCB released the first issue of Crave Montco in the summer of 2016, with subsequent issues following in the winter, summer, and fall of In addition to digital and paper issues of the dining guide, Crave Montco has a significant web and social media presence. The Crave Montco website offers area dining guides for a handful of Montgomery County towns, articles highlighting local restaurants, and virtual tours of select restaurants through its Montco 360 program. Additionally, Crave Montco has a "Top Picks" sections that features selected establishments in different categories, including Montgomery County farm-to-table restaurants and farmers' markets. Direct From the Farm: A Guide to Buying Local in Montco Source: Montgomery County Planning Commission 26
33 Challenges and Opportunities to Promoting Local Food in Montgomery County A number of studies, including a January 2015 report by the United States Department of Agriculture (USDA) Economic Research Service (ERS) have shown that consumer, producer, and policymaker interest in local foods appears to be growing. 16 Increased interest in and awareness of food, food production, and farming has created more market opportunities for local farmers and food producers. Despite this growing interest, it can still be very difficult for local farmers and food producers to operate sustainable businesses. A number of the opportunities and challenges outlined below have and will continue to influence Montgomery County farmers and food producers ability to reach local buyers and ultimately stay profitable. Challenges Lack of Identity as an Agricultural Community A regional identity specifically an area being known for its agricultural products and heritage can be a significant advantage to a place and its economy. The State of Agriculture in the Hudson Valley notes A strong sense of place a regional identity conveys a marketable sense of quality, adding value to products from that region. 17 For example, regions like Napa Valley and Sonoma County in California are known for their excellent wine and therefore, wineries located in those regions are able to attract customers from all over the world based largely on their geographic identity. More locally, New Jersey is recognized for summer produce like 16 Sarah A. Low, Aaron Adalja, Elizabeth Beaulieu, Nigel Key, Steve Martinez, Alex Melton, Agnes Perez, Katherine Ralston, Hayden Stewart, Shellye Suttles, Stephen Vogel, and Becca B.R. Jablonski, Trends in U.S. Local and Regional Food Systems, AP-068, (U.S. Department of Agriculture, Economic Research Service, January 2015), publications/42805/51173_ap068.pdf?v=42083 (accessed July 3, 2017). 17 Glynwood, The State of Agriculture in the Hudson Valley (Cold Spring, NY: Glynwood, 2010), (accessed September 29, 2016). tomatoes, blueberries, and sweet corn. The identification of a New Jersey tomato distinguishes that tomato from other tomatoes, often giving it additional value in the eyes of the consumer. Many of the stakeholders interviewed as part of this project noted that Montgomery County is not as well known for its agricultural products and heritage as some of its neighboring counties like Lancaster and Chester Counties. This lack of identity as an agricultural community can be a missed opportunity for local farmers trying to distinguish their products from other similar products on the market. However, it also represents a chance for Montgomery County to build a reputation for its agricultural industry in general or for a specific agricultural product like honey or Christmas trees. Regulations Farming can be a highly-regulated industry with various federal, state, and local laws affecting farm operations. Many federal and state policies address issues like food safety and the environmental impacts of farming, while local governments, like counties and municipalities, have the power to regulate land use under the Pennsylvania Municipalities Planning Code (MPC). Building and zoning codes are the most common and powerful tools that counties and municipalities have to regulate land use. As noted in Agriculture and the Law: A Guide to Pennsylvania s Agricultural Laws and Regulations for Farmers and Their Neighbors, "zoning is the mechanism that municipalities use to control the physical development of land. Zoning regulations establish where specific uses of land may occur. 18 More specifically, zoning can affect what activities can occur on a farm and what structures can be built. While the MPC states that zoning ordinances shall encourage the continuity, development, and viability of agricultural operations, and that zoning ordinances may not 18 Citizens for Pennsylvania s Future (PennFuture), Agriculture and the Law: A Guide to Pennsylvania s Agricultural Laws and Regulations for Farmers and their Neighbors, (PennFuture, 2001), BE69-6E87-6E16-B52DDE5F143E.pdf (accessed July 3, 2017). 27

34 restrict agricultural operations in geographic areas where agriculture has traditionally been present, 19 municipalities still have the power to control many aspects of farm operations in order to ensure the public s health and safety. The list below highlights a few farm-related activities that might require a permit from the local government (often accompanied by a fee): Construction/operation of value-added processing facilities; Events on a farm property, such as weddings or festivals; On-farm restaurants or tastings; Farm signage; Farm markets; and Other forms of agritourism where the public is invited onto the property. Within Montgomery County, many of the farmers that participated in stakeholder interviews stated that local regulations around farm markets and signage are a particular issue as many farms sell their produce directly to consumers, often through farm stands on their property. One farmer specifically noted that the cost of obtaining and renewing a license for a highway sign is very expensive, although worthwhile. The same farmer also mentioned that the township prohibits the farm from offering hayrides on the property. Although municipalities must balance the needs of all residents when determining what activities are allowed in certain areas, restrictions like these can be detrimental to many Montgomery County farms that rely on on-farm stands for sales or need the additional income from agritourism and educational activities to be profitable. Lack of Distribution Networks During the stakeholder interview process, farmers repeatedly noted the challenges they face in delivering produce to local restaurants and markets. Both the time and costs required to transport their products are 19 Pennsylvania Department of Community and Economic Development. "Pennsylvania Municipalities Planning Code: Act of 1968, P.L. 805, No. 247, as reenacted and amended (Eighteenth Edition)," (Harrisburg: Governor's Center for Local Government Services, February 2005), (accessed July 3, 2017). Meadow View Farm in Gilbertsville, PA Source: Montgomery County Planning Commission barriers for most farmers since an individual restaurant s or customer s order is generally small and not worth a separate trip. In a survey of their member groups and farmers, the National Family Farm Coalition (NFFC) found that about half of the respondents quoted transportation as a regular challenge the cost of fuel, distance to travel, time away from the farm, and capital were the most quoted challenges related to transportation. While there are larger distributors that work with local produce, they currently don t work with many Montgomery County producers. This could be for a number of reasons, including that many distributors already have arrangements with other area farms and producers that provide them with a specific type of food. Another explanation may be that Montgomery County does not have the same density of farms as other nearby counties, making it less worthwhile for distributors to transport food from Montgomery County farms to their warehouse. This could be offset if a larger number of farms contracted 28

35 with the same distributor or if the distributor had a centralized drop-off location that was convenient to both the distributor and farmer. Lack of Processing Facilities Another challenge that many stakeholders raised was the lack of local processing facilities, specifically meat processing facilities. A NFFC report noted that without legal and safe ways to slaughter their animals or create value-added products through processing locally, many farmers are unable to sell directly to consumers. 20 According to 2010 National Establishment Time Series data, there were six animal slaughtering and processing companies in Montgomery County, which included major companies like Hatfield Quality Meats Inc. and JBS Souderton Inc. These companies typically have established contracts with larger farms that can 20 Eric Hoffman, Barriers to Local Food Marketing: A Survey of National Family Farm Coalition Members, (Washington, DC: National Family Farm Coalition, July 2009), Issues/Local%20Food/LocalFoodReport.2009.pdf (accessed July 3, 2017). provide a consistent number and size of animals. Livestock processed in these facilities can come from the across the region, the country, or even Canada. Only one of the processors, Leidy s Inc., specifically noted that they worked with Pennsylvania farmers for their Pennsylvania Farm Fresh line of products. Smaller farms within Montgomery County typically send their livestock to auctions located in Lancaster or Berks Counties once they are ready for butchering. At the auction, the livestock are grouped with other animals into larger lots that are then sent to slaughterhouses. Under this process, smaller farms have limited control over where their livestock is ultimately processed and sold. 21 In an analysis of the region s meat industry, The Reinvestment Fund (TRF) found that, theoretically, there are enough hog farms in the region to support all of the region's hog feedlots and enough cattle farms in the region to meet 81 percent of region's beef feedlot capacity. However, TRF found that meatpackers can meet only 35 percent of their input needs from producers in the region. 22 These findings tell us that regional meatpacking capacity may not be the problem; rather it could be an issue of making the connection between the regional meatpackers and local beef and cattle producers. Further research on whether local meatpackers are sourcing from local producers, and what the challenges are in making those connections, is needed. Lack of Access to Affordable Farmland Finally, a number of the stakeholders interviewed mentioned that the cost of farmland is a significant challenge for local farmers. Farmers need access to affordable land because agriculture is land intensive and has Taylor Farm, Upper Providence Township Source: Montgomery County Planning Commission 21 Wendy Freed, message to Anne Leavitt-Gruberger, October 5, Lance Loethan, Scott Haag, Bill Schrechker, and Ira Goldstein, The Supply Chain Matrix: A Prospective Study of the Spatial and Economic Connections within the Region s Meat Industry, (Philadelphia, PA: The Reinvestment Fund, July 2013), com/wp-content/uploads/2015/12/supply_chain_matrix-report_2013.pdf (accessed July 2016). 29

36 slim margins for profitability. Additionally, the lack of affordable farmland can be a barrier to scaling up farm operations, which is needed to provide local markets, specifically restaurants and institutions, with a consistent supply. In 2012, the estimated market value of farmland and buildings in Montgomery County was, on average, $14,051 per acre. This is approximately 1.1 times more than an acre of farmland in Lancaster County and 5.7 times more than the national average for an acre of farmland (see Figure 23: Estimated Market Value of Land and Buildings (Average per Acre)). Although land is very expensive in Montgomery County, the county, state, and federal governments offer various loan programs to help both new and established farmers purchase land and equipment, or finance improvements on existing farms. These loan programs, in coordination with business planning assistance from organizations like the Penn State Extension, can help farmers to access land. Figure 23: Estimated Market Value of Land and Buildings (Average per Acre) Change from 2012 to 2007 % Change from 2012 to 2007 Montgomery County $14,051 $11,013 $3,038 28% Lancaster County $12,529 $10,243 $2,286 22% Pennsylvania $5,425 $5,245 $180 3% United States $2,481 $2,078 $403 19% Source: USDA 2012, 2007 Upper Merion Farmers' Market Source: Montgomery County Planning Commission Opportunities Increased Consumer Demand and Awareness of Local Food Many of the stakeholders interviewed observed an increased demand for local food. This trend is reflected in the USDA's Economic Research Service's Trends in US Local and Regional Food System report, which found, Farm operations with direct-to-consumer sales of food for home consumption have increased from 116,733 to 144,530 between 2002 and Consumers have more opportunities to purchase food directly from producers with 8,268 farmers markets operating in 2014, up 180 percent since The increase in farms selling directly to the consumer (through farmers' markets, farm stands, CSAs, etc.) is indicative of a growing national interest in purchasing locally-grown or farm-fresh foods. Additionally, the National Restaurant Industry found that 68 percent of consumers say they are more likely to visit a restaurant serving locally sourced items than one that doesn t Dollar figures are expressed in 2012 dollars, and have been adjusted for inflation based on the Bureau of Labor Statistic s Consumer Price Index for the Philadelphia Metro area. 24 Low, et al., Trends. 25 National Restaurant Association, "Demand for Local Food on the Rise," National Restaurant Association, March 1, 2016, (accessed July 3, 2017). 30

37 Location, Location, Location The increased interest in local food presents an opportunity for Montgomery County farmers since they are located within 100 miles of a number of large population centers, including Philadelphia and New York City. Even more locally, the eastern portion of Montgomery County is very developed and offers strong market opportunities within a 30 minute drive of many Montgomery County farms. In addition to Montgomery County s proximity to large consumer bases, the county s climate also provides farmers with the opportunity to grow a wide variety of foods throughout the year. Increase in Intermediate Distribution Channels The growth of regional food hubs, both nationally and within our region, also reflects a growing demand for local food. Regional food hubs and distributors present an opportunity for more local farmers to connect with new markets like local institutions, restaurants, and consumers. Organizations like Common Market, Zone 7, and J. Ambrogi Foods are regional food vendors that aggregate and REGIONAL FOOD HUB sell food from Greater A business or organization that actively Philadelphia area manages the aggregation, distribution, and marketing of source-identified food farms to institutions products primarily from local and regional and restaurants. producers to strengthen their ability to Some, like Common satisfy wholesale, retail, and institutional Market, work only with demand. 26 local farms. Others 26 source globally but James Barham, Debra Tropp, Kathleen Enterline, Jeff Farbman, John Fisk, and Stacia also work with local Kiraly, Regional Food Hub Resource Guide (U.S. food producers to Dept. of Agriculture, Agricultural Marketing Service. Washington, DC, April 2012). satisfy client demand for local food. Other larger, national food managers like Aramark and Sodexo have also added local options in some of their markets as client demand for local food has increased. While there are an increasing number of channels for local food distribution, it can still be challenging for local farms to connect with them. As related during the stakeholder interviews, one Montgomery County farmer was not able to develop a relationship with a regional food hub as a result of their packaging requirements. The farmer ultimately found the requirements to be too restrictive and therefore chose to pursue other distribution outlets. Additionally, as mentioned in the Lack of Distribution Networks Section on page 28, distributors often need a certain density of farms within an area to make local food pick-up worthwhile. Finally, distributors need a guarantee of consistent supply, which can be hard for smaller farms to provide. Common Market Warehouse in Philadelphia Source: Common Market 31

38 Dairy Cows at Moser Farms in Douglass, PA Source: Montgomery County Planning Commission
39 Recommendations Drawing upon an analysis of Montgomery County s current agricultural resources, ongoing conversations with stakeholders, and examples from innovative programs across the country, Eat Local Montco proposes a range of recommendations, including policy reforms, expansions of current initiatives and programs, and new approaches. The recommendations are intended to be actions or strategies that the county and local governments could implement on its own, or work with other organizations, like a nonprofit or food system partner, to support. Support a Vision for Local Food Procurement in Montgomery County Encourage Local Food Procurement Local governments, including both county and municipal governments, can play an important role in local food systems through their purchasing power. Government agencies and the organizations they contract with often buy food to provide meals to people in child-care centers, schools, public universities, senior programs, nursing homes, public hospitals, and prisons. They may also purchase food to sell to the public at concession stands and cafes in county parks, museums, or historical sites. Finally, as large employers, governments may purchase food to sell to employees in office cafeterias and vending machines. All of these potential purchases represent opportunities for local governments to demonstrate their commitment to supporting the local food system by using funds that they would already be spending, but ensuring that a portion of it is spent on locally-grown or -produced food. In their Equitable Development Toolkit: Local Food Procurement, Policy Link notes, A number of local procurement policies and programs have been enacted over the last few years, enabling local municipalities and state governments to institutionalize local purchasing, and in doing so, provide opportunities for small family and mid-size farms to scale up and enter the wholesale market realm It is estimated that 37 states have laws that require some or all state and local agencies to allow geographic preference for purchasing locally-grown food. 27 There are multiple ways that local governments could enact a food procurement policy. A few that Montgomery County may want to consider include developing a targeted percentage of local food purchases, issuing a resolution in support of local purchasing, or changing county departmental procedures. Develop a Targeted Percentage of Local Food Purchases Under this scenario, the Montgomery County Board of Commissioners could pass an ordinance stating that a certain percentage of food purchased by the county will be sourced locally by a specific date. The targeted amount should take into account the amount and type of food currently purchased as well as the availability of local food products. One example of a government setting a local food procurement goal is the Illinois Local Food, Farms, and Jobs Act of In this legislation, the Illinois General Assembly set a goal that by 2020, 20 percent of all food purchased by State agencies or State facilities would be from local farms or food producers. The Illinois legislation is purely aspirational and does not include any penalties for missing the targeted goal; however, it does allow for the creation of a Local Food, Farms, and Job Council to support the implementation of the Act. Issue a Resolution in Support of Local Food Purchasing Alternatively, the County Commissioners could pass a resolution similar to North Carolina s 10% Campaign (see Case Study: The 10% Campaign on page 35), in which they express support for county government, institutions, businesses, and citizens to purchase locally-produced foods. This type of resolution encourages, but does not mandate, that public or private entities purchase a specified percentage of local food. 27 Equitable Development Toolkit: Local Food Procurement, (Policy Link, March 2015),
40 Change County Departmental Procedures County Commissioners could also choose to enact a regulation to change the administrative rules that county departments follow. A regulation could require county departments to source a particular amount of food from Montgomery County producers. This may be worth pursuing in the future if the Montgomery County Division of Parks, Trails, and Historic Sites opts to offer concessions at any of the county s nine parks or five historic sites. Support Local Nurseries That Grow Native Plants According to the Pennsylvania Native Plant Society, A native plant is one that occurs naturally in a particular region, ecosystem, or habitat without direct or indirect human intervention. 28 Because they are well-suited to an area s growing conditions, native plants are easier to grow and are more likely to thrive. They are also an important component of any ecosystem since they provide a habitat for wildlife, especially insects and birds. The Penn State Extension lists numerous benefits of using native plants, including improved wildlife habitat, maintenance of biodiversity, climatic suitability, resistance to pests and diseases, reduced water and chemical use, and reduced maintenance. 29 Since approximately one-fifth of all farms in Montgomery County grow nursery crops, one way that the county can support local agriculture is to provide a steady demand for locally-grown native plants. The county can do this by developing a model native vegetation landscaping ordinance for municipalities that requires the conservation and use of native plant species. This type of ordinance would require native vegetation to be used in all publicly-landscaped areas and could extend to privatelylandscaped areas as well. The county can also set an example by using locally-grown native plants for its own landscaping needs, including new green stormwater infrastructure initiatives, and changing procurement MONTGOMERY COUNTY PROCUREMENT POLICY Current Montgomery County Procurement Policy makes allowances for the county to express a preference for local businesses. Section 7(a) states, In order to help business and industry located in this County, attract new business and industry to this County, and provide additional tax revenue both from those receiving contracts and those employed by County contractors, it shall be the policy of this County to assist local, small and disadvantaged businesses in learning how to do business with the county. The policy goes on to define local as a person, partnership, corporation or other business entity authorized to transact business in this County and having a bona fide establishment for transacting business in this County at which it was transacting business on the date when bids or proposals for the public contract were first solicited." This policy, as stated, allows the county to provide assistance to local businesses in learning how to do business with the county; compile, maintain, and make available lists of local businesses for the purposes of encouraging procurement from local businesses; assure that local businesses are solicited on each procurement for which such businesses may be suited; include price preferences or evaluation credit for local businesses in the bid selection process; and provide other special allowances for payment and bonding to encourage procurement from local businesses Montgomery County Purchasing Department, "Procurement Policy of Montgomery County," Montgomery County, Pennsylvania, DocumentCenter/View/2382 (accessed August 30, 2016). policies to prioritize the purchase of these types of plants. In addition, the county could publish a guide to local nurseries and the native plants that they grow along with information on best management practices for plant maintenance. By enacting these strategies, the county will support an existing type of agriculture and may even encourage growth in this subindustry. 28 Pennsylvania Native Plant Society, "Why Native Plants?" org/why-native-plants.html (accessed June 7, 2017) 29 PennState Extension, "Native and Invasive Plants," gardening/eco-friendly/using-natives (accessed June 7, 2017). 34
41 CASE STUDY: THE 10% CAMPAIGN In July 2010, the Center for Environmental Farming Systems (CEFS) and North Carolina Cooperative Extension at A&T State University and North Carolina State University launched the NC 10% Campaign. The 10% Campaign seeks to support small- and mid-sized family farms in North Carolina through local food promotion and programming. The Campaign asks individuals and businesses to commit to spending 10 percent of their food dollars on locally-produced foods. The Campaign chose 10 percent because they found that North Carolinians spend about $35 billion a year on food. If individuals spent 10 percent $1.05 per day locally, about $3.5 billion would be available in the local economy. 31 The NC 10% Campaign offers a number of tools and programs to help consumers find local food outlets and track their local food purchases. A web portal allows participants to monitor their weekly spending and receive real-time data. Other programs, like the Local Food Ambassador Program and the Local Food Video Screening Toolkit, highlight North Carolina s food resources and help to educate consumers on the benefits of buying local. CEFS also works with NC Cooperative Extension Agents to host Grower-Buyer Connection events, where farmers and food producers can meet with wholesalers, restaurants, cooperatives, and buyers. Between its inception in 2010 and March 2017, the campaign engaged 7,964 people and 1,085 businesses, who have collectively spent over $70 million on local food purchases Center for Environmental Farming Systems, NC 10% Campaign, Center for Environmental Farming Systems, (accessed August 31, 2016). 32 NC 10% Campaign, "About the Campaign," North Carolina State University, (accessed July 3, 2017). Create a County Food Policy Council Although there are many different iterations of food policy councils, they typically are formed to encourage collaboration and coordinate work among local food system stakeholders. According to the nonprofit organization Food First, Councils generally have four functions: to serve as forums for discussing food issues; to foster coordination between sectors in the food system; to evaluate and influence policy; and to launch or support programs and services that address local needs. 33 Many food policy councils are concerned with increasing access to healthy and nutritious food, especially for more vulnerable populations, and closing gaps between food supply and demand to improve economic development. Food policy councils have existed in the United States at regional, state, and local levels since the early 1980s as a way to comprehensively address food system issues. They are usually created through a government resolution, act, or executive order, though they are not necessarily embedded within a government office. Food policy councils generally include representatives from all sectors of the food system, including production, consumption, processing, distribution, and waste recycling (though representation from processing and waste recycling is less common). These stakeholders include farmers, government officials, processers, distributors, and a variety of advocates and educators. 34 There is no one model for a food policy council; they vary based on local needs, political climate, funding, and staff capacity, as well as the unique food system gaps that exist in a particular region. Most are led by volunteers or government employees who are assigned to work on council issues for a limited number of hours, while others have dedicated, full-time staff. According to the Johns Hopkins Center for a Livable Future, as of October 2015, there were over 200 food policy councils established at 33 Harper, Alethea, Alison Alkon, Annie Shatluck, Eric Holt-Gimenez, and Frances Lambrick, "Food Policy Councils: Lessons Learned, page 2, uploads/2014/01/dr21-food-policy-councils-lessons-learned-.pdf
42 CASE STUDY: ADAMS COUNTY AND LEHIGH COUNTY FOOD POLICY COUNCILS Adams and Lehigh Counties are two different examples of countylevel food policy councils in Pennsylvania that work to connect local food system partners. The Adams County Food Policy Council was established by a proclamation on May 13, 2009 to close the food gap with a focus on building our local economy and educating our community about nutrition and the benefit of local food consumption in order to promote a more sustainable social, environmental and economic future. 35 The Council is affiliated with Healthy Adams County, a collaborative partnership of community members dedicated to continuing assessment, development and promotion of efforts toward improving physical, mental and social well-being. 36 There are currently 18 organizations that participate in the food council, including the United Way of Adams County, Wellspan Health, Gettysburg College, and the Adams County Farmers' Market Association. The county government also participates in the Council and is represented by the Adams County Commissioners as well as the Office of Planning and Development. The council meets monthly. One of the Adams County Food Policy Council s key initiatives is Healthy Options, a food voucher program that enables families who struggle with food insecurity but whose income is too high to be eligible for food assistance programs (such as SNAP) to purchase fresh produce at farmers' markets. Participants are required to attend at least one activity offered through the program, such as cooking demonstrations, farm tours, and hikes. This program 35 Adams County Food Policy Council, "Proclamation, May 13, 2009," About Us, (accessed July 3, 2017). 36 Healthy Adams County, "Our Mission and Vision," Healthy Adams County, (accessed June 7, 2017). enables families to eat healthier foods by making fruits and vegetables more affordable and by providing valuable education on topics such as nutrition, gardening, and cooking. The program is funded by a variety of partner organizations and individual donations. 37 The Lehigh Valley Food Policy Council is part of the United Way of the Greater Lehigh Valley s food access initiatives. It was founded to ensure an equitable and sustainable local food system with a focus on expanding SNAP and food access programs for lowincome residents. 38 Today, there are 17 key partners involved with the Council, including Buy Fresh Buy Local Greater Lehigh Valley, Lafayette College, Lehigh County Community Revitalization and Development, the Penn State Extension, Sodexo, and the St. Luke s University Health Network. The Council meets semi-annually while its steering committee meets monthly. The Council also has nine working groups focused on issues such as consumer education, land use, farming, and entrepreneurship. 39 According to the United Way, This collective impact effort pledges to reduce food insecurity locally by focusing on key economic issues and barriers to successful food access for all Adams County Food Policy Council, "Healthy Options," org/healthyoptions.html (accessed July 3, 2017) 38 United Way of the Greater Lehigh Valley, Food Access, United Way, unitedwayglv.org/see-the-impact/food-access (accessed July 3, 2017). 39 Alliance for Sustainable Communities Lehigh Valley, Lehigh Valley Food Policy Council. Alliance for Sustainable Communities. entry/lehigh-valley-food-policy-council/ (accessed July 3, 2017). 40 United Way of the Greater Lehigh Valley, Lehigh Valley Food Policy Council, United Way, (accessed July 3, 2017). 36
43 different levels of government throughout the United States. A plurality of councils operate at the county level, followed by the municipal level, and the regional level. Although only 18 percent of food policy councils are embedded within government, the majority have some relationship to an associated government, whether that means being created by government legislation or policy, involving government employees as council members, receiving governmental funding or financial support, or having a government official appoint council members. 41 According to a 2009 report by Food First, food policy council members can be appointed, self-selected, elected, or chosen through an application process. More formal councils may have distinct leadership positions and committees, while less formal groups may be less hierarchical. According to the same report, 14 percent of county-level councils have no funding and those that do are largely funded by individual donations. 42 To ensure its long-term success, a food policy council should involve multiple stakeholders, have a steady source of funding, have a strategic plan for action and decision-making, focus on more than one key issue, and balance tangible programs and services with broader policy advocacy. 43 A Montgomery County food policy council could work to improve access to healthful food for its residents and make it easier for farms and other food ventures to do business in the county. It could coordinate existing efforts by different organizations such as the Montgomery County Agricultural Land Preservation Board, the Penn State Extension, Common Market, Greener Partners, The Food Trust, the United Way, CADCOM, restaurants, and local institutions. It could also undertake new initiatives, including implementing recommendations made by this report. While the county 41 Johns Hopkins Center for a Livable Future, Food Policy Councils in North America, October 22, 2015: Slides_2015_10_28.pdf 42 Alethea Harper, Annie Shattuck, Eric Holt-Gimenez, Alison Alkon, and Frances Lambrick, Food Policy Councils: Lessons Learned, 2009: uploads/2014/01/dr21-food-policy-councils-lessons-learned-.pdf 43 Ibid. does not have to host the council, it should be involved in its creation and administration to give it more legitimacy and authority. For example, the county could pass a resolution creating or supporting the creation of a food policy council. It could also loan current staff to the council, provide funding, or have a commissioner serve as an ex-officio member. If the county is not the parent organization of the council, it could partner with an organization like the United Way or help establish a new, collaborative organization. Coordinate Supply Chain Efforts Gaps in the supply chain, specifically connecting local food producers to local food buyers, were repeatedly identified by Montgomery County food system stakeholders as a major barrier to local sourcing. Farmers noted that the transportation costs and time burden of making deliveries to restaurants or other relatively small clients across the county was exceedingly burdensome. As noted in the Challenges and Opportunities section on page 27, some of this supply chain infrastructure exists already; therefore, the challenge is not necessarily to create new supply chain infrastructure, but to connect farmers and food producers to existing infrastructure. Convene Food System Stakeholders The county, in collaboration with local food system partners such as the Penn State Extension and DVRPC, could convene a series of meet and greet events to help initiate and facilitate better connections between different local food system stakeholders. While conducting stakeholder interviews, DVRPC discovered that a number of local food system resources exist; however not all stakeholders are aware of them. Additionally, many stakeholders encountered similar problems, but because they are working in silos, they are not able to discuss shared solutions. Bringing people together around topics where they share interests could help to bridge gaps and identify solutions to common problems. 37

44 There are a number of ways for the county to effectively convene stakeholders, and each may look different depending on the needs of each particular food system group. The county could convene growerbuyer events to provide a venue in which local farmers meet one-on-one with interested buyers. These events can be specific to the type of buyer, for example a grower-restaurant event to allow farmers to connect with restaurants interested in sourcing locally. These events could provide farmers and food producers with the opportunity to share their product lists and samples with potential buyers. They would also allow buyers to discuss their specific product needs, requirements for volume, insurance, and delivery terms. As mentioned in Case Study: The 10% Campaign on page 35, CEFS and the NC Cooperative Extension host Grower- Buyer Connection Events as part of their efforts to expand economic opportunities for local farms. They have developed a brief Grower-Buyer Connection Guide that outlines how to host a successful event, complete with an event planning timeline and sample outreach language. The county could also facilitate meet and greets with specific local food distributors. In the past, Common Market has hosted events with local farmers to tell them what Common Market and their institutional buyers require, specifically regarding packaging and food safety. Common Market and other local food distributors could hold similar meet and greets with farmers in Montgomery County. DVRPC and the MCPC already piloted one convening as part of our stakeholder outreach. We assembled a focus group of farmers market managers in Montgomery County. Representatives from four of the county s farmers markets, one representative from the Ambler food co-op, and one representative from the Weaver s Way co-op attended. Although our intent was to develop better understandings of farmers market operations and the demand for local food in Montgomery County, many attendees noted that the networking aspect of the meeting was extremely beneficial. They expressed support for starting a Google group, or an alternative way to connect with other farmers market managers. Although Keep Farming Conference 2017 Source: Montgomery County Planning Commission 38
45 some market managers have been less responsive to additional calls for meetings during the market season, market managers may be interested in gathering to network with other managers and learn new skills. For example, a meeting with the county Health Department that explains the Montgomery County Health Department Farmer's Market Guidelines, could serve as a learning and networking opportunity. The county has organized and hosted the Keep Farming in Montgomery County Conference for 15 years. The conference, which is held every four years, brings together farmers and food system stakeholders like land trusts, government officials, and institutional buyers. The next Keep Farming Conference could provide an opportunity for the county to host a meet and greet event between farmers and consumers as well as offer other less formal networking opportunities for food system stakeholders. Support Farm to Institution Within Montgomery County A region s anchor institutions, such as institutions of higher education and healthcare providers, are not only major employers, but are also large purchasers of food; their cafeterias and food service facilities serve hundreds, if not thousands, of diners every day. Montgomery County is home to approximately 20 colleges, universities, and seminaries, and almost 20 hospitals and medical centers. Although most of these institutions contract with a national or regional company to manage their food service operations, many also source a portion of their food purchases locally. Given their large purchasing volume, institutions can make a significant impact on the local food economy by committing to sourcing from local farms. However, there are many barriers, both in practice and in policy, to purchasing more local food. Higher costs, food preparation requirements, a need for consistent products, and delivery logistics were all cited by stakeholders as challenges to sourcing locally. In some instances, institutional kitchens may lack the necessary storage facilities to handle large volumes of fresh produce and their chefs may not be trained to cook with these ingredients. 44 In addition, many institutions use a group purchasing organization to source their supplies, which restricts their ability to make individual purchasing decisions. This often means that it can be difficult for institutions to change their policies and practices regarding food procurement and preparation. As the Michigan Good Food Work Group s report on institutional food purchasing notes, The current food procurement process is designed for efficiency, not diversity. 45 This means that it can be very complicated for smaller-scale farmers to compete with larger food distributors in providing farm-fresh products to institutions. SELECTED MONTGOMERY COUNTY INSTITUTIONS Abington Hospital-Jefferson Holy Redeemer Hospital Health Lankenau Hospital Arcadia University Manor College Biblical Theological Seminary Montgomery County Bryn Athyn College Community College Bryn Mawr College Norristown State Hospital Bryn Mawr Hospital Palmer Theological Seminary Chestnut Hill Rehabilitation Penn State Abington Center Pottstown Memorial Medical Eagleville Hospital and Center Rehabilitation Center Rosemont College Einstein Medical Center Saint Joseph's University Montgomery Salus University Elkins Park Hospital Suburban Community Grand View Hospital Hospital Gratz College Temple University Ambler Harcum College Ursinus College 44 Val George, Colleen Matts, and Susan Schmidt, Institutional Food Purchasing: Michigan Good Food Work Group Report No. 3 of 5 (East Lansing, MI: C.S. Mott Group for Sustainable Food Systems at Michigan State University, 2010), files/inst_food_purchasing_report.pdf (accessed July 3, 2017). 45 Ibid. 39

46 Despite the obstacles to working with local producers, there are several ways that institutions can incorporate local sourcing into their food operations. Both Arcadia University Ursinus College Gate in Collegeville, PA in Glenside and Source: Montgomery County Planning Commission Rosemont College in Rosemont work with Parkhurst Dining to supply and manage their on-campus dining operations. Through its FarmSource TM program, Parkhurst sources over 20 percent of its food from farmers and producers within a 150-mile radius of their clients' locations. They work with both Common Market and Lancaster Farm Fresh Cooperative to facilitate their supply chain. Similarly, Ursinus College in Collegeville has been making efforts to purchase foods produced within a 100-mile radius of campus through the college s Dining Services, which is managed by Sodexo. Additionally, in 2003, Ursinus students and faculty started the Ursinus College Organic Farm, which provides students with hands-on learning experiences. The food that is produced on the 2.5 acre farm is sold to students and community members at the Collegeville farmers' market. In 2015, Ursinus purchased 11 acres of preserved farmland in Trappe Borough to create the Robert and Shurley Knaefler Whittaker Environmental Research Station, which will serve as the college's home for research on sustainable agriculture. 46 which includes Lankenau and Bryn Mawr Hospitals, signed Health Care Without Harm s Healthy Food in Health Care Pledge, which provides guidelines to help the hospitals serve foods that support the health of patients, visitors, staff, and the community. 47 Lankenau Hospital also signed the Good Food, Healthy Hospital Pledge, which is a four-year initiative of Get Healthy Philly, Common Market, and the American Heart Association, to offer healthier and more sustainable food and beverage options to patients, staff, and visitors. 48 Although these initiatives primarily address the healthfulness of foods, they also demonstrate that institutional food service providers can successfully alter their food procurement and preparation practices to incorporate more local and healthy foods. These initiatives illustrate that a growing demand for fresh, local produce can serve as the impetus for a shift in institutional food procurement. Hospitals could serve as a model for other institutions and major employers in Montgomery County which may also have catering needs and on-site cafeterias. Together, these institutions can significantly impact the local food economy in Montgomery County and work to improve residents health outcomes. Support Local Sourcing through Catering Catering may not be subject to purchasing agreements with food vendors, therefore institutions may have more flexibility to contract with Montgomery County-based catering companies that source from area farms and food producers. To help institutions contract with more local caterers, the county can create a list of local catering companies that also source from nearby farms. In December 2016, the Philadelphia Food Policy Advisory Council (FPAC) released the Philadelphia Good Food Caterer Guide to help consumers find businesses offering food that meets at least two of Both Abington Hospital-Jefferson Health and the Main Line Health network, 46 Ursinus College, "Environmental Studies: Facilities and Resources," edu/academics/environmental-studies/facilities-and-resources/ (accessed August 28, 2017). 47 Healthcare Without Harm, Healthy Food Pledge Signers, issues/us-canada/healthy-food-pledge-signers#midatlantic (accessed June 27, 2017). 48 Food Fit Philly, Good Food, Healthy Hospitals Initiative, 40

47 the four 'good food' values that they identified: healthy, fair, sustainablysourced, and locally-owned. Similarly, a Montgomery County guide could include a category for caterers that source a certain percentage of their ingredients from Montgomery County farms (however, verifying local food sourcing is very difficult and therefore would most likely be reported on an honor system). Institute an Employee CSA or Farmers' Market Another method that would allow local institutions to partner with local farmers and/or distributors without requiring changes to the institution's procurement policy is to establish an employee CSA or farmers' market. An example of an institution supporting a farmers' market can be found at Lankenau Medical Center (LMC). LMC partnered with Common Market and Aramark to host a farmers' market in their lobby every Thursday throughout the year. The market, which is available to over 2,000 LMC employees and numerous patients and visitors, features food from Common Market as well as fresh produce grown on-site in the Delema G. Deaver Wellness Garden. Employee CSAs and farmers' markets like the one at LMC, have different benefits for different stakeholders. They can increase patients' and visitors' access to fresh produce, provide local farmers with a larger customer base, and allow institutions to form relationships with local farmers and food distributors, such as Common Market. Although Common Market sources food from farms across the region not just Montgomery County it is a step towards bringing more local food into large organizations. Additionally, the farmers' market presents an opportunity for LMC to use its buying power and customer base to encourage Common Market to contract with more Montgomery County-based producers. their programs so that other institutions can learn from their experiences. Encourage Institutions to Participate in a Buy Local Week or Other Local Food Events Although, ideally, institutions would incorporate local sourcing practices into their day-to-day procurement policies, encouraging hospitals, universities, and other large employers to participate in or host limited duration, local food events like a Buy Local Week is a good way for them to begin to procure local food on a trial basis (see Buy Local Challenge/ Buy Local Week on page 51). This type of smaller-scale event allows the institution to establish relationships with local producers and get a sense of the demand for local food without committing to an overhaul of their procurement procedures. The Southern Maryland Agricultural Development Commission's Buy Local Challenge was specifically designed to accommodate institutions such as hospitals, schools, and businesses (see Case Study: Southern Maryland Agricultural Development Commission s Buy Local Challenge on page 52). The County should encourage other institutions to pilot initiatives similar to those at LMC. It can support these practices by convening meetings with local institutions and select farmers' market and CSA operators to help institutions understand the logistics behind offering an employee CSA or farmers' market. The County may also want to invite LMC to present on Delema G. Deaver Wellness Farm at Lankenau Medical Center Source: Greener Partners 41
48 In 2009, 27 hospitals in Maryland committed to serving at least one local food item per day during the Buy Local Week. Employees at these institutions also pledged to eat one local food each day for one week. At the end of the week, the hospital association recognized the hospital with the highest percentage of employee participation in their newsletter and throughout the press. 49 MCPC, the Montgomery County Health Department, and the Montgomery County Commerce Department could partner with local hospitals, universities, employers, and related membership organizations like the Montgomery County Chamber of Commerce to promote institutional participation in local food events. Tap Into the Growing Craft Beer Scene The Brewers Association, a not-for-profit trade association dedicated to promoting craft brewers, defines craft breweries by their small production size, independent ownership, and use of traditional ingredients and practices. 50 Consumer interest in craft beers, especially those brewed locally, has been growing for years. As a result, this increase in consumer demand has catalyzed a proliferation of local craft breweries. According to data published in March 2017 by the Brewers Association, 98.7 percent of all breweries in the United States are craft breweries, a category that includes craft brewpubs, microbreweries, and regional craft breweries. In addition, small and independent craft brewers represent 12.3 percent market share by volume and 21.9 percent market share by retail dollar value of the overall beer industry. 51 In Pennsylvania, the number of breweries almost doubled in two years, growing from 104 breweries in 2014 to 205 breweries in Additionally, in 2016, Pennsylvania breweries produced over 3.9 million barrels of craft beer, the largest 49 Maryland Hospitals for a Health Environment, University of Maryland School of Nursing, Local Foods to Local Hospitals: January 1, 2009 August 31, Federal-State Marketing Improvement Program Grant, USDA Agricultural Marketing Service. gov/sites/default/files/media/md% pdf (Accessed May 2017). 50 Brewers Association, Craft Brewer Defined, statistics/craft-brewer-defined/ (accessed June 27, 2017). 51 Abby Cohen, Steady Growth for Small and Independent Brewers, Brewers Association, March 28, 2017, production volume of any state. This national and statewide growth in craft brewing can be seen in Montgomery County, which currently boasts at least 12 breweries and three distilleries. The rise of the craft beer industry isn't just good for beer drinkers. In fact, the Brewers Association found that the Pennsylvania craft brewing industry had an impact of $4.5 billion on the state economy in 2014, employing over 32,000 full-time equivalent people. 52 This makes Pennsylvania the second-largest craft brewing industry in the United States behind California, up from fourth in The economic impact of craft MONTGOMERY COUNTY BREWERIES AND DISTILLERIES Appalachian Brewing Company Collegeville, PA Blueprint Brewing Company Harleysville, PA Boardroom Spirits Distillery Lansdale, PA Conshohocken Brewing Company Conshohocken, PA Crooked Eye Brewery Hatboro, PA Five Saints Distilling and International Spirits Norristown, PA Forest & Main Brewing Company Ambler, PA Iron Hill Brewery & Restaurant Ardmore, PA Iron Hill Brewery & Restaurant Huntingdon Valley, PA Iron Hill Brewery & Restaurant North Wales, PA Manatawny Still Works Pottstown, PA Prism Brewing Company Lansdale, PA Round Guys Brewing Company Lansdale, PA Sly Fox Brewing Company Pottstown, PA Stickman Brews Royersford, PA Tin Lizard Brewing Bryn Mawr, PA Tired Hands Brewing Company Ardmore, PA 52 Brewers Association. "Total Economic Impact 2014." com/brewersassoc/wp-content/uploads/2017/04/state-by-state-breakdown_2014.pdf (Accessed May 2017). 53 Tom Butzler, Pennsylvania Growers Look at Alternatives for Expanding Business Opportunities, Penn State Extension, February 22, 2016, vegetable-fruit/news/2016/pennsylvanian-growers-look-at-alternatives-for-expandingbusiness-opportunities. 42

49 beer extends to the farmers who grow barley and hops, two of the main ingredients in beer. As consumers in general are increasingly interested in purchasing products sourced and made locally, more and more craft beer drinkers are also looking for products with local provenance. Not only are consumers seeking out local breweries, but brewers are sourcing locallyproduced ingredients to incorporate into their beers as well. This creates an opportunity for farmers in areas with a strong craft brewing industry, such as Montgomery County. Draw on Fair Food's Grain Value Chain Efforts In the spring of 2016, the USDA selected Fair Food Philadelphia as one of 10 organizations to receive funding to support a full-time food value chain coordinator as part of its new Food LINC program. Food LINC, which stands for Leveraging Investment for Network Coordination, is a three-year initiative spearheaded by the USDA and its philanthropic partners. Its intention is to link demand for local food in urban areas with supply from farmers and other food producers United States Department of Agriculture, Food LINC, d/0b9usln7r11iamfittdllq1hnae0/view (accessed July 10, 2017). Local Food with Buy Fresh Buy Local Labels at Fair Food Farmstand Source: Flickr User Harry Hunt FAIR FOOD Fair Food, originally started as a program of White Dog Community Enterprises, works to connect farmers to markets in the Philadelphia region. It does this through the Fair Food Farmstand in Reading Terminal Market, restaurant consulting, value chain coordination, farmer outreach and workshops, publications, and wholesale and retail guides. Fair Food also hosts two major regional food events Philly Farm & Food Fest and The Brewer's Plate to provide chefs, wholesale buyers, and consumers the opportunity to connect with local farmers, artisans, and brewers, while developing a greater appreciation for the local food system. With the Food LINC funding, Fair Food has committed to supporting two segments of the Greater Philadelphia food system: the local grain and local cheese economies. More specifically, Fair Food is working to restore the local grain economy by assessing market demand and existing infrastructure for grain storage and processing. In the fall of 2016, Fair Food partnered with the Penn State Extension and Deer Creek Malthouse to conduct a Mid-Atlantic Grain Producer survey to identify the farmers, processors, and distributors working throughout the grain supply chain in Delaware, Pennsylvania, and New Jersey. The survey found that while a majority of farmers were interested in expanding their production, many saw either a lack of access to market outlets or the lack of market outlets in general as limiting factors in their grain production. A summary of survey responses, as well as a map of partners involved in the grain industry, can be found on Fair Food's website. Additionally, Fair Food partnered with the University of the Sciences and Deer Creek Malthouse to convene the Philadelphia Grain and Malt Symposium in March Ultimately, Fair Food hopes to rebuild a strong, regional grain supply chain, enabling small and mid-sized producers to take advantage of new market opportunities. Given the proliferation of breweries and distilleries in Montgomery County in recent years, Fair Food's focus on reestablishing a local supply chain 43


50 Figure 24: Breweries and Distilleries in Montgomery County 313 BUCKS COUNTY 563 BERKS COUNTY POTTSTOWN CHESTER COUNTY LANSDALE NORRISTOWN 2 Breweries 322 Distilleries 1. Barren Hill Tavern & Brewery, Lafayette Hill 2. Conshohocken Brewing Company, Conshohocken 3. Crooked Eye Brewery, Hatboro 4. Forest & Main Brewing Company, Ambler 5. Prism Brewing Company, Lansdale 6. Round Guys Brewing Company, Lansdale 7. Sly Fox Brewing Company, Pottstown Stickman Brews, Royersford 9. Tin Lizard Brewing, Bryn Mawr 10. Tired Hands Brewing Company, Ardmore 1. Boardroom Spirits Distillery, Lansdale 2. Five Saints Distilling and International Spirits, Norristown 3. Manatawny Still Works, Pottstown PLYMOUTH MEETING KING OF CONSHOHOCKEN PRUSSIA E 76 PHILADELPHIA COUNTY DELAWARE COUNTY Miles 4

51 CASE STUDY: FAIR FOOD VALUE CHAIN COORDINATOR Founded in 2001, Fair Food is a non-profit organization that connects local farmers to nearby businesses and consumers in the Philadelphia area. Fair Food began their work as a means of promoting local food sourcing practices, originating from the West Philadelphia restaurant, White Dog Café. Today, their work has expanded to include hundreds of food producers, ranging in size from small farms to mid-size growers, who they then connect to restaurants, food markets, and other institutions throughout the city. In 2012, Fair Food hired its first Value Chain Coordinator, Alexandra Jones, supported by a grant from USDA s Value Chain Development Initiative. Value chain coordinators bridge the gap between local food suppliers and local demand, and work to enhance the soft infrastructure of food systems namely, the relationships between actors in order to maximize the utility of the hard infrastructure investments designed to accommodate the movement of goods throughout the food system. Jones began her work at Fair Food doing part-time value chain coordination primarily with suppliers, matching small farms to buyers, but as buying local became increasingly popular, Fair Food required greater capacity to meet the demand. In order to provide the necessary trainings for restaurants and other buyers to receive wholesale from local suppliers, Jones became a full-time value chain coordinator in A year later, Fair Food received a grant from the USDA s Value Chain Development Initiative, which supported Jones position. On a day-to-day basis, Jones juggles a number of varied roles. A fairly typical interaction might be getting a call from a local confectionery whose dairy supplier is going out of business. Though often able to identify potential new suppliers on the spot, sometimes finding the optimal connections requires additional research or making a few calls. Jones also works on other grantfunded projects and spends time researching new foods that producers are branching into, like the grain value chain for human consumption and beer production. At times, her work will even bring her out to deliver goods to different buyers, working on the wholesale delivery side of coordination. Though valued by suppliers and buyers alike, value chain coordination is not without its challenges. For one, it is difficult to measure success because, as a coordinator, Jones establishes a connection between two parties, but often does not get to see whether or not that connection materializes into a new business deal or partnership. Even if a deal is made, it was difficult to assign a dollar value to the establishment of that new connection. Aside from being difficult to monetize, it is also difficult to operate without a sustainable funding source. A really big challenge of doing value chain coordination as, essentially an unpaid consultant, explains Jones, is that both supply and demand stakeholders would express their gratitude and say that it was valuable and that they didn t know where else they would be able to get that information, but it s really hard to get people to actually pay for it as a service. For organizations that are looking to create positions for value chain coordinators, Jones says that it is important to clarify that value chain coordination is an important tool that is useful at certain times in the food process, but should not be a permanent position. Instead, it s a profession with a limited tenure of approximately two years, where success looks like working yourself out of a job. Those looking to work as value chain coordinators should be flexible and responsive to the shifting needs of the local food community. There is value in value chain coordination, she says. But it s not one-size-fits-all. 45
.")
52 that connects locally-grown hops and malts to local distillers and brewers is very timely (see Montgomery County Breweries and Distilleries on page 42 and Figure 24: Breweries and Distilleries in Montgomery County on page 44). Montgomery County should tap into these efforts to ensure that Montgomery County-based farmers, brewers, and distillers are connected to Fair Food's process, that their voices are heard when Fair Food assess infrastructure gaps, and that their needs are considered when Fair Food proposes supply chain solutions. In addition to incorporating Montgomery County farms and businesses into Fair Food's Food LINC work, the county could work with Fair Food to help brewers and distillers incorporate local ingredients like hops, barley, or honey into their products. Through its value chain coordination work, Fair Food can help brewers and distillers identify and source locally-grown products (see Case Study: Fair Food Value Chain Coordinator on page 45). Although there are not many Montgomery County farms currently growing malting barley or hops, brewers and distillers can still source ingredients used to flavor their products, such as peaches or ginger, from local farms. See Case Study: Circle of Progress Pale Ale on page 47 for an example of a local brewer working with a local farmer and local malter to develop a truly local beer. Support Farmers Growing Malting Barley and Hops Craft brewers are increasingly turning to locally-sourced ingredients, such as malting barley and hops, to both create a unique product and satisfy a growing consumer demand for local goods. Malting barley, the type of barley used in brewing, is a distinct type of barley that differs from feed barley, which is more commonly grown in Pennsylvania. Malting barley is riskier to grow than feed barley because the standards are higher and therefore more difficult to meet. Although barley (including malting barley) is commonly grown in the upper Midwest and Northwestern parts of the United States, a small market exists in Pennsylvania. The USDA Census of Agriculture reports that there were over 2,600 Pennsylvania farms growing barley in 2012, making up approximately two percent of the total acres Two Particular Acres Hops in Royersford, PA Source: Montgomery County Planning Commission of barley harvested in the United States. In the same year, six farms in Montgomery County reported growing barley, which represents a significant increase from one farm in Combined, those six farms grew 32 acres of barley for a total of 1,915 harvested bushels. Although there is no specific data on the size of malting barley production in Pennsylvania, Penn State Extension notes that malting barley can be grown throughout the state. In fact, Montgomery County is actually in the best area in Pennsylvania for growing malting barley because there is a greater chance of winter survival. 55 The increasing demand for beer made with locally-grown ingredients has led not only to an increasing demand for locally-grown malting barley, but also to the development of malt houses in Pennsylvania Greg W. Roth, Austin Kirk, and Alyssa Collins, Agronomy Facts 77: Malting Barley in Pennsylvania, Penn State Extension, 2016, small/production/malting-barley (accessed July 5, 2017). 56 Ibid. 46
53 CASE STUDY: CIRCLE OF PROGRESS PALE ALE In 2015, Sly Fox Brewing Company, Double Eagle Malt, and Two Particular Acres Farm teamed up to create a beer from grains that were grown, malted, and brewed in Montgomery County. Representatives from both Sly Fox Brewery and Double Eagle Malt spoke about the many benefits of sourcing locally, specifically the benefits to the community, the environment, and the local economy. Tim Ohst, Operations Manager at Pottstown, Pennsylvania-based Sly Fox Brewery, noted that getting to sit down at the bar in a local brew pub and drink a beer with the same guy that cultivated the barley you brewed it with, just a few miles away, is far more rewarding than downing another product made and shipped from halfway around the world. Alan Gladish, owner and founder of Double Eagle Malt located in Huntingdon Valley, Pennsylvania, explained that local collaboration allows them to visit the farms in person and establish relationships with the farmers and their families, as opposed to speaking to a far-off entity on the phone. This makes their work more rewarding and helps to ensure a highquality finished product. In addition to the community connections and relationships that come out of local collaboration, Ohst emphasized that reducing their environmental impact was a major guiding principle for their collaboration. Two Particular Acres responsible growing practices, their reuse of spent grain for compost for the next barley crop, and shorter shipping distances allowed Sly Fox to create a more environmentally-friendly beer. Finally, investing in other local businesses through collaboration helps support the local economy and bolster the culture of local buying. Of course, successful collaborations do not come without challenges. Both representatives said that barley and hops are tricky to source locally due to the economy of scale that has affected grain production. Historically, agriculture in Montgomery County was very diverse: many small farms grew a large variety of crops, including grains, in small quantities. Grain was particularly dominant in Southeastern Pennsylvania during the early 1800s, but pest problems, soil exhaustion, and eventual development pressures led to a decrease in diversified production. States like North Dakota and Idaho, where grains flourished, developed large-scale operations for grain production, incentivized by a series of legislative actions in the early 20th century. This production structure, which still exists today, has made it difficult for small, local producers to offer competitive pricing, as they tend to have smaller harvests and less extensive distribution networks than their larger, Western counterparts. Ohst noted that although this production structure makes it especially challenging for large breweries to buy from smaller producers, it is becoming more common for local craft breweries and brewpubs to partner with similarly-sized businesses and farms. Additionally, the increasing customer interest in local sourcing has helped to spur more local collaboration. Another challenge of sourcing locally is the nature of the crop. Gladish mentioned that barley is a relatively risky crop and can be vulnerable to head blight. Despite this, Double Eagle Malt still sources 100 percent of the inputs for their malts locally, specifically from four to five farms. In November 2015, the four businesses hosted a debut of their local brew at Sly Fox Brewery s Tasting Room. There, customers tried the outcome of their collaboration, the Circle of Progress Pale Ale. Customers had the opportunity to meet the farmer who grew the grains, the maltsters who malted the barley, and the brewer who crafted the beer. Since then, Sly Fox has released three more variations of the brew, underlining the success and sustainability of the partnership. 47
54 For example, Double Eagle Malt in Huntington Valley describes itself as a "craft malthouse and sources its grains from within a 100-mile radius. They also work with farmers to ensure an adequate supply of high-quality malting barley and with Delaware Valley University to conduct agricultural research around malting barley. 57 Penns Mault in Spring Mills and Deer Creek Malthouse in Glen Mills are also examples of recently-established Pennsylvania maltsters that use locally-sourced grain and have found a demand for their product. Similarly to malting barley, there has been a recent resurgence of hop production throughout the country. According to the USDA National Agricultural Statistics Service, the number of acres of hops harvested in the United States grew from 43,302 in 1997 to 53,282 in 2017, an increase of 23 percent over the 20 year period. 58 The increase in the value of hops produced has been even more dramatic. Between 1997 and 2017, the value of hops produced grew from $183.3 million (adjusted for inflation) to $617.8 million an increase of 237 percent which far outpaces the increase in acres produced. Figure 25: Hop Production 59 Acres Harvested Production Measured in $ (1,000) ,302 29,309 29,683 50,857 53,282 $183,355 $152,818 $199,957 $513,372 $617,836 Source: USDA National Agricultural Statistics Service 57 Double Eagle Malt, "Delaware Valley University," 2017, delval-college.html (accessed July 5, 2017). 58 United States Department of Agriculture, National Agricultural Statistics Service, "Statistics by Subject: National Statistics for Hops," April 29, 2016, nass.usda.gov/statistics_by_subject/result.php?8a7d06bf-dda5-3dff-9c ced51da6§or=crops&group=field%20crops&comm=hops. 59 Dollar figures are expressed in 2017 dollars, and have been adjusted for inflation based on the Bureau of Labor Statistic s Consumer Price Index for the Philadelphia Metro area. The Hop Growers of America, a national trade association, noted several key drivers for this increase in hop production including a demand for hoppy, aromatic beers such as India Pale Ales, a demand for local hops as part of an overall locavore movement, and a demand for green hops used in wet-hopped beers. While hops have traditionally been grown in the northwestern region of the United States, they can also be grown successfully in Pennsylvania. According to the Hop Growers of America s 2016 Statistical Report, there were only an estimated 15 acres of hops grown in Pennsylvania in Although this is an extremely small amount of land, it represents a 173 percent increase from an estimated 5.5 acres of production in 2015 and is consistent with reported acreage in the neighboring states of New Jersey and Maryland. 60 Despite the 2016 growth, Pennsylvania has a long way to go until it can begin to partially support the state s booming craft brewing industry. According to Penn State Extension, Hops are one of the most critical ingredients for the microbrewery industry and Pennsylvania s craft breweries cannot regularly source Pennsylvanian grown hops for use in their brewing process. 61 As a result, there is an opportunity for farmers to tap into this increasing demand for locally-grown hops. Montgomery County can simultaneously support its growing craft beer industry as well as its existing farmers by encouraging the production of malting barley and hops. One way that it could do this is to conduct an economic analysis of the feasibility of commercial malting barley and hop production in the county. The county could partner with organizations like Fair Food, Penn State Extension, or Delaware Valley University to study factors such as market demand, equipment requirements, soil conditions, and the potential to serve alternative buyers outside of the brewing industry. Vermont and Massachusetts recently partnered to fund such a 60 Hop Growers of America, 2016 Statistical Report, January 2017, img/blog_pdf/76.pdf. 61 Penn State Extension, "Pennsylvania Growers Look at Alternatives for Expanding Business Opportunities," Vegetable, Small Fruit, and Mushroom Production, February 22, 2016, 48

55 support the grain value chain work being done by Fair Food and would continue to support the local craft brewing industry in Montgomery County. Develop a Montco Local Ale Trail Tourism trails are a popular way to promote a specific type of destination that is thematically linked and geographically clustered. Given the density of craft breweries in Montgomery County, developing a comprehensive guide to Montco breweries would help to promote the county s beer scene and highlight its culture of brewing. Forest and Main Brewing Co. in Ambler, PA Source: Stacey Salter Moore study, which concluded that it is feasible to commercially grow hops in New England. 62 The county could also partner with Penn State Extension or Delaware Valley University to further agricultural research on malting barley and hops in Pennsylvania and provide technical assistance to farmers who grow these crops. In particular, it should encourage Penn State Extension to continue its malting barley crop research and breeding programs. 63 Lastly, the county could facilitate conversations between farmers, maltsters, and brewers through educational workshops and conferences. This would 62 Rosalie J. Wilson Business Development Services, Feasibility and Market Research Study for Commercial Hop Production in New England, Vermont Agency of Agriculture, Food, and Markets and Massachusetts Department of Agricultural Resources. September 30, 2010, 63 Amy Duke, "Malting Barley Research at Penn State Aims to Support Craft Beer Industry," Penn State News, June 22, 2017, research/malting-barley-research-penn-state-aims-support-craft-beer-industry. Across the United States, beer trails exist at city, regional, and state scales, are organized by a variety of organizations, and range from simple lists to interactive maps to passport programs. For example, the Bucks County Ale Trail divides the county into three sections and lists breweries located in each section along with a short description of their products and options for visitors. It is organized by Visit Bucks County, the official tourism promotion agency for Bucks County, and is available as a website. The Asheville Ale Trail in western North Carolina offers a Field Guide to breweries, bars and tap rooms, and bottle shops, which is available on a website, in a mobile app, and in print versions that are distributed to over 150 locations. The Asheville Ale Trail website hosts an events calendar and contains maps with itineraries for driving, biking, and walking between various locations. It is run by a private company and is not organized by a tourism agency. Loudoun County, Virginia highlights different transit modes and themes for their trail, including driving and biking, as well as a farm breweries tour. Another beer trail model is a variation of a passport program, where participants log visits to breweries and receive special discounts or promotional merchandise after reaching a certain threshold. Brewers associations in Vermont, Maine, and Massachusetts organize these types of guides, which also provide maps and information about each brewery. Similarly, Discover Lancaster, the marketing organization for Lancaster County, sponsors the Lancaster County Wine, Spirits, and Ale Trail. Visitors 49
56 can purchase a trail book at the Visitors Center, which contains special offers for participating locations. When visitors stop by a participating location, they receive a stamp in their book. When they bring the book back to the Visitors Center with at least four stamps, they receive a free T-shirt. The rewards programs don t put a time limit on when visits must be completed or when the passport must be redeemed. As the Maine Brewers Guild notes, The purpose of the Trail is to give visitors a unique way to enjoy the vibrant micro and craft brewing industry found throughout the state. 64 Currently, Visit Philly, the official regional attractions marketing agency for Greater Philadelphia, promotes the Philadelphia Craft Beer Trail with an online guide and interactive map of the region s craft breweries, including 12 in Montgomery County. Montgomery County could build on this exposure by working with the Valley Forge Tourism & Convention Board to develop a Montco Local Ale Trail guide and passport program. The guide would ideally include maps and visitor information such as location, hours of operation, and available activities like tastings or food service. The passport program would be a way to incentivize people to visit multiple breweries in the county and would help promote this unique industry. Similar to other passport programs, visitors would receive a stamp for each brewery they visit and would be able to redeem their passport for merchandise after accumulating a specific number of stamps. The County may also consider developing an app or mobile version of the guide and passport program, which would make it more accessible for users. Expand Local Food Promotion Efforts Leverage Existing Promotional Programs As noted in the Existing Local Food Promotion Programs section on page 25, a number of local food promotion efforts already exist in the region. While not specific to Montgomery County, they all include the county within their programmatic boundaries. In order to conserve limited resources CASE STUDY: BUY FRESH BUY LOCAL OF THE GREATER LEHIGH VALLEY Buy Fresh Buy Local of the Greater Lehigh Valley (BFBLGLV) is one of the eight active Buy Fresh Buy Local chapters in Pennsylvania coordinated by the Pennsylvania Association for Sustainable Agriculture (PASA). The Greater Lehigh Valley chapter includes Berks, Lehigh, and Northampton Counties and provides a variety of resources and information to residents, including a local food guide, an interactive local food map, farm to school programming, a farm to table restaurant guide, and a wholesale food guide. One of the unique programs offered through the BFBLGLV is their Double SNAP program, which provides a one-to-one match for every SNAP dollar spent by residents at participating farmer s markets, effectively doubling buyers purchasing power (up to $10 per day). The chapter s Farm to School programming provides local children with educational opportunities to learn about seasonal produce, nutrition, and growing processes. In the school year, BFBLGLV launched the Harvest of the Month pilot program, which allowed children to sample different local food items each month, including a variety of apples, heirloom tomatoes, and a kale salad. BFBLGLV also organizes a Buy Local Challenge, asking local residents to commit to spending $10 per week on local foods. Similar to the NC 10% Campaign, participants can pledge to spend a certain amount on local foods throughout the 2016 growing season. As of September 2016, 1,452 people pledged to spend $184,000 on local foods Buy Fresh Buy Local Greater Lehigh Valley Buy Fresh Buy Local Greater Lehigh Valley, (accessed October 3, 2016). 64 Maine Brewers Guild, "Beer Trail," 2017: 50
57 and capitalize on existing opportunities, Montgomery County should utilize or leverage these programs. First, Montgomery County should continue to promote its newly released local food guide, Direct from the Farm. Currently, the Guide is only available at MCPC s offices and on their website. The Planning Commission should publish additional copies and make them available at local farmers' markets, libraries, other county facilities like historic sites or health centers, and at local visitor centers like the one at Valley Forge National Historic Park. Montgomery County may also want to encourage local farmers and food retailers to take advantage of existing marketing programs like PA Preferred or Buy Fresh Buy Local. Although there is a membership fee associated with Buy Fresh Buy Local, PA Preferred is available to Pennsylvania producers and retailers for free. While PA Preferred doesn t have the brand recognition that other promotional programs have, it does offer a number of benefits and may become more worthwhile as more retailers and producers join and add the PA Preferred logo to their packaging, raising public awareness of the PA Preferred brand. Buy Local Challenge/Buy Local Week Buy Local campaigns are one way that local governments and residents can support a strong local economy. As noted in a Sustainable Jersey Buy Local Campaign Guide, Buy Local or Think Local First campaigns focus on educating consumers about the economic and social advantages that independent and local businesses bring to a community. The goal of these campaigns is to create a thriving local economy by maximizing the potential of local businesses. 66 To implement a Buy Local campaign in Montgomery County, the Planning 66 Sustainable Jersey, Buy Local Campaign, sjcert_action%5baction%5d=getpdf&tx_sjcert_action%5bcontroller%5d=action&chash=86 ae2d89ffec7c c8f7206a849 (accessed October 4, 2016). BUY LOCAL CAMPAIGN RESOURCES A number of resources exist to help communities develop Buy Local campaigns. A few are listed below: American Independent Business Alliance (AMIBA): Building Buy Local Campaigns that Shift Culture and Spending: A Guide to Helping Your Independent Businesses and Community Thrive Sustainable Connections Consulting: Tip Sheet: Think Local First Campaign Institute for Local Self-Reliance (ILSR): How to Start a Buy Local Campaign Commission could partner with organizations like Penn State Extension, the Pennsylvania Association of Sustainable Agriculture, the Montgomery County Chamber of Commerce, the Valley Forge Tourism and Convention Board, farmers market managers, local restaurant associations, and other local agricultural or economic development organizations. Many Buy Local how-to guides recommend forming a steering committee comprised of local business owners, government representatives, and downtown business association staff to help guide the direction of the campaign and recruit participants. In a local food-focused Buy Local campaign, the steering committee should also include representatives of the local agricultural and food retail communities. Although strong collaboration and buy-in from local businesses and organizations are required for successful Buy Local campaigns, there are a number of different ways to organize them. Montgomery County could choose to develop a Buy Local Week Challenge, much like the Southern Maryland Agricultural Development Commission s (SMADC) Buy Local Challenge where residents commit to eating at least one item from a local farm every day for one week (see Case Study: Southern Maryland Agricultural Development Commission s Buy Local Challenge on page 52). Other challenges run throughout the growing season and ask consumers to commit to purchasing a certain percentage of food from 51
58 CASE STUDY: SOUTHERN MARYLAND AGRICULTURAL DEVELOPMENT COMMISSION S BUY LOCAL CHALLENGE Maryland has long enjoyed a strong agricultural base; however, by the mid-1990s, the decline of the tobacco industry threatened many farmers livelihoods especially in Anne Arundel, Calvert, Charles, Prince George s, and St. Mary s counties. In 2000, Maryland legislators created a program to help Southern Maryland s tobacco farmers transition from growing tobacco to other agricultural products and alternative farming models, like agritourism. The legislature created the Southern Maryland Agricultural Development Commission (SMADC) to administer the program, which is commonly referred to as the Tobacco Buyout. SMADC is funded through annual payouts of the 1998 Master Settlement Agreement with major tobacco companies. SMADC also receives grant funding and raises capital through advertisement sales. Initially, SMADC offered workshops on a variety of topics, from choosing crop varieties to business skills, like marketing, legal assistance, and liability. SMADC also assisted farmers with creating business plans, navigating complicated legislation, and securing grants for capital improvements. Through its work, SMADC realized that it needed to increase public awareness of and demand for the region s new agricultural products and activities. SMADC launched the Buy Local Challenge (BLC) in 2007 to highlight the benefits of buying local. The Buy Local Challenge is a personal commitment to support farms by eating at least one item from a local farm every day during Buy Local Week, an annual event held during the last week of July. The BLC program s website explains why consumers should participate in the challenge by emphasizing that buying local is good for consumers, the local economy, and the planet. The website also features a section called Where to Buy Local, which lists links to help customers identify farms, farm stands, markets, and restaurants that offer local products. SMADC also provides promotional materials, such as logos, flyers, and press releases, for download free of charge to encourage restaurants, stores, and institutions, like hospitals and universities to participate in the challenge. In addition to the web resources, SMADC promotes the BLC through Twitter and Facebook. The social media component of the campaign allows SMADC to share photographs, recipes, and videos from local television stations and elected officials who support the campaign. It is also a way to promote local farmers, farmers' markets, restaurants, and events. In the inaugural year, Maryland Governor Martin O Malley joined more than 60 local farmers and state and local officials for a kickoff luncheon at the Walters farm in Charles County. Since then, the program has grown substantially, with more consumers engaging with the Challenge through social media and more associations endorsing the Challenge. In 2015, the Capital Gazette, an Annapolis-based newspaper, supported the Buy Local Challenge by highlighting a different local farmer each day. Additionally, 24 Maryland hospitals and healthcare organizations pledged to take the challenge. In SMADC s Market Analysis and Strategic Plan, Objective 1.4 is to increase the consumer market for the region s farm products by 10 percent by One way that SMADC intends to do this is by expanding the Buy Local Challenge to include winter and spring information. In 2010, SMADC invited all states to participate in the annual Buy Local Challenge in hopes of transforming the Buy Local Challenge into a unified nationwide effort to highlight local farms during the last full week in July. 52

59 local sources (see Case Study: The 10% Campaign on page 35). The Central Illinois Eat Local Challenge 2016 focused on the entire month of September since farm sales in their region tended to decline in September even though farmers still had plenty of terrific produce. Regardless of the time frame or format, Buy Local campaigns are, at their core, marketing campaigns and require the development of campaign and educational materials. Many Buy Local campaigns created Buy Local campaign logos, flyers, window decals, social media posts, web pages, and Buy Local directories to promote their campaigns and local businesses. As noted in the case study, SMADC was very successful at building participation through social media. They also engaged political figures like the governor to help promote the campaign at special kickoff events. Similarly, Montgomery County could invite County Commissioners and other local celebrities to a kickoff event for a Buy Local Week in collaboration with the annual 4-H Fair that is held every August. Ultimately, Buy Local campaigns aim to change people s purchasing patterns, which can be very challenging. People may need to be reminded repeatedly of the benefits of buying local. While the change may not be immediate, campaigns can generate increased revenue for local businesses and help to create a stronger culture of supporting local farmers and food producers over time. Implement a Montco Food Bucks Program A number of local, state, and national nonprofits and government agencies have created programs that allow recipients to earn additional buying credits for each dollar of Supplemental Nutrition Assistance Program (SNAP) benefits that they spend at eligible farmers markets. These programs strive to both increase access to healthy food and generate higher sales for farmers. One example of such a program is the Michigan-based Fair Food Network s Double Up Food Bucks program, which provides participants with a dollar Philly Food Bucks Source: Dave Tavani, The Food Trust in Double Up Food Bucks for every dollar they spend on SNAP-eligible foods with their EBT card (up to $20). Double Up Food Bucks can only be redeemed for Michigan-grown fresh fruits and vegetables. 67 Beginning in August 2016, SNAP recipients could also earn Double Up Food Bucks by purchasing Michigan-grown food at participating grocery stores in Detroit, West Michigan, North Michigan, and the Upper Peninsula. Similar to the farmers market program, individuals receive up to $20 in Double Up Food Bucks for every SNAP dollar they spend on Michigan-grown fruits and vegetables. Closer to Montgomery County, Philly Food Bucks is a program that provides shoppers with an additional $2 for every $5 of SNAP benefits spent on fruits and vegetables at 25 farmers markets throughout Philadelphia. The program is operated by The Food Trust and the Philadelphia Department of Public Health s Get Healthy Philly program. The Food Trust has found 67 Fair Food Network, "Double Up Food Bucks," (accessed October 5, 2016). 53
60 that since the introduction of Philly Food Bucks, SNAP sales at The Food Trust s farmers markets has increased by more than 375 percent. These additional revenue sources directly contribute to the sustainability of local agriculture by boosting the revenue of Pennsylvania farmers. 68 In 2015, The Food Trust piloted an innovative new program to offer its Philly Food Bucks program in a supermarket for the first time. The Food Trust partnered with the Burns Family Neighborhood Markets Fresh Grocer at 56th and Chestnut Streets in Philadelphia to test this new distribution model. Similar to the farmers market program, this partnership offered Fresh Grocer Price Plus club card members who use their ACCESS card a $2 digital coupon for every $5 that they spent on fresh fruits and vegetables. Although it was only a limited pilot program, it demonstrated that matching incentive programs could work in other retail settings. The Philly Food Bucks program has been very successful at encouraging SNAP recipients to use their benefits to purchase fresh fruits and vegetables at area farmers markets. While this model is great for increasing consumption of healthier foods, it does not always provide additional income to local farmers. Depending on how one defines local, many of the farmers at Philadelphia-area farmers markets are not local. Most come from outside of Philadelphia or even from outside the 100-mile foodshed. However, the Philly Food Bucks model could be reformatted to incentivize food purchases specifically from local farmers and food producers, similar to the Double Up Food Bucks program noted earlier. The Montgomery County Health Department or the Valley Forge Tourism and Convention Board could partner with The Food Trust to implement a Montco Food Bucks program that would provide shoppers with a coupon for purchasing food produced in Montgomery County. The program could be targeted to SNAP recipients as a means of increasing their buying power, or it could be directed toward all county residents to emphasize the 68 The Food Trust, "The Food Trust's Food Bucks Network: Encouraging Healthy SNAP (Food Stamp) Purchases," (accessed June 6, 2017). importance of local dollars staying in the local economy. Additionally, the county and its partners could pilot a Montco Food Bucks program during a Buy Local Week, potentially amplifying the effect of a Buy Local Week. Recognize Local Food System Partners Along with the promotional programs, Montgomery County could create an annual award to recognize different partners who are making a positive impact on the local food system. Currently, the county sponsors the annual Montgomery Awards Program, which promotes awareness of outstanding design and innovative planning in our communities by awarding successful land developments, revitalization efforts, open space enhancements, environmental sustainability, and transportation improvements. It also recognizes citizens and organizations that have made significant and sustained contributions to planning in Montgomery County through a Planning Advocate Award. 69 In 2009, the Delaware Valley Regional Planning Commission recognized four of Greater Philadelphia s food system leaders with the Local Food Economy Leadership award at its annual dinner. The awards were given to organizations that successfully leveraged collaborations with other stakeholders to create a more sustainable food system and were intended to expand the recognition of Greater Philadelphia's emerging local food economy." 70 Creating a Local Food System Award as part of the Montgomery Awards Program would highlight the work currently being done by individuals, businesses, and organizations, bringing greater attention not only to their efforts but also to Montgomery County's food system resources. It would signal to others that county leadership values its local food system and help to shape Montgomery County's agricultural identity. 69 Montgomery County, Pennsylvania, "Montgomery Awards Program," org/1288/montgomery-awards-program (accessed June 7, 2017). 70 Delaware Valley Regional Planning Commission, "Greater Philadelphia Local Food Economy Leadership Awards," (accessed June 7, 2017). 54
61 Review County and Municipal Policies to Better Support Local Farmers As noted in the Challenges and Opportunities to Promoting Local Food in Montgomery County section on page 27, farming can be a highly regulated industry with a number of federal, state, and local laws affecting farm operations. At the municipal level, many local governments regulate land use activities such as farm signage, farm markets, and on-farm events through their zoning code. With 62 different municipalities, the laws affecting farms in Montgomery County can vary greatly. Some municipalities impose significant burdens on farmers, while other municipalities are more permissive and allow certain activities by right. Reviewing county and municipal regulations, and working with municipalities to adopt more supportive ordinances, could ease the burdens farmers face in running profitable farm enterprises. Promote Model Sign Ordinances Signs can be an important part of a farm business, promoting seasonal items, identifying farm market locations, or highlighting upcoming events. When done correctly, they not only provide information, but also add to a community s character. However, when done incorrectly, they can create confusion, detract from the community s character, or even lead to unsafe situations. In order to protect the public s health and welfare, communities can regulate the location, size, number, and duration of signs. The most common way that communities do this is through the zoning code. To standardize and clarify the restrictions around signs, MCPC developed a comprehensive and content-neutral Model Sign Ordinance. The model sign ordinance is intended to help Montgomery County municipalities better balance the need for effective and informational signs with the desired safety and aesthetics of their communities. DVRPC recommends that MCPC work with municipalities, especially those located in the designated core agricultural area, to adopt sign ordinances that follow the Model Sign Ordinance to allow farms to safely advertise their business, while maintaining community character. SELECTED SIGN TYPES The model ordinance allows for several types of signs to be displayed without a permit, including temporary signs and flags. Other types of signs, such as freestanding signs, require a permit. Some of the sign types and restrictions are highlighted below. Banner: Any cloth, bunting, plastic, paper, or similar non-rigid material attached to any structure, staff, pole, rope, wire, or framing which is anchored on two or more edges or at all four corners. Banners are temporary in nature and do not include flags. Banners are considered a temporary sign and therefore do not require a permit. Flag: Any sign printed or painted on cloth, plastic, canvas, or other like material with distinctive colors, pattern, or symbols attached to a pole or staff and anchored along only one edge or supported or anchored at only two corners. Flags do not require a permit. Limited Duration Sign: A non-permanent sign that is displayed on private property for more than 30 days, but not intended to be displayed for an indefinite period. Limited duration signs require a permit, which is valid for one year, and can be renewed annually. Portable Sign: A sign designed to be transported or moved and not permanently attached to the ground, a building, or other structure. This includes sandwich board signs and vehicular signs. Portable signs require a permit as they are considered to be indefinite signs, even though the time they can be displayed is restricted. Temporary Sign: A type of non-permanent sign that is located on private property that can be displayed for no more than 30 consecutive days at a time. Temporary signs do not require a permit Model Sign Ordinance: A comprehensive, content-neutral approach to local sign control. Montgomery County Planning Commission. 2014, org/documentcenter/view/
62 Develop Model Agritourism Zoning Other regulatory challenges that arose during the stakeholder interview process were the zoning restrictions on operating agritourism businesses. As noted in the Agriculture in Montgomery County section of this report, farm-related income, which includes income from agritourism and recreational services, was the fastest-growing source of income for farmers in Montgomery County between 2007 and In 2006, the Center for Rural Pennsylvania found that there were between 24 and 48 agritourism providers in Montgomery County; however, at the same time, there were 49 or more agritourism providers in the surrounding counties, indicating that there may be a larger market for this service in Montgomery County. 72 Although agritourism currently only accounts for a small portion of all farm-related sources of income for Montgomery County farmers, both its recent growth within the county and its popularity in surrounding counties are indicators of its ability to be a more substantial source of income. This would be particularly beneficial for Montgomery County farmers since the market value of products sold is relatively low. As noted in Lancaster County s Agritourism Guidelines: For the Promotion and Regulation of Farm-based Tourism Enterprises, agritourism has the potential to: Enhance the economic viability of the farm and provide on-site employment opportunities; Generate additional income or off-season income for the farmer; Educate locals and visitors about the importance of farming in Montgomery County; Increase awareness of local agricultural products; and Develop a new consumer market niche Susan D. Ryan, and Sean A. Hayes, Your Agritourism Business in Pennsylvania: A Resource Handbook: Getting Started and Keep Going in Agritourism (The Center for Rural Pennsylvania, Harrisburg, Pennsylvania: July 2009), handbook.pdf. 73 Agritourism Guidelines: For the Promotion and Regulation of Farm-based Tourism Enterprises. Lancaster County Planning Commission and Lancaster County Tourism Development Council. (Lancaster County, Pennsylvania: February 2009), lancastercountyplanning.org/documentcenter/home/view/139. To support agritourism AGRITOURISM ENTERPRISE enterprises within Activities conducted on and accessory the county, MCPC to a working farm and offered to the should develop public or to invited groups for the model agritourism purpose of recreation, education, or zoning ordinances active involvement in the farm operation. These activities must be directly related and then work with to agricultural or natural resources and municipalities to incidental to the primary operation of the adopt their own farm. 74 versions. Agritourism zoning should 74 Agritourism Guidelines: For the Promotion balance the potential and Regulation of Farm-based Tourism economic benefits Enterprises. Lancaster County Planning of agritourism with Commission and Lancaster County Tourism Development Council. (Lancaster County, potential public health Pennsylvania: February 2009). and welfare concerns, such as additional traffic and noise. When drafting a model agritourism ordinance, the county may want to include regulations around farm size, farm structures, liability insurance, visitor management, hours of operations, signage, food and beverage sales, and parking. The county may also want to promote the adoption of Agritourism Overlay Zones that permit certain activities by right, such as farm markets, farm tours, or wineries. These zones would be most appropriate in the core agricultural areas already identified in Montco By developing a model agritourism zoning ordinance, the county would help its municipalities better support local farmers in a market-driven way. Agritourism zoning would give farmers the right to establish farm-related businesses that could provide additional income and help to make their farms more profitable. 56

63 Continue to Support Farmland Preservation Initiatives Montgomery County plays an important role as a key actor promoting Pennsylvania s strong culture of farmland preservation. Through the Montgomery County Farmland Preservation Program and the Montgomery County Agricultural Land Preservation Board, the county works with the Penn State Extension, the Montgomery County Conservation District, and land trusts to facilitate conservation easements and provide technical assistance to farmers. Since its inception in 1990, the Farmland Preservation Program has used easements as a tool to preserve valuable farmland by restricting a property s land use to agricultural uses. Although the use is restricted, the property stays in private ownership and can be sold to new owners. Using a combination of state, county, and occasionally local funds, the county purchases easements from willing property owners, who are then required to grow productive crops or pasture on the land in perpetuity. an additional $2.6 million in state funding. In order to help make farmland affordable to a new generation of farmers, preserve the county's character, and achieve the Montco 2040 farmland preservation acquisition goal, DVRPC encourages Montgomery County to continue to provide strong funding and support for farmland preservation. Farmland preservation planning is also incorporated into the county s most recent comprehensive plan, Montco 2040: A Shared Vision, which was adopted in January As noted in the Farmland Preservation section on page 19 of this report, one of the goals of Montco 2040 is to increase the total acreage of preserved farmland as well as the number of preserved farms. According to the plan, The goal is to preserve at least 6,000 more acres on 100 more farms by 2040, for a total of 14,600 acres and 246 farms by Prime agricultural land and soils should be a priority for preservation when farms are preserved. 75 In order to meet its goal, the county will need to preserve an additional 86 farms and 5,196 acres of farmland in the next 23 years. Although county-level funding for farmland preservation has dropped significantly since 2010, hitting a historic low of $61,098 in 2015, County Commissioners recently increased county funding for farmland preservation. In 2017, the county allocated approximately $1.1 million for farmland preservation, leveraging 75 Montgomery County Planning Commission. Montco 2040: A Shared Vision, The Comprehensive Plan for Montgomery County. Montgomery County, Pennsylvania (accessed September 26, 2016). Living Hope Farm, a preserved farm in Harleysville, PA Source: Living Hope Farm 57

64 Upper Merion Farmers' Market Source: Montgomery County Planning Commission
65 Conclusion As the Vermont Farm to Plate Strategic Plan notes, Food system development is economic development. 76 By recognizing this fact through the preparation of a local food promotion plan, Montgomery County is leveraging a consumer preference for local food to enhance its economy and reinvest local dollars into the community. However, food systems are complex. Connecting farmers and food producers to markets, improving residents access to farm-fresh produce, and preserving agricultural land are challenges that many communities seek to address. These issues also transcend geopolitical boundaries, and Montgomery County can only do so much on its own to influence a food system that extends far beyond its borders. is to educate consumers and create a greater awareness of the food system. There are already resources in place in Montgomery County to connect food producers and food buyers, but there is room for growth, which is why these recommendations build on existing initiatives as well as advance new ones. Strong local food systems are built over time and depend on the trust and commitment that result from developing relationships among various stakeholders. The greatest impact that the county can have is by demonstrating strong leadership through advocating for policies that support local farmers and creating a culture that values local food and the county s agricultural identity. By implementing the recommendations of this plan, the county will be taking steps to ensure the viability of its local food economy for years to come. Any discussion of food systems must also include a discussion of sustainability and equity. In addition to the service they provide through food production, farms play a role in preserving open space and protecting natural habitats. The presence of farms in a community gives residents a direct link to the environment and the source of their food, which fosters a sense of environmental stewardship. Local food systems also contribute less carbon emissions due to shorter transportation distances and are less reliant on resource-intensive packaging and processing. Supporting local food systems is therefore an important way for Montgomery County to reduce its impact on climate change. It s also important to acknowledge that some residents have better access to local foods, whether that s due to affordability, location, or awareness. By increasing access to local foods for all, the county will help to improve residents quality of life and continue to support the local food economy. One of the keys to supporting a sustainable, equitable local food economy 76 Ellen Kahler, Kit Perkins, Scott Sawyer, Heather Pipino, and Janice St. Onge, Farm to Plate Strategic Plan: A 10-Year Strategic Plan for Vermont's Food System, Executive Summary, Vermont Sustainable Jobs Fund, July 2013, Executive%20Summary.pdf. 59

66 Cows on Brady Farm in Harleysville, PA Source: Montgomery County Planning Commission
67 Acknowledgments Members of many different organizations, agencies, and businesses contributed their valuable time to the development of Eat Local Montco. DVRPC is extremely grateful to our partners and supporters who participated in stakeholder interviews, provided recommendations and ideas, and reviewed and provided feedback on the report. This report would not have been possible without their contributions. Mikey Azzara Zone 7 Stephanie Berardi Jenkintown Farmers Market Jen Brodsky Kitchen Table Consultants Porter Bush Culinart Group Arthur Bustard Montgomery County Agricultural Land Preservation Board Kathleen Casey Ambler Food Co-op Budd Cohen Chef at Philadelphia College of Osteopathic Medicine Annie Cull Whole Foods Lydia Dan- Sardiñas Upper Merion Farmers Market Shannon Davidson Greener Partners Danielle DeLaurentis Upper Merion Farmers Market Pat Druhan CADCom and Norristown Farmers Market Meghan Filormo The Food Trust Dulcie Flaharty Natural Lands Trust Ned Foley Two Particular Acres Andrew Frankenfield Penn State Extension, Montgomery County Wendy Freed Montgomery County Farm Bureau Alan Gladish Double Eagle Malt Melinda Goodwin Hatboro Farmers Market David Green Montgomery County Community College and CulinArt Inc. Andrey Huntington Common Market 61

68 Alex Jones Fair Food Philly Stephanie Kane Weavers Way Ann Karlen Fair Food Philly Mary Landis Sunrise Sunflower Farm Anne Leavitt-Gruberger Montgomery County Planning Commission Tamela Luce North Penn Community Health Foundation Sloane Six Quarrry Hill and Mainland Inn Alex Smith Living Hope Farm Michele Spencer Pennsylvania Association of Sustainable Agriculture Stephanie Weiss The Food Trust Lastly, our special thanks are extended to Anne Leavitt-Gruberger and the rest of the Montgomery County Planning Commission for their support throughout the process. Your thoughtful suggestions and patience were greatly appreciated. David McClurg Appeeling Fruit, Inc. Mike McVeigh Greener Partners Ashlee O Dugan PA Preferred Tim Ohst Sly Fox Brewery Chinwe Onyekere Lankenau Hospital Steve Quigley Merrymead Farm 62
69 Works Cited Adams County Food Policy Council. Proclamation, May 13, About Us. (accessed July 3, 2017). Alliance for Sustainable Communities Lehigh Valley. Lehigh Valley Food Policy Council. Alliance for Sustainable Communities. (accessed July 3, 2017). Barham, James, Debra Tropp, Kathleen Enterline, Jeff Farbman, John Fisk, and Stacia Kiraly. Regional Food Hub Resource Guide. Washington, DC.: U.S. Dept. of Agriculture, Agricultural Marketing Service, April (accessed July 3, 2017). Brewers Association. "Total Economic Impact 2014." Statistics: Economic Impact. (accessed May 2017). Butzler, Tom. "Pennsylvania Growers Look at Alternatives for Expanding Business Opportunities." Penn State Extension, February 22, pennsylvanian-growers-look-at-alternatives-for-expanding-businessopportunities (accessed July 3, 2017). Buy Fresh Buy Local Greater Lehigh Valley. Buy Fresh Buy Local Greater Lehigh Valley. About Us. (accessed October 3, 2016). Buy Local Challenge. About SMADC. Southern Maryland Agricultural Development Commission. (accessed August 25, 2016). Center for Environmental Farming Systems. NC 10% Campaign. Center for Environmental Farming Systems. (accessed August 31, 2016). Center for a Livable Future. Food Policy Council Directory 2015 Update [PowerPoint slides]. Johns Hopkins University, October 22, Slides_2015_10_28.pdf (accessed July 5, 2017). Christensen, Bradley C., Martin Kenney, and Donald Patton. Regional identity can add value to agricultural products. California Agriculture 69, no. 2 (April-June 2015): DOI: /ca.v069n02p85 (accessed September 27, 2016). Citizens for Pennsylvania s Future (PennFuture). Agriculture and the Law: A Guide to Pennsylvania s Agricultural Laws and Regulations for Farmers and their Neighbors. PennFuture, November files8.webydo.com/93/ /uploadedfiles/e3a53cf7-be69-6e87-6e16-b52dde5f143e.pdf (accessed July 3, 2017). Delaware Tribe of Indians. Foods Eaten by the Lenape Indians. Official Website of the Delaware Tribe of Indians. June 27, delawaretribe.org/blog/2013/06/27/foods-eaten-by-the-lenapeindians/ (accessed September 6, 2016). Delaware Valley Regional Planning Commission. Municipal Implementation Tool #18. Philadelphia: Delaware Valley Regional Planning Commission, April
70 Double Up Food Bucks. How It Works. Fair Food Network, doubleupfoodbucks.org/how-it-works/ (accessed July 5, 2017). Envision Lancaster County. Agritourism Guidelines: For the Promotion and Regulation of Farm-Based Tourism Enterprises. Lancaster County, Pennsylvania: Lancaster County Planning Commission and Lancaster County Tourism Development Council, February lancastercountyplanning.org/documentcenter/home/view/139 (accessed July 3, 2017). Equitable Development Toolkit. Local Food Procurement. PolicyLink, March (accessed July 3, 2017). The Food Trust. "The Food Trust's Food Bucks Network: Encouraging Healthy SNAP (Food Stamp) Purchases." The Food Trust. thefoodtrust.org/what-we-do/farmers-markets/philly-food-bucks (accessed June 6, 2017). Freed, Wendy. to Anne Leavitt-Gruberger. October 5, Glynwood. The State of Agriculture in the Hudson Valley. Cold Spring, NY: Glynwood, uploads/2015/02/state-of-agriculture-2010.pdf (accessed September 29, 2016). Harper, Alethea, Annie Shattuck, Eric Holt-Gimenez, Alison Alkon, and Frances Lambrick. "Food Policy Councils: Lessons Learned." Food First: The Institute for Food and Development Policy, foodfirst.org/wp-content/uploads/2014/01/dr21-food-policy- Councils-Lessons-Learned-.pdf (accessed July 5, 2017). Healthy Adams County. "Our Mission and Vision." Healthy Adams County. (accessed June 7, 2017). Hinman, Kristen. "Sysco's Produce Division Makes Room for Local Farmers." Fast Company, October 19, com/ /syscos-produce-division-makes-room-local-farmers (accessed November 19, 2014). Hoffman, Eric. Barriers to Local Food Marketing: A Survey of National Family Farm Coalition Members. Washington, DC: National Family Farm Coalition, July LocalFoodReport.2009.pdf (accessed July 3, 2017). Kahler, Ellen, Kit Perkins, Scott Sawyer, Heather Pipino, and Janice St. Onge. Farm to Plate Strategic Plan: A 10-Year Strategic Plan for Vermont's Food System: Executive Summary. Vermont Sustainable Jobs Fund, July F2P%20Executive%20Summary.pdf (accessed July 5, 2017). Kraus, Scott. "Will Liquor Reform Help or Hurt Craft Brewers?" The Morning Call, September 30, (accessed July 5, 2017). Loethan, Lance, Scott Haag, Bill Schrechker, and Ira Goldstein. The Supply Chain Matrix: A Prospective Study of the Spatial and Economic Connections within the Region s Meat Industry. Philadelphia, PA: The Reinvestment Fund, July (accessed July 2016). Low, Sarah A., Aaron Adalja, Elizabeth Beaulieu, Nigel Key, Steve Martinez, Alex Melton, Agnes Perez, Katherine Ralston, Hayden Stewart, Shellye Suttles, Stephen Vogel, and Becca B.R. Jablonski. Trends in U.S. Local and Regional Food Systems, AP-068. U.S. Department of Agriculture, Economic Research Service: January gov/webdocs/publications/42805/51173_ap068.pdf?v=42083 (accessed July 3, 2017). 64
71 Maine Brewers Guild. "Beer Trail." Maine Brewers Guild. mainebrewersguild.org/maine-beer-trail/ (accessed July 5, 2017). Maryland Hospitals for a Healthy Environment. Local Foods to Local Hospitals Final Report: January 1, 2009 August 31, University of Maryland School of Nursing, sites/default/files/media/md% pdf (accessed May ). Montco Happening, "Another Farm Permanently Preserved in Montgomery County," June (accessed August 28, 2017). Montgomery County Purchasing Department. Procurement Policy of Montgomery County. Montgomery County, Pennsylvania. montcopa.org/documentcenter/view/2382 (accessed August 30, 2016). Montgomery County Planning Commission. Montco 2040: A Shared Vision, The Comprehensive Plan for Montgomery County. Montgomery County, PA: Montgomery County, DocumentCenter/View/7719 (accessed September 26, 2016). National Restaurant Association. Demand for Local Food on the Rise." National Restaurant Association, March 1, restaurant.org/news-research/news/demand-for-local-foods-is-onthe-rise (accessed July 3, 2017). New Haven Food Policy Council. New Haven Food Action Plan. New Haven, CT: New Haven Food Policy Council, com/government/pdfs/nhfap_draft%20for%20 .pdf (accessed July 3, 2017). Pennsylvania Agricultural History Project. Agricultural Resources of Pennsylvania, c : Southeastern Pennsylvania Historic Agricultural Region, c Pennsylvania Historical and Museum Commission. communities/agriculture/files/context/southeastern_pennsylvania.pdf (accessed August 28, 2016). Pennsylvania Department of Agriculture. Bureau of Farmland Preservation 2016 Annual Report. Pennsylvania Department of Agriculture, May Documents/Final%20Copy%20Farmland%20Preservation% %20Annual%20Report.pdf (accessed July 10, 2017). Pennsylvania Department of Community and Economic Development. Pennsylvania Municipalities Planning Code: Act of 1968, P.L. 805, No. 247, as reenacted and amended (Eighteenth Edition). Harrisburg: Governor s Center for Local Government Services, February (accessed July 3, 2017). Pennsylvania Native Plant Society. "Why Native Plants?" (Pennsylvania Native Plant Society). (accessed June 7, 2017). Penn State Extension. "Native and Invasive Plants.".Penn State College of Agricultural Sciences. (accessed June 7, 2017). Ryan, Susan D., and Sean A. Hayes. Your Agritourism Business in Pennsylvania: A Resource Handbook. Harrisburg, PA: The Center for Rural Pennsylvania, July Agritourism_handbook.pdf (accessed July 5, 2017). NC 10% Campaign. About the Campaign. North Carolina State University. (accessed July 3, 2017). 65
72 Sonntag, Viki. Why Local Linkages Matter: Findings from the Local Food Economy Study. Sustainable Seattle, goodfoodworld.com/wp-content/uploads/2013/01/why-local- Linkages-Matter.pdf (accessed July 3, 2017). Southern Maryland Agricultural Development Commission. About SMADC: History. Tri-County Council for Southern Maryland. com/aboutsmadc/history.html (accessed August 25, 2016). Southern Maryland Agricultural Development Commission. End of Year Report: FY 15. Tri-County Council for Southern Maryland, August (accessed August 25, 2016). Southern Maryland Agricultural Development Commission. Market Analysis and Strategic Plan: Tri-County Council for Southern Maryland. (accessed August 25, 2016). Sustainable Jersey. Action Description: Buy Local Campaign. (Sustainability Institute at the College of New Jersey). actions-certification/actions/?type= &tx_ sjcert_action%5bactionobject%5d=44&tx_sjcert_ action%5baction%5d=getpdf&tx_sjcert_action%5bcontroller%5d= Action&cHash=86ae2d89ffec7c c8f7206a849 (accessed October 4, 2016). United States Census Bureau American Community Survey 5-Year Estimates. community_facts.xhtml (accessed July 2016). United States Department of Agriculture Census Volume 1, Chapter 2: County Level Data, Pennsylvania. USDA Census of Agriculture. Volume_1,_Chapter_2_County_Level/Pennsylvania/ (accessed August 2016). United States Department of Agriculture. Quick Stats. National Agricultural Statistics Service. results/8a7d06bf-dda5-3dff-9c ced51da6?pivot=short_ desc (accessed November 2017). United Way of the Greater Lehigh Valley. Food Access. United Way. (accessed July 3, 2017). United Way of the Greater Lehigh Valley. Lehigh Valley Food Policy Council. food-council-policy (accessed July 3, 2017). Ursinus College. "Environmental Studies: Facilities and Resources," (accessed August 28, 2017). Wholesome Wave. "Our Mission." Wholesome Wave. wholesomewave.org/ (accessed June 16, 2017). Wholesome Wave. Wholesome Wave: 2015 Annual Report. Wholesome Wave. Wholesome%20Wave%20AR_Print.pdf (accessed June 16, 2017). 66
73 Appendix Stakeholder Analysis Introduction DVRPC conducted interviews for Montgomery County s Local Food Promotion Report in the winter and spring of 2015 and The interviews provided a comprehensive view of the agricultural landscape in Montgomery County. The following analysis details the interviewees and summarizes the key findings. Purpose A Stakeholder Analysis is a social research method that illuminates who is doing what, and where, and how stakeholders interact with each other. Through in-person and phone interviews with producers, consumers, and intermediaries, DVRPC gathered insight into Montgomery County s challenges and opportunities for promoting local food, as well as information on existing efforts and innovative models. Respondents also identified other key actors that should be included in this analysis. Development of Questions Questions were developed based on interview instruments created for DVRPC s Greater Philadelphia Food System Study (2010). Methodology The over-arching goal of the Stakeholder Analysis is to include many different stakeholders who represent a variety of experiences and perspectives in relation to local food in Montgomery County. Such stakeholders include: farmers, food system partners (typically nonprofit organizations that champion local food in the community), institutions, distributors, funders, manufacturers, chefs, farmers' market managers, and interested citizens. The Stakeholder Analysis began by identifying and interviewing a few recommended individuals. These stakeholders were then asked for their suggestions of others to interview, and so on. Anne Leavitt- Gruberger of the Montgomery County Planning Commission (MCPC) and Andrew Frankenfield of Penn State Extension, were instrumental in their recommendations. Additionally, a separate, shorter survey was distributed online via the MCPC website, DVRPC s website, social media, and through the interviewees networks. This survey aimed to capture the consumer demand for and perspective on local food from interested citizens in Montgomery County. Key Stakeholder Interviews In total, 29 individuals from 29 organizations were interviewed in-person or on the phone. The majority of interviewees reside in Montgomery County, with a few from neighboring counties. Figure 1: Interview Respondents by Stakeholder Group Stakeholder Groups Number of Interviews Food System Partners 9 Farmers' Market Managers 5 Farmers 4 Distributors 3 Retail 3 Manufacturers 2 Institutions 1 Funders 1 Chefs 1 Total Interviews 29 Interested Citizens Online Survey


74 Food Systems Partners constituted the largest percentage of interviews, and included nonprofit organizations that focus on supporting new and beginning farmers, improving health outcomes in the region, and promoting local food. The Farmers' Market Managers were interviewed as part of outreach to all of the farmers market managers in the county. Five market managers and two additional farm stand/co-op employees attended the event. Advantages and Opportunities Interviewees were asked: What are the biggest opportunities/advantages for promoting local food and farms in Montgomery County? See Figure 2: Advantages and Opportunities for additional information. Figure 2: Advantages and Opportunities Number of Responses Great Need/Demand Connect Producers to Consumers Promotion of Local Food Consumer Education Location (for food) Farmers' Markets Boutique Grains/Mills Senior Population The majority of interviewees discussed the demand for local food and the need for more local food access in their communities. Kathleen Casey of Ambler Food Co-op mentioned that the demand was high for a new co-op in Ambler, as assessed through feasibility studies. Connecting producers to consumers was also emphasized as an important opportunity for improving the promotion of local food in Montgomery County. Several of the chefs and farmers also highlighted the importance of educating the consumer about local food and its benefits. Challenges Interviewees were asked: What are the biggest challenges that Montgomery County faces in terms of supporting/promoting local food and farms, including your business? (E.g. Availability, cost, consistency, safety, preparation, etc.) See Figure 3: Challenges for additional information. Figure 3: Challenges Number of Responses Bureaucracy Scaling Farmers Cost (of land and local food) Competition Lack of Identity Seasonality Tracking Success Urban Growth The majority of interviewees mentioned bureaucracy, scale, and cost as some of the major challenges that local food faces in Montgomery County. Regarding bureaucracy, a number of farmers specifically mentioned the amount of burdensome regulations that they are subject to, noting that the regulations are especially hard for small farmers to comply with. In a somewhat extreme example, one farmer noted that 26 different 68
75 government officials visited their farm in the span of one year. Other farmers mentioned the burdensome regulations around farm stands, highway signs, and hayrides all seemingly minor issues that can make a big difference to small farms. Producers and buyers both mentioned that scale (and the infrastructure and land needed to scale up) was a challenge for growing local food in Montgomery County. Many of the people interviewed who purchased local food noted that not all producers were at a point where they were ready to participate in their market. Some farmers noted that cost of land and labor in Montgomery County can be barriers to scaling up their operations. Others cited the lack of slaughterhouses as a barrier to growing their operation. Figure 4: Recommendations Number of Responses Marketing Convening Local Food Stakeholders Infrastructure Tap into Existing Efforts Local Food Guide Farmland Preservation Agri-entertainment Kitchen Incubator Recommendations How could Montgomery County (government) better support farms and food businesses? As shown in Figure 4: Recommendations, the top two responses for ways that the county could better support farms and food businesses were Marketing and Convening Local Food Stakeholders. Under the broad topic of marketing, stakeholders suggested that the county could do more to promote local farms and celebrate places that purchase local food. They also suggested that the county implement incentive and recognition programs. Incentive programs could reduce the price point of local foods for people in need, while recognition programs are an easy and low-cost way to celebrate local food champions. Interested Citizens Online Survey As noted above, the survey was distributed online via the MCPC website, DVRPC s website, social media, and through the interviewees networks. DVRPC received 122 online responses. The following are key findings: When asked to define "locally-grown," 36 percent of respondents selected a 100 mile radius. This was followed closely by Montgomery County (31 percent), and more distantly by Pennsylvania (19 percent). Although most consumers do not consider political boundaries when shopping for food, the fact that almost a third of respondents selected Montgomery County as their definition of local indicates that they equate the county with their local food system. 96 percent of survey respondents indicated that they purchase local food. A majority of respondents shop for local food at farmers' markets (66 percent) followed by grocery stores (59 percent), farm stands (44 percent), growing their own food (38 percent), food co-ops (19 percent), and CSAs (18 percent). See Figure 5: Where Do You Buy Local Food Products? When shopping for food, respondents prioritized freshness, cost, and the location of the store/market as the top three factors to consider. These considerations were followed closely by whether or not a store contains locally-grown/produced food. This demonstrates that even within the selfselecting group of survey respondents, freshness, cost, and convenience 69


76 trump the origin of the food, suggesting that local farmers need to be cost competitive and able to supply their products to convenient locations. See Figure 6: What Are The Top 3 Factors That You Consider When Shopping For Food? Figure 5: Where Do You Buy Local Food Products? Number of Responses n= Farmers' Market Grocery Store Farm Stands I grow my own food Food Co-op CSA Other Figure 6: What Are The Top 3 Factors That You Consider When Shopping For Food? Number of Responses n= The freshness The cost The location of store/market That the food is locally grown/produced That the food is organically grown The sustainability of the food s production, packaging, and transport Although cost was one of the top three factors that people considered when purchasing food, respondents also noted that they would be willing to spend more on locally-grown or -produced food. Figure 7 illustrates that 36 percent of respondents would be willing to spend 50 percent more and 28 percent of respondents would be willing to spend 10 percent more on an apple grown in Montgomery County. Other The brand Survey respondents were conflicted about whether or not there is a strong agricultural industry in Montgomery County, with 54 percent responding yes and 46 percent responding no. Overwhelmingly, respondents felt that some county residents struggle with food insecurity, with 91 percent of respondents answering "yes" to the prompt: "Some residents in the county struggle with food insecurity and/or access to affordable, nutritious food." 70

.")
.")
77 Figure 7: How Much Would You Be Willing To Spend To Buy An Apple Grown In Montgomery County If A Non-Local Apple Costs $1 At Your Regular Grocery Store? $2.00 $1.50 $1.10 $1.00 $0.90 $ Number of Responses n=120 Thirty-three municipalities were represented through the survey responses, with the majority hailing from Ambler Borough (19 responses). The majority of the respondents had an advanced degree; however annual household income levels were distributed fairly evenly (see Figure 8: Annual Household Income). Figure 8: Annual Household Income Less than $25,000 $25,000 to $50,000 $50,000 to $75,000 $75,000 to $100,000 $100,000 to $150,000 $150,000 to $250,000 $250,000 or More n=

78 Preserved Farm in New Hanover, PA Source: Montgomery County Planning Commission