Snap Plus and P Index Update. Larry Bundy, Sue Porter, and Laura Ward Good Dept. of Soil Science, UW-Madison & WDATCP
|
|
|
- Mervyn Webster
- 5 years ago
- Views:
Transcription


1 Snap Plus and P Index Update Larry Bundy, Sue Porter, and Laura Ward Good Dept. of Soil Science, UW-Madison & WDATCP
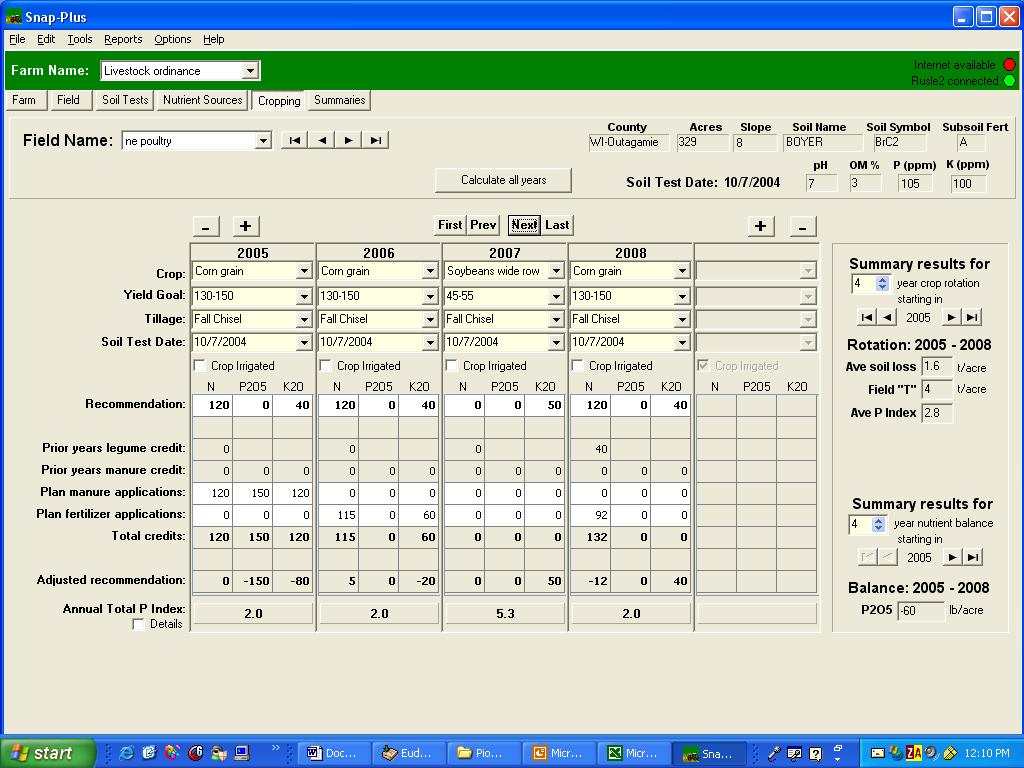
2 SNAP-Plus Nutrient management planning software program Phosphorus Index Nutrient management planning tool that assesses the risk of phosphorus delivery to surface water from agricultural fields
3 SNAP-Plus software uses routine information: Soil test Crop and tillage Slope and slope length
4 SNAP-Plus Provides field-by-field: Multi-year nutrient management plan Rotational soil loss assessment P Index calculation P balance calculation Record-keeping
5 Nutrient Management Standard 590: All fields that receive crop nutrients must be farmed to T (according to farm conservation plan). SNAP-Plus currently provides a RUSLE2 rotational soil loss assessment (may be 10-20% higher than if done with full RUSLE2).
6 Nutrient Management Standard 590: Available nitrogen applications can not exceed crop N requirements or N removal for legumes SNAP-Plus calculates N recommendations and N credits
7 Nitrogen Uptake for First Year Legumes and Companion Crops Crop Yields N Uptake per acre lb/acre Legume hay 2-3 T 220 Legume hay with oatlage 1 st cut: 1-2 T 2 nd cut: 1-2 T 240 Soybean 50 bu 180
8 Nutrient Management Standard 590: Phosphorus applications must be planned using soil test P thresholds or the P Index. Soil test P thresholds > 50 ppm limit P applications to crop removal > 100 ppm eliminate P applications if possible; cumulative P applications must be 25% less than crop removal (over 4 years) P Index Must be less than 6 averaged across the rotation. SNAP-Plus calculates both the P balance and P Index for each field.
9 SNAP-Plus Test Version Test version for 590 Standard is available on web:
10
11 Chippewa (Arland) Outagamie (Boyer) Adams (Plainfield) Lafayette (Edmund) Jefferson (Casco) Counties and Soils Selected for Snap-plus Planning Exercise
12 Assumptions of planning exercise using proposed standard: Soil test P = 105 ppm Slope is 8%, slope length is 150 feet Medium yield potential soils (except for Plainfield)
13 For planning exercise: All operations must: Meet T Avoid over-applying N Maintain P Index less than 6 across rotation Apply 25% less P 2 O 5 than crop removal
14 Cash Grain Operations No Change! Commercial fertilizers still applied according to UW recommended rates.
15 CCAAA rotation Dairy Operations With N credit for fair stand of alfalfa, no N needed for first year corn except for irrigated sands (NC farm). Liquid dairy manure applied to second year corn and seeding year alfalfa to maximum allowable N rate Manure = /1000 gal. Nitrogen limits manure applications
16 Dairy operations Rotational Soil T Soil loss T/a/year Crop P 2 O 5 uptake P 2 O 5 balance lb/acre/yr P Index NW Boyer NC Plainfield NE Arland SE Casco SW Edmund
17 Poultry Operations CCCS Rotation Nitrogen needed for all corn years N requirement for one year of corn adds about 75% of the crop P 2 O 5 removal for the 4-year rotation Manure = /ton
18 Poultry operations Soil T Soil loss T/a/year Rotational Crop P 2 O 5 uptake P 2 O 5 balance lb/acre/yr P Index NW Boyer NC Plainfield NE Arland SE Casco SW Edmund
19 Poultry operations Can use P Index strategy if need to apply more manure At 105 ppm soil test P, all PI values less than 6. But this is only temporary solution, because if continue to raise soil test P, P Index value will go above 6. At 300 ppm soil test P, only sites with very low erosion (NC, Plainfield and NE, Boyer) are less than 6.
20 Summary P index buys time to achieve P balance For dairy with CCAAA rotation, N determines manure rates High P in poultry manure requires large acreage or off-farm distribution
21 PI values vs. measured total P runoff losses from several sub-watersheds, Pioneer Farm, UW-Platteville PI vs P load STP vs P load Actual P load Actual P load (lb/acre) y = 0.322x y = x R 2 = R 2 = STP Phosphorus Index *** Provisional data and Site removed
22 More Research Base for P Index Year-round runoff monitoring in field-scale watersheds with different soils and management (23 sites) 2005: Simulated rainfall runoff experiments in North Central Wisconsin (Marshfield).
23 Research Base for P Index Analysis of soils from throughout Wisconsin for relationships between soil test P, water-soluble P, soil total P, soil properties, and soil P stratification (106 profiles). Simulated rainfall runoff trials with different managements and soils (335 plot events). Small plot replicated long-term natural runoff collectors with different managements and soils (72 plots)


24 Snap Plus and the P Index Update and Impact