4R Nutrient Stewardship
|
|
|
- Sabina Jordan
- 5 years ago
- Views:
Transcription

1 4R Nutrient Stewardship Major Crops of Southeast Asia Good Reasons to Engage IPNI Southeast Asia Program for:
2 4R Nutrient Stewardship Major Crops of Southeast Asia Good Reasons to Engage 1. 4 Rights Nutrient Stewardship Concept 2. Opportunity in Major Crops 3. Examples of IPNI SEAP R&D

3 4R Concept
4 4R Concept Right RATE Assess soil nutrient supply and plant demand for nutrients for a specific yield target
5 4R Concept Right TIME Assess timing of crop uptake, soil nutrient supply, loss risks and field operation logistics

6 4R Concept Right PLACE Place nutrients where they are accessible to crop
7 4R Concept Right SOURCE Ensure balanced supply of plantavailable nutrients, utilizing all available sources (organic, inorganic)


8 4R Concept Beyond N-P-K Societal norms and expectations, measured by performance indicators, and determined by a range of stakeholder
9 Opportunity in Major Crops Selection Criteria Production area Extractive (and not fertilized) Market demand Responsive crop Yield gap
10 Opportunity in Major Crops Production Area (FAO, 2010, ha) Rice (37,894,000) Maize (8,929,000) Oil palm (10,483,000) Sugar cane (2,052,000) Cassava (3,070,000) Cocoa (1,673,000)
 Cocoa* #- (15,000) * IPNI SEAP estimates # Highly nutrient extractive crops + Highly yielding crops - Currently non")
11 Opportunity in Major Crops N-P-K Fertilizer Use (IFA, 2010, t) Rice # (3,716,000) Maize # (1,023,000) Oil palm + (2,618,000) Sugar cane + (459,000) Cassava* #+- (150,000) Cocoa* #- (15,000) * IPNI SEAP estimates # Highly nutrient extractive crops + Highly yielding crops - Currently non intensive
12 Opportunity in Major Crops Yield Gap t/ha Nutrient Gap kg/ha Market t accumulated for five selected countries Y Act - Y Att N P K N P K Rice ,102, ,797 2,289,581 Maize ,074 98, ,038 Oil Palm ,500 74, ,100 Sugar Cane ,735 21, ,710 Cassava ,939 42, ,311 Cocoa ,401 37, ,811
13 Opportunity in Major Crops Product Present Product New Technology New Market Present Market Penetration Product Development Technological Product Substitution Market New.... Market Development Diversification High Technology
14 Opportunity in Major Crops Product Present Product New Technology New Market Present Market Penetration Rice R T, R P Sugar R T, R P Oil R T, R P Maize R T, R P Product Development Rice R R Sugar R R Oil R R Maize R R, R S Technological Product Substitution Rice R S Sugar R S Oil R S Market New Cocoa R T, R P Cassava R T, R P Cocoa R R, R S Cassava R R, R S Market Development Diversification High Technology
15 Opportunity in Major Crops Advantage Small Advantage Large Fragmented Specialization Approaches Many Approaches Few Stalemate Volume
16 Opportunity in Major Crops Advantage Small Advantage Large Fragmented Specialization Approaches Many Approaches Few Cocoa Cassava Oil Palm Rice Sugar Maize Stalemate Volume
17 Opportunity in Major Crops Advantage Small Advantage Large Fragmented Specialization Approaches Many Approaches Few Cocoa Cassava Oil Palm Rice Sugar Maize Stalemate Volume
18 Illustrative IPNI R&D Examples Systems Information clarifies and quantifies the opportunity for fertilizer use and marketing. It is produced by analyzing the performance of crops and fertilizers within a geographic region / domain and season(s). 4R Interventions support decisions about fertilizer use in the commercial agronomic process. The are produced by testing the performance of fertilizers in production systems.

19 Systems Information Maize
20 Maize: Right Rate Parameter Unit FFP 4R 4R FFP Grain yield t/ha Fertilizer N kg/ha Fertilizer P 2 O 5 kg/ha Fertilizer K 2 O kg/ha Fertilizer cost USD/ha Return USD/ha
21 Systems Information Oil Palm Lack of Clear Fertilizer Response in Oil Palm Plantations leads to Fertilizer Complacency in Plantations
22 Systems Information Oil Palm Fresh Fruit Bunch Yield in t per ha Fruit is grown but not harvested Only with enough labor, all fruit is harvested Reasonable yield level Harvest Man Days
23 Systems Information Oil Palm Oil Palm Systems Information
24 Systems Information Oil Palm There is Fertilizer Response in Oil Palm Plantations but it is Compounded by other Factors, including Labor Allocation and Climate


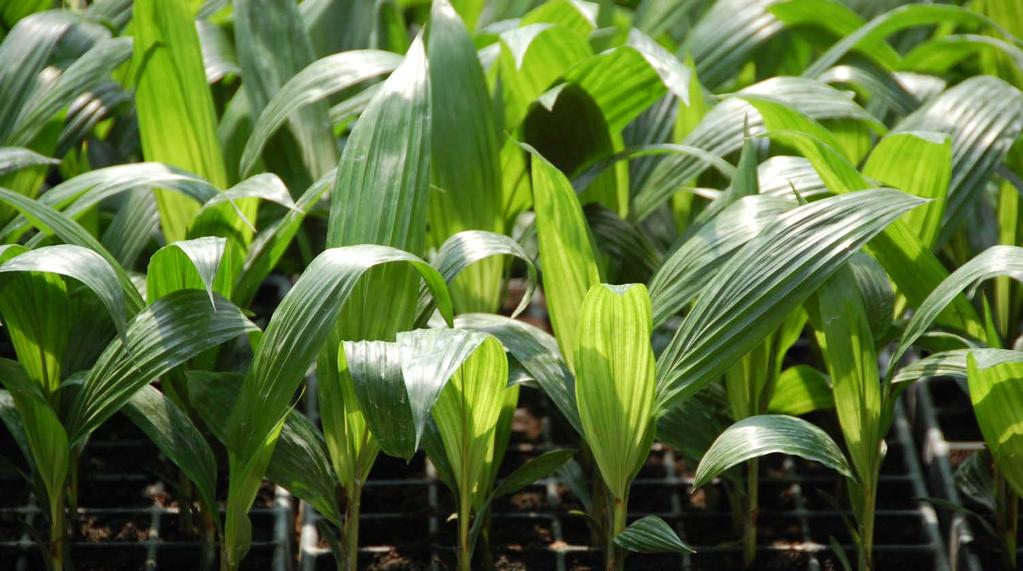
25 Oil Palm Nursery: Right Source
26 Oil Palm Nursery: Right Source Leaves per Plant MN1-2 Main Nursery (MN) Fertilizer Quality in BMP MN4w MN8w MN12w MN16w BMP REF
27 Oil Palm Nursery: Right Source Leaves per Plant MN3 Main Nursery (MN) Fertilizer Quality in BMP MN4w MN8w MN12w MN16w BMP REF

28 Oil Palm: Right Source, Time Mature Palms On-site blending of Straights 4 Application rounds per year (SEP: 6 to 8 for straights)
29 Oil Palm: Right Source, Time N P K 4R Fertilizer Nutrient Supply (kg/ha) Nutrient Removal (kg/ha) Fertilizer Recovery Efficiency (%) SEP Fertilizer Nutrient Supply (kg/ha) Nutrient Removal (kg/ha) Fertilizer Recovery Efficiency (%)

30 Oil Palm: Right Source, Place
31
32

33 Cacao: Right Rate, Source IPNI COCOA CARE PROJECT Sustainable Intensification
34 Yield Average weight of dry beans (g) per tree at bi-weekly harvest intervals GAP +Fertilizer GAP -Fertilizer Jun-13 Jul-13 Aug-13 Sep-13 Oct-13 Nov-13 Dec-13 Jan-14 Feb-14 Mar-14 Apr-14
35 Thank you Contact:
36 R&D Examples Oil Palm Systems Information

37 Rate, Source, Place Cacao

38 R&D Examples Oil Palm Systems Information

39 R&D Examples Maize Management Information Right T S R
40 Systems Information Oil Palm
41 Systems Information Oil Palm Oil Palm Systems Information Oil Palm Systems Information
42 Systems Information Maize Price Production System Profit Probability from 4R Maize Fertilizer Irrigated Rain-fed favorable Rain-fed marginal <$0 >$200 <$0 >$200 <$0 >$200 Low Low Average High Average Low Average High High Low Average High

43 Oil Palm: Right Source, Place