Feeding the Calf from Weaning to First Lactation
|
|
|
- Gwen Wiggins
- 5 years ago
- Views:
Transcription


1 Feeding the Calf from Weaning to First Lactation James K. Drackley Professor of Animal Sciences University of Illinois at Urbana-Champaign, USA
2 Importance of Heifer Enterprise on Dairy Farms Need quality replacements for cows leaving herd How many? ~85% of cow numbers But affected by pregnancy rates, cow longevity, facility constraints, feed availability, lending relationships, working capital Second largest cost center on farm (behind feed costs for lactating herd) 15-20% of total costs 600-cow dairy with full heifer enterprise = ~$0.75 million annually
3 Heifer Rearing Costs 8% 10% 12% 4% 24 Months $2,260 54% 12% Feed Costs Livestock Costs Ownership Costs Labor Costs Facilities and Equipment Initial Calf Value (Slide courtesy of P. A. LaPierre) (Tranel, 2014)

4 Heifer Raising is a Huge Investment Iowa State University (Tranel, 2014) projected the cost to raise heifers in 2014: $2.37 heifer/day $2.73 heifer/day including labor expenses Total $2,260 to freshening at 24 months of age Pre-weaned heifers cost $5- $6 per day ~ Double the average cost for post-weaned heifers ($2.47/day) (Slide courtesy of P. A. LaPierre)

5 Daily costs for Wisconsin farms,
6 Phases of heifer enterprise Day 1 (calving and colostrum) Day 2 through weaning (milk feeding period) Weaning transition Pre-pubertal growth Breeding group Pregnant heifers to calving
7 Management embedded in all phases Animal s biology Nutrition Health Labor efficiency Housing and facilities Reproduction and subsequent milk production
8 Heifer growth is modeled as a linear increase in body weight, birth to calving Body weight (kg) kg at birth 575 kg at calving 533 kg gained in 22 mo (660 d) = 0.8 kg/d = 1.8 lb/d Months of life From Hoffman, 1996

9 What is the most cost efficient and biologically efficient time to attain growth of heifers?
 Kertz et al, 1998")
10 Percentage BW increase (open bar) relative to previous 2-mo period and feed costs per kilogram of BW gain per 2-mo phase (closed bar) Kertz et al, 1998
11 Percentage increase in Withers Height (open bar) relative to previous 2-mo period and ratio of BW to WH (closed bar) for Holsteins from birth to 24 mo Kertz et al, 1998
12 Feed costs per increase in Withers Height for Holsteins from birth to 24 mo Kertz et al, 1998
13 Conclusions from Kertz et al. Feed costs per unit of BW and WH gain are lowest in the first 6 months of life. Conversion of nutrients into BW and WH gain is most efficient in the first 6 mo of life. Maintenance costs are higher and growth efficiency lower at heavier weights. Early growth is most efficient

14 Management of calves from birth to weaning offers huge potential for improving efficiency of producing replacement heifers! Maternity care, colostrum, milk and starter feeding, hygiene


15 Heifer Rearing Costs by Category 8% 10% $70/head for Vet & Medicine Fees 12% 4% 24 Months $2,260 54% Feed is over half of total costs 12% Feed Costs Livestock Costs Ownership Costs Labor Costs Facilities and Equipment Initial Calf Value (Slide courtesy of P. A. LaPierre) Tranel, 2014
16 How should we evaluate feed costs? Cost per day for feeding calves/heifers? Cost per kilogram of BW gain? Cost per day of life until enters the milking herd? Cost or investment?


17 Feed is the major cost of heifer raising: How do we optimize the system?
18 Weaning: The other transition period Period preparing for and adapting to weaning Critical stage of heifer s life representing many stressors

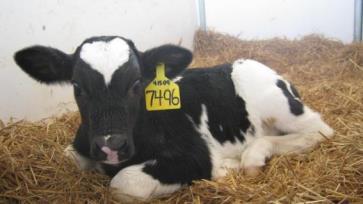
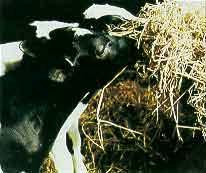
19 Diets Changes around weaning Removal of milk, total reliance on dry feed and free water, change from starter to grower Environment Moving to different pen Social Grouping with other calves Removal of surrogate mom and suckling/milk feeding Photos courtesy of Jim Quigley

20 Weaning distress compromises welfare Growth slumps Attributable to lower nutrient intake and stress Adverse behavioral stress Vocalization, decreased resting Increased disease susceptibility Particularly respiratory and coccidiosis Impaired immunity due to suboptimal nutrition and weaning stressors Photos courtesy of Jim Quigley

21 Meeting the nutrient requirements of calves around weaning
 do")

22 What are the calf s requirements at weaning? Tissue requirements for energy and protein (amino acids) do not change from preweaning to postweaning, if we want same growth rate! Problem is we must supply them from dry feed rather than milk
23 Starter dry matter intake (DMI) required to support various rates of gain in weaned calves BW (kg) ADG (g/d) Starter required (kg/d) Based on starter containing 3.1 Mcal ME/kg DM (NRC 2001) NRC, 2001

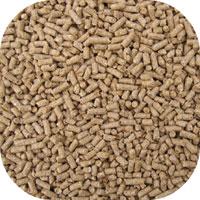
24 Adequate starter intake is key to avoid nutritional stress at weaning Composition and form of starter Optimize forage intake Water management Don t wean too early Wean gradually

25 Water: the most important, and most neglected, nutrient


26 Water and starter intake patterns are almost identical! week wean Early - starter 12 g/d Late - starter Early - water Late - water 6 week wean L/d Courtesy M. Steele, University of Alberta Age (Days) Eckert et al., 2015
27 Forage management during the weaning transition
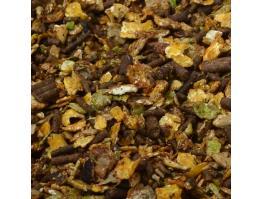
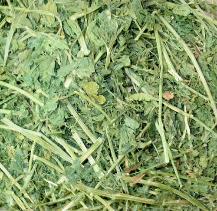
28 Summary of arguments for forages Calves crave forage fiber. Satisfies behavioral needs, prevents stereotypic behaviors (tongue rolling, mouthing objects, etc). Small amounts of hay increase starter intake and feed efficiency. Hay particles keep rumen papillae healthier and prevent abnormal growth. Therefore, feed small amounts of hay with concentrates before weaning
29 Forage to concentrate ratio selected by calves given free choice of both Forage F:C ADG (kg) None c Alfalfa hay 14: bc Oat hay 8: a Barley straw 5: a Rye-grass hay 4: ab Corn silage 5: ab Conducted in Spain. Hay or straw chopped. Gain:feed was not different among diets. From Castells et al., 2012

30 Calves will choose high-quality alfalfa hay over starter concentrates Photo by J. K. Drackley
31 Forage to concentrate ratio selected by calves given free choice of both Forage F:C ADG (kg) None c For Alfalfa 1.5-kg hay total DM intake, 14:86forage intake 0.76 bc would Oat hay be only 75 g/d for 8:92 barley straw0.93 vs. a 210 g/d for alfalfa hay. Barley straw 5: a Rye-grass hay 4: ab Corn silage 5: ab Conducted in Spain. Hay or straw chopped. Gain:feed was not different among diets. From Castells et al., 2012
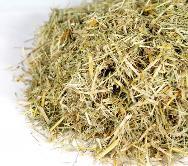
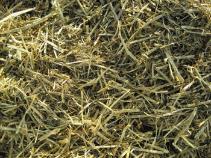
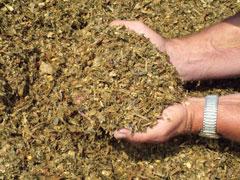
32 Summary of forage recommendations Do not feed free choice alfalfa (lucerne) hay decreases starter intake, very palatable but low digestibility (high lignin) Small amounts of chopped grass hays or straw (<200 g/d or 5% of total TMR ) may increase starter consumption and feed efficiency. Control amount of hay offered through at least 6 months so that calves consume all programmed concentrates
33 Grouping post-weaning First group should be small (4 to 6 calves) Allows social adaptation By 4 mo can be housed in larger groups
 to predict Energy must be limited (maize silage) or increased (grass")
34 Post-weaning nutritional considerations Metabolizable protein must be adequate Use one of the models (NRC, CPM, etc) to predict Energy must be limited (maize silage) or increased (grass hay)
35 Ration principles Weaned heifers 3-4 months to breeding: intake capacity limited, need concentrates plus forage Grass silage or corn silage, grain, minimum of 0.5 kg dry hay Lactation TMR can work with additional starter or grower concentrate early
36 Feeding Heifers General Practices ALL heifers should be force-fed a balanced mineral and vitamin pack with grain or forage ALL heifers need water Cold and mud increase feed required or decrease growth)
37 Dietary guidelines for large-breed dairy heifers gaining 0.82 kg/d Body weight, kg Variable Dry matter intake, kg/d Crude protein, % RUP, % of CP RDP, % of CP ME, Mcal/kg From NRC, 2001
38 Grouping Strategies for Heifers Group Age (mo) Strategy for the group Ration 1, smaller groups for less competition (2-mo age spread) Ration 2, smaller groups for less competition (3-mo age spread) Ration 3, AI breeding group Ration 3, pregnant 7 > 21 Dry cow ration
39 Example Ration Guidelines for Heifer Growth Ration 1 Ration 2 Ration 3 (3-6 mo) (6-12 mo) (>12 mo) DMI, kg CP, % of DM RUP, % of CP ME, MJ/kg
40 Feeding Strategies Limit silage and pasture for youngest group Groups 1 and 2 need supplemental grain (1-3 kg) and a protein supplement (0.25 to 0.5 kg); lactation TMR may work well Groups 3 and 4 may need supplemental grain (0.5-2 kg) depending on forage quality Groups 5 and 6 may need little grain (but must monitor total diet composition)
41 Potential areas for optimizing feed costs Develop a ration based on nutrient needs. Avoid overfeeding minerals, vitamins and protein. Utilize efficient bunk feeding techniques. Control forage costs. Analyze forages being fed. For some operations, intensive rotational grazing may reduce feed costs. Feed high-quality and palatable concentrates to younger heifers. Monitor size, age and weight variation. Keep weight gains steady. Adjust rations to changing environments without overconditioning.

42 What is the optimum age at first calving (AFC)? From Quigley 2014 (Calf Note 180; calfnotes.com)
43 Effect of age at first calving on lifetime milk production based on number of times milked daily and herd rolling herd average From Quigley 2014 (Calf Note 180; calfnotes.com)
44 250 Relationship between ADG and protein deposition in growing Holsteins Protein deposition, g/d ADG=0.8 kg/d ADG=1.0 kg/d Body weight, kg NRC, 1996
45 Target Growth Rate Concept: Integrating Management and Biology Determined by: Mature body weight (MBW) (when dairy cattle reach the third lactation) Concept of physiologic maturity: puberty occurs at a given percentage of mature size (45% to 50%) Pregnancy should occur by 55% MBW Herd goals for age at first calving
46 Selection for milk yield has increased size of US Holstein heifers Body weight, kg Control heifers Select heifers Age, days Milk yield difference between groups ~3,639 kg (1990) Murphy Ph.D. Dissertation, Univ. Minnesota, JDS 74:262 (1992)
47 Selection for milk yield has increased size of US Holstein heifers Withers height, cm Control heifers Select heifers Age, days Murphy et al., JDS 74:262 (1992)
48 Target weight system for heifer growth Stage % of mature wt. Mature weight, kg Target weight, kg pregnancy 55% st calf 85% nd calf 92% rd calf 96% Input AFC sets breeding age for you; breeding weight is a function of the mature size. Requirements are then calculated to meet the targets. NRC, 2001
49 Full versus Target Feeding for Target ADG Example: 225 kg Holstein heifers target growth 0.9 kg/d Diet: Alfalfa silage: 45 % NDF, 21% CP Corn silage: 40 % NDF, 50% grain Roasted soya meal High moisture maize, ground Vitamins and minerals Can consume >6.6 kg DM/d, but due to forage quality only require ~ 5.7 kg DM to achieve target growth. If they consume >5.7 kg, what happens?
50 Why is body composition more important than weight or age alone? Are two 550-kg heifers always the same? Example, postpartum BW for two heifers: Heifer A: 550 kg, BCS 3.0 Heifer B: 550 kg, BCS 4.0 The difference in one body condition point is approximately 45 to 68 kg body weight. The LEAN body weight of Heifer B is much lower than Heifer A, and so B has lower maintenance and lower predicted intake.
51 Effect of Mature Body Weight on Nutrient Requirements for Growth Similar composition similar % of mature size 750 kg mature weight 600 kg mature weight Same weight different % of mature size Composition of Animal
52 What is the optimal ADG? Concern about too rapid growth decreasing future milk yield? Increased growth rate increases fat in mammary pad and decreases DNA (epithelial cell number) More recent data suggest this doesn t have to be a concern
53 Reduced AFC & Milk Yield Prepubertal ADG AFC First Lactation Milk Yield, lbs Study A B A B A B % Change Lin et al ,797 9, ~ 3 mo. decrease in AFC Gardner et al. NR 1 NR ,367 14, Hoffman et al. NR NR ,240 16, and ~ 5% reduction in milk Hoffman et al. NR NR ,789 17, Bar-Peled ,176 x 21,173 y Van Amburgh et al ,721 a 20,651 b Radcliff et al ,962 a 16,507 b Vicini et al ,745 a 14,969 b Ettema and Santos ,665 a 22,779 b Average Not reported.
54 Prepubertal ADG and mammary development Data from Cornell (Meyer and Van Amburgh, 2006) dispute this: DNA accretion is a function of age (independent of nutrition) Younger heifer at breeding size will have less DNA Most mammary development occurs in late pregnancy If fat in mammary pad, fat everywhere (too fat heifer!)
55 Growth Data Variable E R SE Number Lifetime ADG, kg/d 0.93 a 0.66 b Number reaching puberty Age at puberty, months Treatment a 11.6 b 0.39 BW at puberty, kg a,b Means with non-common letters differ (P < 0.05) Meyer and Van Amburgh, 2006
56 Parenchymal DNA Meyer and Van Amburgh, 2006 Parenchyma DNA, mg TRT: P < 0.01 BW: P < 0.01 TRT*BW: P = 0.10 * * * * E R Slaughter Weight, kg *Denotes treatment effect within slaughter weight. (P < 0.05)
57 Epithelial Cell Proliferation Meyer and Van Amburgh, BrdU labeled epithelial cells, % * TRT: P = 0.08 BW: P < 0.01 TRT*BW: P = Slaughter Weight, lb E R *Denotes treatment effect within slaughter weight. (P < 0.05)
58 What is the optimal ADG? May depend on each farm s goals and management ability Average daily gain of 0.8 kg/d is achievable with little risk ADG of 0.9 kg/d or more with proper nutrition (adequate metabolizable protein supply and appropriate energy supply)
59 Weak heifer programs have greater variation in size at any age Figure 2. Comparison of individual herd heifer growth rates to variance Body weight, lbs Within Range = 41 % Age, months Low Range High Range Grower From P. Hoffmann
60 Good heifer programs minimize variation in size at any age Figure 1. Comparison of individual herd heifer growth rates to desired variance Body weight, lbs Within Range = 77 % Age, months Low Range HighRange Grower From P. Hoffmann
61 Success in heifer enterprises Approaching as a system (not thinking of calves and each heifer groups as separate entities) Setting goals and targets for system Measuring, recording, monitoring, adjusting to reach targets (= MANAGING) Evaluating past performance for updated goals KISS (Keep It Simple, Stupid!)

62 Thank you!