DEMAND FOR CHEMICAL FERTILIZERS IN KARNATAKA
|
|
|
- Alexis Daniel
- 5 years ago
- Views:
Transcription
1 DEMAND FOR CHEMICAL FERTILIZERS IN KARNATAKA Thesis submitted to the University of Agricultural Sciences, Dharwad in partial fulfilment of the requirements for the Degree of Master of Science (Agriculture) In AGRICULTURAL ECONOMICS By SUMA H. N. DEPARTMENT OF AGRICULTURAL ECONOMICS COLLEGE OF AGRICULTURE, DHARWAD UNIVERSITY OF AGRICULTURAL SCIENCES, DHARWAD JULY, 2007
2 ADVISORY COMMITTEE Place: Dharwad Date: (H. BASAVARAJ) MAJOR ADVISOR Approved by : Chairman : (H. BASAVARAJ) Members : 1. (L. B. KUNNAL) 2. (V. R. KIRESUR) 3. (BASAVARAJ BANAKAR)
3 C O N T E N T S Sl. No. Chapter Particulars CERTIFICATE ACKNOWLEDGEMENT LIST OF TABLES LIST OF FIGURES 1 INTRODUCTION 2 REVIEW OF LITERATURE 2.1 Production and pattern of consumption of chemical fertilizers 2.2 Factors influencing use of chemical fertilizers 2.3 Demand for chemical fertilizers 3 METHODOLOGY 3.1 Description of the study area 3.2 Nature and source of data 3.3 Sampling procedure 3.4 Analytical tools employed 4 RESULTS 4.1 Production of fertilizers in Karnataka 4.2 District wise consumption of fertilizers in Karnataka 4.3 General characteristics of the sample respondents 4.4 Pattern of consumption of chemical fertilizer by sample respondents 4.5 Chemical fertilizer demand function and demand projections
4 Contd.. Sl. No. Chapter Particulars 5 DISCUSSION 5.1 Fertilizer production in Karnataka 5.2 District wise consumption of fertilizer in Karnataka 5.3 General characteristics of the sample respondents 5.4 Pattern of consumption of chemical fertilizers by sample farmers 5.5 Estimated fertilizer demand functions 5.6 Fertilizer demand projection 6 SUMMARY AND POLICY IMPLICATIONS REFERENCES APPENDIX
5 LIST OF TABLES Table No. Title 3.1 General information of Hassan district and selected taluks 3.2 Land utilization pattern in Hassan district and selected taluks ( ) 3.3 Irrigation status in Hassan district and selected taluks ( ) 3.4 Area under different crops in Hassan district and selected Taluks ( ) 3.5 Taluk wise consumption of chemical fertilizer in Hassan district ( ) 3.6 List of sample villages in Hassan district 4.1 Average fertilizer production in Karnataka 4.2 Growth in the production of chemical fertilizer in Karnataka 4.3 District wise Average fertilizer sale points in Karnataka 4.4 District wise growth in fertilizer sales points in Karnataka 4.5 District wise average consumption of NPK in Karnataka 4.6 District wise growth in the consumption of NPK in Karnataka 4.7 District wise average consumption of nitrogen in Karnataka 4.8 District wise growth in the consumption of nitrogen in Karnataka 4.9 District wise average consumption of phosphorus in Karnataka 4.10 District wise growth in the consumption of phosphorus in Karnataka 4.11 District wise average consumption of potash in Karnataka 4.12 District wise growth in the consumption of potash in Karnataka
6 Contd.. Table No. Title 4.13 District wise average consumption of chemical fertilizer (NPK) during kharif in Karnataka 4.14 District wise growth in the consumption of chemical fertilizer (NPK) during kharif in Karnataka 4.15 District wise average consumption of chemical fertilizer (NPK) during rabi in Karnataka 4.16 District wise growth in the consumption chemical fertilizer (NPK) during rabi in Karnataka 4.17 Seasonwise average consumption of chemical fertilizer in Karnataka 4.18 District wise average consumption of NPK per gross cropped area in Karnataka 4.19 District wise growth in per hectare consumption (NPK) in Karnataka 4.20 Average consumption of different fertilizers in Karnataka 4.21 Growth in consumption of different fertilizers in Karnataka 4.22 General characteristics of the sample farmers 4.23 Land holdings of the sample farmers 4.24 Cropping pattern of the sample farmers 4.25 Crop wise fertilizer consumption pattern on sample farmers 4.26 Season wise consumption of fertilizers 4.27 Estimated fertilizer demand function 4.28 Projected demand for nitrogen fertilizer in Karnataka 4.29 Projected demand for phosphorus fertilizer in Karnataka 4.30 Projected demand for potash fertilizer in Karnataka 5.1 Per cent changes in major indicators over 20 years in Karnataka ( to )
7 LIST OF FIGURES Figure No. Title 3.1 Map showing of study area 4.1 Crop wise fertilizer consumption pattern on sample farms 4.2 Season wise consumption of fertilizers on sample farmers LIST OF APPENDICES Sl. No. Title 1. Investigator
8 1. INTRODUCTION The process of economic development and its growth in the early stages of a developing country is mainly dependent upon the progress of agricultural sector. In India, this sector occupies a predominant position in the economy. It contributes about 24 per cent to the national income of the country and sustains two-thirds population of India. It is the single largest sector providing employment to the extent of 56.7 per cent of the country s work force. The role of agricultural in India is not restricted to its contribution to national income but also extends to food security of the nation because it has to feed her mammoth population at present and in future too. It was expected that the total food requirement will be 249 million tonnes and 322 million tonnes in 2010 and 2025, respectively. The most challenging problem today is that the growth rate of food grain production dropped to 1.66 per cent per annum, which was lower than the population growth rate during period between the and The agricultural production can be increased either by bringing more area under the plough or through increased productivity. In the Indian context, land is becoming a shrinking resource for agriculture owing to competing demand for its use. Also the population growth has resulted in lower carrying capacity of land. Hence, in order to realize the need based targets of agricultural production, the pattern of production enhancement will have to rest heavily on increased yield. This essentially calls for optimizing the usage of the existing farm land by adopting new strategy for agricultural development. The new strategy includes judicious use of fertilizers. Fertilizer is the key element to maintain the tempo of agricultural production as studies have indicated that it has contributed to about 50 per cent of increased food grain production in the world. In the green revolution that occurred in India during 1960s, the use of fertilizer was one of the important factors coupled with fertilizer responsive hybrids and high yielding varieties and irrigation water that resulted in quantum jump in food production. For this reason green revolution is also called as seed-cum-fertilizer revolution. The contribution of fertilizer, water, improved seeds and plant protection measures to the increased agricultural production was respectively to the extent of 45 per cent, 28 per cent, 12 per cent and 15 per cent. Balanced use of fertilizer is essential to stabilize crop yields and sustain high crop productivity. The new strategy of integrated nutrient management seeks to make the best use of the available nutrient sources, both organic and inorganic as also the complementary agricultural practice so that maximum crop yields can be obtained with fertilizer inputs. Among all the strategic inputs, fertilizer plays a key role in modern agriculture. Fertilizer has been universally accepted as an integral part of package of practice for raising Indian agriculture to a higher technological plank. It is estimated that the fertilizers in association with water can enhance output by about 70 per cent. Nearly 50 per cent of the increased food grain production in the last decade in the world come from the increased use of fertilizers (Borlaug, 1996). It is accepted that fertilizer is an expensive agricultural input and therefore, its efficient use is indispensable for reducing the cost per unit of agricultural produce. In spite of large area of the country having the best kinds of soil in the world, abundance of rainfall, plentiful sunshine and ideal temperature almost throughout the year for crop production, the yield per hectare of crops in India is low. It is due to exhausted soils which have been over cropped from centuries without adequate replenishment for plant nutrients through fertilizer. Thus the role of chemical fertilizer in increasing agricultural production is well established. A corollary of this established fact is that the more fertilizer used the more agricultural production hence the demand for fertilizer in consistently increasing. Having recognized the importance of fertilizers in agriculture, the real question concerning the future is not whether to increase fertilizer consumption but how to accelerate the growth of fertilizer consumption and ensure its maximum efficiency in agriculture
9 production. In order to know the possibilities for increasing fertilizer consumption in future, it is necessary to examine the experience in the past. Historical evidence indicates that prior to 1940, the use of chemical fertilizer was confined only to plantations and cash crops. For foods crop, use of organic manures was generally recommended. Subsequently, certain unprecedented development such as break out of world war II and Bengal Famine in 1942 forced the Government of India to take measures for averting any major shortfall in food grain output. Consequently, grow more food campaign was initiated at the national level under which the use of fertilizers was an essential ingredient for increasing the yield of crops in short run. Since then chemical fertilizers have been receiving the prime importance under all agricultural development programmes. Fertilizer consumption in India during was 0.65 million tonnes which increased to million tonnes during In a span of 53 years fertilizer consumption has increased by more than 25 times. However, the average fertilizer consumption during the last 5 years ( to ) is showing a declining trend. This reveals an alarming situation and warrants an immediate action as the consumption has to be stepped upto 32.5 million tonnes by Based on consumption data, at least 6.23 per cent average annual growth in fertilizer consumption (Singh, 2005) is required to meet the anticipated level by The consumption of fertilizer recorded an impressive growth during for the second year in succession, after witnessing a slow and uneven growth in the preceding 4 years. The total nutrient consumption (N+P 2 O 5 +K 2 O) touched an estimated level of million tonnes during The growth in the consumption of total nutrients was 12.4 per cent during over the previous year. The consumption of N, P 2 O 5 and K 2 O was million tonnes, 5.26 million tonnes, 2.50 million tonnes recording a growth of 10.3 per cent, 13.7 per cent and 21.3 per cent respectively during over The ideal ratio of NPK consumption for the country as a whole is placed at 4:2:1 (Anon., 2006). The average fertilizer consumption per hectare in India during the year was kg, which was quite low as compared to that in China (271 kg), Japan (295 kg), UK (343 kg), Korea (459 kg) and Netherlands (501 kg) (Anon., 2004) The major states which had per hectare consumption higher than all India average included Punjab (208 kg), Andhra Pradesh ( (193.5 kg), Haryana (178.6 kg), Tamil Nadu (176.5), Uttar Pradesh (141 kg), West Bengal (139.2 kg), Karnataka (130.2 kg), Bihar (120.4 kg) and Gujarat (119.2 kg). In other states, the per hectare consumption was lower than the all India average. The total nutrient consumption during kharif 2005 was 9.20 million tonnes recording an increase of 10.2 per cent over kharif The rabi total nutrient consumption was million tonnes representing an increase of 14.2 per cent (Anon., 2006). The state recorded a step increase of 17.5 per cent in the consumption of total nutrients during over the previous year. The total nutrients consumption increased by 1.29 million tonnes during The consumption of N, P 2 O 5 and K 2 O was 0.75 million tonnes, million tonnes and 0.33 million tonnes during recording an increase of 14.9 per cent, 18.9 per cent and 21.9 per cent respectively over the previous year. Consumption of nutrients during kharif was 57 per cent and during rabi it was 43 per cent in The district-wise consumption pattern of fertilizer revealed that it was the highest in Bellary (1,35,979 tonnes) followed by Belgaum (1,29,587 tonnes), Raichur (1,28,265 tonnes) in the year Thus there exists wide variation in fertilizer consumption among the crops and across the districts in the state. It can been observed that due to the indiscriminate use of chemical fertilizer by the farmers led to the poor nutrient use efficiency, low factor productivity, depletion of soil s nutrient reserve and finally increased environmental problems, low yield, and low profit levels due to lack of knowledge about the balanced application of chemical fertilizer and crop requirement. Thus now a days, country is temped to own organic farming, it is obvious that faming in India without adequate fertilizer input will prove fatal for food security hence it has become necessary to apply the fertilizers to crops with balanced amount in order to meet the needs of growing population.
10 Realizing the importance of fertilizers in development of agriculture, the union government introduced fertilizer retention price-cum subsidy scheme (RPS) on November 1, Under this scheme fertilizers was supplied at subsidized prices to farmers throughout the country. The domestic production of fertilizer faces short of requirement. In the case of potassic fertilizers the entire quantity is imported. Imported urea also increases subsidy as its landed cost is higher than the domestic controlled selling price. During , India imported thousand tonnes of nitrogen, thousand tonnes of phosphorus and thousand tonnes of potassic fertilizer (Anon., 2005). Phosphatic and potassic fertilizer were decontrolled in August, Only urea continues to operate under a price control system and requires a heavy subsidy for keeping consumer price low. The government had issued the fertilizer control order 1995 under the Essential Commodities Act which regulates quality, price, trade and distribution of fertilizers in the country. The state governments are primarily responsible for ensuring the quality of fertilizers being manufactured and sold in their states through appointment of enforcement agencies. In Karnataka, though the continued increase in fertilizer use per hectare of gross cropped area is encouraging the current rate of fertilizer consumption, (110.8 kg/ha in ) is still for below the levels of consumption of some of the progressed states. Even the success achieved over a period of time is not uniform and has been confined to only a few parts of the state. Hence, it is necessary to identify consumption pattern of fertilizer in the state of Karnataka. Though there are a number of studies on fertilizer at the national level, the studies at the disaggregated level are only a few. The exercise at national level in any case is expected to give us some broad perspectives in to the trends in fertilizer consumption and nature and extent of the impact of various factors on fertilizer consumption. This has to be supplemented by regionwise studies, because the total fertilizer consumption figure gives only a consolidated picture of disaggregated data from different regions. Regions may differ widely in respect of soil, climatic conditions, irrigation, adoption of HYVs, the size of farm and so on. All these differences are concealed in the national estimates and make them inappropriate for use in region specific situation. Analysis of districtwise data on fertilizer consumption will be useful because it can reveal the degree of variation in the growth of fertilizer consumption across the districts. The consumption over a period of time provides an understanding of forces behind the growth of fertilizer and reveals the practices of districts which have remained outside the main stream of past growth in this vital agricultural input. This in turn will indicate the nature of policy required to achieve rapid growth in fertilizer consumption. The studies on the quantitative assessment of demand for fertilizers are very essential for perspective planning. In the content of fertilizer industry, demand estimation is vital to monitor supply side, to plan the expansions of domestic capacities, to decide the volume of imports, to create the infrastructure for movement and storage and to know the magnitude of efforts to be put in to achieve desirable targets. Fertilizer use decisions at the farmers level is a complex process. To start with the farmers has to decide whether or not to use fertilizer. Then follows the decisions of which crops to fertilize and at what rates. The capital rationing and other factors often necessitate decisions on how much crop area to fertilizer. It is generally noticed that farmers are not using recommended levels of fertilizers for the crops under cultivation. The present study has been undertaken to analyze district wise consumption pattern of chemical fertilizer at macro level in Karnataka and to study various factors influencing the consumption pattern at micro level in Hassan district. The results of the study will help
11 formulating suitable policy measures to ensure uniform fertilizer consumption pattern. The specific objectives of the study are: 1. To study the growth in the production and consumption of different chemical fertilizers in Karnataka 2. To study the pattern of chemical fertilizer consumption in Hassan district 3. To study the factors influencing demand for chemical fertilizers 4. To estimate the potential demand for chemical fertilizers and to suggest the policy measures Hypotheses 1. Production and consumption of chemical fertilizer are increasing over the years. 2. Chemical fertilizers are mainly used in high value crops. 3. Price alone influences the demand for chemical fertilizers. 4. The potential demand for chemical fertilizer is high. Presentation of the study The entire study has been presented in six chapters. In the first chapter, the nature and importance of the present study and the specific objectives of the study have been indicated. Second chapter deals with the review of the relevant research studies connected with the objectives. The third chapter outlines briefly the main features of the study area, the nature and source from which the relevant data have been collected and the statistical tools and techniques employed in the study for evaluating the objectives. The fourth chapter is devoted for the presentation of analyzed data through different techniques in which relevant details have been compressed and summarized under different tables under appropriate heads. Chapter fifth discusses the results of the study. In the sixth chapter, a brief summary of the main findings of the study have been presented along with the conclusion and the policy implications that emerged from the findings of the study.
12 2. REVIEW OF LITERATURE In this chapter an attempt has been made to critically review the past literature that is relevant to the present study. The review would help to keep the research on proper lines and to bring refinement in the study. The research work carried out by various researchers related to the problem under study has been reviewed under the following heads. 2.1 Production and pattern of consumption of chemical fertilizers 2.2 Factors influencing use of chemical fertilizers 2.3 Demand for chemical fertilizers 2.1 PRODUCTION AND PATTERNS OF CONSUMPTION OF CHEMICAL FERTILIZERS Desai and Singh (1973) examined the data on fertilizer consumption for 286 districts in India over the period between and They identified wide inter district variability in fertilizer consumption. More than 80 per cent of nitrogen (N) and phosphorus (P 2 O 5 ) was consumed in less than one third of the districts all through the period. At the other extreme, more than 50 per cent of the districts accounted for only 10 per cent of total fertilizer consumption. They, further observed a considerable variation in compound growth rates in consumption across the districts. In general, the districts with high growth rate of both N and P 2 O 5 were with low levels of fertilizer use. However, in the central and eastern region, the districts with low level of fertilizer consumption in the base year had low growth rates. Jha and Sarin (1980) made a district level analysis on fertilizer consumption in Semi Arid Tropics (SAT) of India using the data for the period from to The study indicated that over 62 per cent of the total fertilizer (N and P 2 O 5 and K 2 O) used in the SAT districts was consumed in the 78 irrigated districts which had only 35 per cent of the SAT cropped area. Thus fertilizer consumption was mainly concentrated in irrigated districts. The average level of fertilizer consumption per hectares of cropped area was 57 kg in the irrigated and 18 kg in the unirrigated districts. Considerable variation was noted in fertilizer consumption between districts even with in irrigated and unirrigated categories. The irrigated SAT districts showed better performance in terms of growth in total fertilizer consumption during the study period. Krishnamacharyulu and Muralidhar (1981) estimated the growth rates of per hectare fertilizer use in 18 major states of India using the data for the period from to They observed significant and positive growth rate for all the states except Kerala and Assam. Using the Spearman s rank correlation they examined shifts in the relative position of the states in per hectare fertilizer use with reference to base year They noticed that no state had shown any significant shift in its fertilizer use status. While computing the coefficient of variation for each year to determine the inter state disparities in fertilizer use, they found that there were large scale inter state variations in the levels of fertilizer use and it did not show any tendency of narrowing down over the period. A study on changing patterns of fertilizer consumption (Anon., 1982) reported that the fertilizer consumption in India had increased at the compound growth rate of 9.3 per cent per annum during the period from 1971 to There was a violent fluctuation in the consumption from year to year, region to region and across the states. Fertilizer consumption increased more rapidly in the states like Punjab, UP, Haryana and West Bengal. These states were followed by Gujarat and Bihar where only Marketing Federations dominated in fertilizer distribution. Balanced growth in fertilizer consumption was influenced by pricing mechanism and policies for fertilizer. Singh (1983) using the coefficient of variation as a measure of inequalities in fertilizer use, examined the inter state variations in levels of fertilizer consumption during the period from to Although the consumption levels in all the states increased over the period, the degree of variation in levels of fertilizer use among the states had continued to remain high.
13 Bhatia (1983) studied the pattern of fertilizer use in India from a survey of 200 sample respondents. The study revealed that sugarcane was one of the most important commercial crops in which rates of fertilizer use was found to be different in different states. Maharashtra recorded the highest application of fertilizer for sugarcane crop ( kg/ha) and it was followed by Andhra Pradesh ( kg/ha), Tamil Nadu ( kg/ha), Uttar Pradesh (64.11 kg/ha) and Bihar (46.2 kg/ha). Cotton and sugarcane were the important crops which accounted respectively for 7.14 per cent and 7.12 per cent, of the total fertilizer consumption in the country during the year Waghmare and Dhongade (1985) carried out an economic analysis of fertilizer application and yield rates of sugarcane in Maharashtra. They concluded that sugarcane growers had not adopted the balanced use of N, P and K fertilizers. The gap between the recommended and observed levels of nitrogen were of the order of 10 per cent to 15 per cent. Leela (1985) made a district wise study on fertilizer consumption in Andhra Pradesh for the period from 1960 to A general increase in the levels of per hectare fertilizer use in all the districts was noticed. Her study indicated increase in the levels of per hectare fertilizer use during the period, with the coefficient of variation showing a decline from per cent in to per cent in In a study entitled economics of farm management in command area of Nagarjuna Sagar irrigation project in Andhra Pradesh from a survey of 400 sample respondents, it is found that the per hectare fertilizer consumption was kg of which kg was N, kg P 2 O 5 and 5.70 kg K 2 O. The fertilizer consumption was found to be higher in irrigated villages while in unirirgated villages higher doses of organic manures was used (Anon., 1986). Singh et al. (1987) conducted a study on the pattern of fertilizer use in Punjab state. The data was collected from wheat and paddy growers ( , and ). They found that the average yields of both wheat and paddy have shown a continuous and marked increase since the early seventies. The increase was from quintals per hectare and quintals per hectare during to quintals per hectare and quintals per hectare during for wheat and paddy respectively. The co-efficient of variation in yield showed a narrowing of yield differential on different farms. The coefficient of correlation between nitrogen fertilizer applied and the yield of wheat and paddy clearly showed that the application of nitrogen fertilizer had contributed significantly to increase the yield level. Singh et al. (1989) examined the production response of rice farmers in different locations of canal irrigation to the use of manure and fertilizers on different farmers in Himachal Pradesh. It was found that the majority of farmers were using fertilizer in both the season i.e. kharif and rabi and it was positively related to the size of farms. It was further noticed that the use of fertilizer was below the recommended levels. Waghmore and Sorgekar (1991) urged the farmers to use chemical fertilizers as a part of the modern technology for agricultural production in India. The study examined the consumption pattern of fertilizers in Maharashtra in order to assess per hectare utilization and the consumption of nitrogen, phosphates, potash and all chemicals fertilizers together. Time series data for the period from to were used. The trends in fertilizer use in general were found to be positive in all most all districts in the state. The consumption of fertilizer per hectare was found to increase from kg in to kg in The highest consumption level of kg/ha was noticed in the district of Kolhapur. Shiyani et al. (1991) estimated NPK requirement for Saurashtra region of Gujarat state for the period from to The results showed significant increase in P and K, while the requirement of N remained almost static. The consumption of NPK fertilizer showed significant increasing trend suggesting that the gap between requirement and actual consumption decreased year after year. The analysis for districts showed large variation in fertilizer consumption.
14 Kumar et al. (1991) studied fertilizer consumption pattern in upper Gangentic plain region. The total NPK consumption in the region during was 1349 thousand tones which constituted about 11.7 per cent of the total fertilizer consumption of the country. Lin et al. (1995) studied pesticide and fertilizer use and trade in US agriculture. Pesticides used on major crops increased by more than two folds during the period between 1964 and Nitrogen, phosphate, and potash use for all purposes (agriculture and nonagriculture) rose from 7.5 million pounds in 1960 to a record high of 23.7 million pounds in Since the early 1950s, pesticide and fertilizer use in US agriculture has declined with crop acreage and amounted to 574 million pounds of pesticides and 20.7 mt of fertilizer in Anonymous (1995) studied crop wise fertilizer use in Andhra Pradesh during The study revealed that small farmers with share of 18 per cent of the total cultivated area accounted for 23.5 per cent of the nutrient consumption, medium farmers with a share of 31.2 per cent of the cultivated area accounted for 32.4 per cent of nutrient consumption, while large farmers with a share of 50.8 per cent of the cultivated area accounted for 44.1 per cent of total nutrient consumption. The crops using the higher amounts of fertilizers were sugarcane, paddy and cotton. Inamke et al. (1996) examined the fertilizer use pattern for sugarcane in respect of three recovery zones of sugarcane in Maharashtra at different points of time. They observed that among the three recovery zones, the use of N, P 2 O 5 and K 2 O fertilizers was not as per the recommendation and it was very low in low recovery zone where the productivity was also very low (50 t/ha) as compared to other two zones. Mudi and Giri (1999) conducted the study on variation in the pattern of fertilizer use between Aman paddy and potato and their economics in a latertic zone of West Bengal. Primary survey was conducted purposively in selected three village of Ghatal block in the district of Midnapur for the study. They found that farms used different types of fertilizer in different forms and combinations either as single nutrient fertilizer or a mixed nutrient fertilizer and branded, unbranded or in the combination of both. They concluded that the potato growers had inclination to use mixed fertilizers along with single nutrient fertilizer. Paddy growers preferred the use of single nutrient branded fertilizer in majority cases. There was a positive correlation (0.39) between percentage of nitrogen placed as top dressing and yield. Sigh et al. (1999) studied the fertilizer use, problems and potentials in rainfed areas in India. The study revealed that the impact of fertilizer use on productivity was much less significant in rainfed farming throughout the country. The average use of fertilizer remained quite low (25 kg/ha) in rainfed crops. A number of constraints limiting the wide spread use of fertilizer in dry lands was noticed. Uncertainty of rainfall was one of the primary risk factors influencing the farmer s decision in using this expensive input. Velrasu and Singh (1999) examined the fertilizer use pattern and its impact on crop productivity from survey of 72 farmers. The study revealed that most of the farmers did not follow the recommended fertilizer dose in Tamil Nadu. Besides this, there was a wide disparity in fertilizer use among various categories of farmers and crops. Fertilizer use was high in irrigated areas as compared to dry land areas. The over utilization of N and under utilization of P and K was noticed. They emphasized the need for efforts to ensure balanced fertilizer use by the farmers to make agriculture sustainable. Singh et al. (2000) studied constraints in fertilizer use in Arid Zone of Western Rajasthan. They found that among the fertilizer users, maximum farmers have applied more nitrogenous fertilizer as compared to phosphatic fertilizer and fertilizer applied was less than the recommended dose. The main constraints perceived by the farmers were lack of irrigation facilities, high cost of fertilizer and lack of knowledge on fertilizer use. Khunt et al. (2001) observed high fluctuation in fertilizer consumption with high growth rate in Gujarat state during the period from They also noticed increasing consumption of K in rabi season and declining trend in kharif season.
15 Saraswat and Singh (2003) studied the strategy for fertilizer consumption in Himachal Pradesh. The study revealed that the annual compound growth rate in consumption of all fertilizers was 7.06 per cent per annum during the study period. The growth of fertilizer consumption in kharif and rabi season was 5.88 and 8.29 per cent per annum respectively. The highest annual growth was recorded in Kullu district (9.17%) and the lowest (3.0%) in Kinnaur district. The consumption of total fertilizer in kharif declined by 0.41 per cent in Kinnaur. Mehmood and Shereen (2004) examined the fertilizer demand and drought in India. They observed that of the total fertilizer, 35.1 per cent was used for paddy, 19.3 per cent for wheat, 5.9 per cent for cotton, 5.5 per cent for sugarcane, 4.7 per cent for groundnut, 2.6 per cent for maize crop and the remaining consumption was accounted by other crops. On the whole, about 70 per cent of fertilizers was consumed in irrigated area. Another feature of fertilizer consumption in India was that the cereal crops consumed 60 to 65 per cent. Singh (2004) in his study revealed that per hectare fertilizer consumption in India was less than that in other developed as well as a few developing countries, even though the consumption has increased by six-folds in the last three decades. He also reported that 55 per cent consumption of fertilizer was concentrated in 5 states. Xavier (2004) conducted a study on yield response of crops to fertilizer use in Siragaga district of Tamil Nadu from a survey of 200 farmers. The study revealed that application of N was more than the recommended level in all categories of farmers while that of P fertilizers was less than the recommended. Regarding K, marginal farmers used kg/ha while all other farmers used more than the recommended level of 50 kg/ha. 2.2 FACTORS AFFECTING THE USE OF CHEMICAL FERTILIZERS Patil and Pandey (1981) using the static and dynamic models, attempted to examine the influence of economic and agronomic factors in determining the applications of phosphatic fertilizers at macro level. The Cobb-Douglas type of function was used to explore the phosphatic fertilizer use in different states for the period from to The study revealed that irrigation was the most dominating factors in increasing fertilizer consumption. The real price of fertilizer did not affect fertilizer consumption in any significant manner in almost all the states. Improved farm technologies and management practices in all the states were expected to increase the future consumption of phosphatic fertilizers. Patil and Pandey (1982) conducted a study on nitrogenous fertilizers using the time series data from to The study emphasized the need for remunerative and stable price of crops apart from irrigation and technological changes. In Karnataka irrigation was the only significant factor influencing the fertilizer use over the period. Sarup and Pandey (1982) studied the socio-economic characteristics affecting fertilizer use in Orissa from survey of 110 farmers. The study revealed that adoption of HYV seeds and plant protection measures were the major factors which discriminated fertilizer users from non-users followed by education level. The study indicated that the farmers with innovative attitude, better education and soil fertility consciousness used more fertilizer by taking advantage of the institutional credit and other facilities. Gupta (1983) examined the trends in fertilizer consumption by using the multiple regression analysis to capture the effect of different variables on consumption of nutrient N (kg) per hectare of cropped area in India ( ). Among the variables considered area under irrigation, weather, relative price of fertilizers and the share of cropped area exerted positive and significant influences on dependent variable while the area under HYVs and the credit failed to exert significant influence. Nagaraj (1983) using the correlation and regression analysis determined the impact of factors affecting fertilizer use in different states of India. The result showed that rainfall was
16 relatively an unimportant variable in explaining the observed variation in fertilizer use. The factors like irrigation, spread of HYV s and fertilizer intensive crops were found to have a positive and significant effect on fertilizer consumption. Relative price of fertilizers was inversely related in many cases but not significant. Sighn (1983) attempted to investigate and quantify the impact of different factors responsible for inter state variation in fertilizer consumption levels. Linear and log-linear regression models were fitted for two different time periods, and The results of the study demonstrated that irrigation, HYV crops and credit availability were the significant factors while rainfall and size of land holding failed to show any significant effect on fertilizer use. Datta et al. (1985) conducted a study on constraints in the use of fertilizers in West Bengal by using secondary data from to The study revealed that lack of irrigation facilities and inadequate extension services as the major constraints in fertilizer consumption. They suggested that the provision of adequate irrigation facilities, expansion of extension services and imparting training to the farmers in balanced use of fertilizers should be implemented in order to increase the use of fertilizer. Flinn and Shakya (1985) studied the factors influencing the adoption and use rates of fertilizer for wheat in Nepal. The study revealed that the factors related to fertilizer use in wheat were the area under cultivation, extent of irrigation, transport cost of fertilizer and operators tenure status. They further revealed that the fertilizer adoption was sensitive to the cost of fertilizer and procurement implying that farmers in the area were responsive to fertilizer price as reflected in procurement plus delivery cost. Desai (1986) conducted study on policies for growth in fertilizer consumption. He opinioned that because of the constraints on lowering real prices of fertilizers non-price policies would be more crucial in determining the fate of future growth in Indian s fertilizer consumption. Under the present price environment, there was great scope to accelerate growth in fertilizer consumption through non-price policies like improving the efficiency of fertilizer use, shifting the responses functions upwards through use of quality seeds and removing the deficiencies in fertilizer supply and distribution system. Kute (1990) studied the factors influencing the use of fertilizers in plains and hilly regions of Gujarat using the time series data from 1983 to He found that weather factor such as rainfall, temperature soil including irrigated area had direct relation with fertilizer use. The poor weather condition has resulted in the reduction in fertilizer consumption by about 20 per cent and the drought condition has reduced the fertilizer consumption by 34 per cent. John and George (1991) conducted the study on factors influencing the fertilizer application for sustainable agriculture in west coast plain and ghat regions of India considering the 6 regions. They found that relatively high cost of fertilizer, low benefit cost ratio and lack of awareness of recommended does of fertilizer for specific crops were the reasons behind the low use of fertilizer. Green and Ngongola (1993) using the multivatie logistic analysis attempted to examine the factors affecting fertilizer adoption in less developed countries in Malawi. The empirical findings of the study revealed that the crops grown (maize or tobacco), farming system, variety, access to credit, off-farm employment opportunities and regular labour required were established as the main factors influencing fertilizer adoption. Norma et al. (1997) studied the factors affecting the adoption of improved maize seed and fertilizer in Northern Tanzania from a survey of 246 farmers. The study showed that influence of fertilizer application on the improved maize seed was significant but small in magnitude whereas the effect of improved seed on the adoption of fertilizer was much greater. Kayarkanni (2000) studied fertilizer use in three major crops in Mudurai district of Tamil Nadu from a survey of 324 farmers. The relative price of fertilizer had a greater
17 influence on fertilizer use. It was also found that fertilizer demand for the three crops was price inelastic. It was inferred that other things remaining constant fertilizer use on tentent farm was more than that on owner farms. The co-efficient of irrigation system dummy was found to be negative and significant for sugarcane and cotton crops. This implied that the use of fertilizer was found to be higher in irrigation system other than the cannal system. Bezbaruah and Roy (2002) conducted a study to identify the factors affecting the adoption and use of fertilizer by farmers in Barak Valley. They selected agricultural extension officer circle from each of the six agricultural sub-divisions in the region. They observed that the regression coefficients for operational holding, tenancy and low land were significant and expectedly positive. The result suggested that there was no significant variation in the application of fertilizer per hectare with farm size and multiple cropping tenant but the application of fertilizer per hectare by the farmers had been found to be significantly conditional upon availability of irrigation and access to extension service. Singh and Nasir (2003) observed inadequate agricultural credit flow in Bihar. They inferred that the agricultural credit flow had positive influence on fertilizer consumption. In general, economic factors viz., irrigation, cropping pattern, area under HYVs, prices of fertilizers, certainty and size of income, capital rationing and labour cost were the important determinants of fertilizer use on the farms. It was also pointed out that the natural factors like temperature and frequency of drought influenced fertilizer use. 2.3 DEMAND FOR CHEMICAL FERTILIZERS Sankhyan and Sirohi (1972) applied parametric programming model for determining the demand functions for fertilizers in Mandi district of Himachal Pradesh with a view of analyze the effect of credit availability and fertilizer prices on the demand for this crucial input. The demand functions indicated a shift uptwards to the right when capital constraint was relaxed through a borrowing activity. Low price elasticities suggested that the decrease or increase in the price of fertilizer would not lead to any substantial change in the demand for this input. Singh et al. (1984) attempted to estimate demand for nitrogenous fertilizers in India. They used the programming technique in their analysis. They parameterized the price elasticities for inputs. The results indicated two important implications (1) The change in fertilizer price policy would have different impact on demand pattern, and (2) the responsiveness of fertilizers to modern technology of crop production, hence there was a great scope to exploit the full potential of HYV s by applying right doses of fertilizers. They opined that there was an urgent need to increase the production of nitrogenous fertilizer to meet the increasing demand. Uma et al. (1990) used adjustment model a version of dynamic model. This approach captured some of the dynamic elements in fertilizer demand better than simple static models without merely resorting to time trends. The results indicated that an increase in fertilizer demand to raise productivity of land would require a fall in relative price. Though the farmers stand to gain directly from the provision of subsidies, the economy as a whole suffers in the long run. Hence, they suggested that education was to be imported to farmers on balanced use of fertilizers and use of micronutrients wherever necessary. Dholakia et al. (1995) estimated of price elasticity of fertilizer demand at macro level in India using both static and dynamic models with annual data for to The results indicated that fertilizer demand is price inelastic in both the short and long runs. Anonymous (1997) studied input demand and supply scenario in India agriculture. The study revealed that per hectare fertilizer consumption among major states was highest in Punjab at 170 kg followed by Andhra Pradesh (137 kg), Haryana (124 kg) and Tamil Nadu (107 kg) while in many states like Karnataka, Madhya Pradesh, Maharashtra, Rajasthan, Bihar, Orissa and Assam it was less than the national average.
18 Bal and Bal (1999) studied the fertilizer demand for wheat crop in Punjab. The study revealed that if the farmers were motivated to use the optimum does of fertilizer, the demand for N would be thousand quintals as against the estimated consumption of thousand quintals for the wheat crop during The consumption of P for this crop was thousand quintals against the demand of thousand quintals the same period. Wagle (1999) estimated fertilizer demand and private investment function in India using time series data from to They observed that exclusion of the water variable represent a serious deficiency in the specification of the fertilizer demand function. The chow test for structural stability turned out to be significant at 5 per cent level of confidence in respect of the static model. But it is not so in the dynamic model. Kayarkanni (2000) estimated the fertilizer demand function for Tamil Nadu. The analysis was based on the time series data from to The results of the static model indicated that relative price and land intensity were negatively related with fertilizer demand while per cent area under HYV, per cent area irrigated and weather had a positive relationship with fertilizer demand. The study indicated that 12 per cent increase in area under HYV would lead to increase in fertilizer demand by 1.13 per cent. The R² indicated that explantatory variables accounted over 96 per cent variation in fertilizer use in dynamic model. The short-run price elasticity for fertilizer demand was and adjustment co-efficient was The short-run fertilizer demand decreased by per cent in response to 10 per cent increase in relative price. In the seminar on changing scenario of fertilizer and agriculture organized by Fertilizer Association of India it was stated that fertilizer demand world wide was likely to grow at about 2.1 per cent per annum during the next five years from about million tones in to about million tonnes in The growth would be more in P and K (2.7% per annum as compared to present 1.7 per cent per annum (Anon., 2005).
19 3. METHODOLOGY The design of the study is an important component of research. To realize the various objectives of the study, an appropriate methodology describing sampling design, data collection and tools of analysis for the conduct of the study are incredible. In this chapter, the methodology adopted for the present study, including the description of the study area, sampling procedure, nature and source of data and analytical tools employed are presented under the following heads. 3.1 Description of the study area 3.2 Nature and source of data 3.3 Sampling procedure 3.4 Analytical tools employed 3.1 DESCRIPTION OF THE STUDY AREA An assessment of any development activity can be made only with a detailed understanding of the physical and natural characteristics and socio-economic status of the region. Hence an attempt has been made to describe the physical, natural and socioeconomic features of Hassan district, with special references to Hassan and Alur taluks, where this study was conducted to analyse micro level consumption pattern of fertilizers. Hassan district falls in the southern part of Karnatak state. It lies between and North latitude and between and East longitude. The district is surrounded by Chickmagalore district in the North, Tumkur district in the East, Mandya and Mysore districts in the South and Dakshina Kannada and Madikere districts in the West (Fig. 3.1). The total population of the district is lakh as per 2001 census, out of which 8.5 lakhs were male and 8.6 lakhs were female. It comprises of lakh of rural population and 3.04 lakhs of urban population. The literacy rate of the district is per cent out of which per cent male and per cent female (Table 3.1). It can be seen that majority (33.13%) of the population belonged to the non-working group followed by main working group (27.17%) and cultivars (18.40%). The agricultural labourer in the district comprised 4.90 per cent. About 9.60 per cent, 6.26 per cent 0.54 per cent are other workers, marginal workers and household activities workers in the district respectively. In the district majority (66.10%) of the population belonged to the marginal farmers followed by small (22.09%), semi medium (8.86%), medium (2.61%) and large farmers (0.34%). The average annual rainfall in the district is 1,031 mm and actual rainfall in the year 2004 was 1,419 mm. Most of the rainfall in the district is confined to the period from May to October, July being the heavier rainfall month. The maximum temperature is 31 C and December is the coolest month. The soils of the Hassan district are predominantly red and sandy soils. They vary from red to brownish in colour, shallow to fairly deep and loamy to sandy loam in texture. They are well drained but poor in bases and water holding capacity. About 42 per cent of the soil are poor in organic matter. Soils are also poor in available phosphorus. The soils are favourable for growing of crops like paddy, sugarcane, potato and vegetables under irrigated condition. The crops like potato ragi, maize, pulses, groundnut, cotton etc. can be grown under rainfed conditions. The major rivers in the district are Kaveri, Hemavathi, Yagachi and they cover sq.km. In the district, total irrigated area is hectares of which the share of bore well is per cent followed by cannel (34.39%) and other sources (26.25%) including tanks, open wells and lift irrigation (Table 3.3).

20 Fig. 3.1 Map showing study area
21 Table 3.1 General information of Hassan district and selected taluks Sl. Particulars Hassan district Hassan taluk Alur taluk No. 1 Geographical area (ha) Population (No) Total Male Female Rural Urban Literacy (%) Male Female Rainfall mm Workers(No) Main workers (27.17) (26.92) (27.86) Marginal workers (6.26) (5.68) (5.64) Non-workers (33.13) (34.80) (32.99) Cultivators (18.40) (17.42) (14.46) Agricultural labours (4.90) (2.93) (5.16) Household activities (0.54) (0.47) (0.46) Other workers (9.60) (11.78) (13.43) 6 Land holding Marginal (No) (66.10) (75.24) (61.65) Small (No) (22.09) (17.74) (24.14) Semi medium (No) (8.86) (5.87) (9.93) Medium (No) (2.61) (1.07) (3.58) Large (No) (0.34) (0.08) (0.70) 7 Banks (No) Commercial banks Grameena banks Urban cooperative banks Other cooperative banks P.L.D. Banks Markets Population as per the 2001 census Figures in parentheses indicates percentages
22 Table3.2 Land utilization pattern in Hassan district and selected taluks ( ) (Area in ha) Sl. No. Particulars Hassan district % to geographical area Hassan taluk % to geographical area Alur district % to geographical area 1 Area under forest 2 Land not available for cultivation 3 Cultivable waste 4 Fallow land 5 Net sown area 6 Total cropped area Source: District at a glance The land utilization pattern of the study area during is furnished in Table 3.2. The total cropped area of the district is 4,60,429 hectares. The share of net sown area is per cent followed by land not available for cultivation area with about per cent, forest area (8.87%), cultivable waste (8.06%) and follow land (7.27%). The major crops grown in the Hassan district is presented in Table 3.4. The gross cropped area in this district is 4,60,429 hectare of which area under cereal crops is 1,97,688 hectare (42.94%). The share of ragi was per cent followed by paddy (11.55%), maize (6.53%) and jowar (1.14%). The pulses account for per cent, commercial crops like potato and sugarcane respectively account for 7.85 per cent and 1.50 per cent. The oilseeds, fruits, vegetable and food crops constitute 5.64 per cent, 1.52 per cent, 9.0 per cent, 53.0 per cent respectively. The district has 127 commercial banks and 44 Grameena banks. There are totally 38 cooperative banks of which 5 are urban co-operative banks, 21 are other cooperative banks and 8 are primary land development banks (PLDBs). These are totally 22 regulated markets of which 6 are main markets and 16 are sub markets and their turnover was crores rupees in the district Brief description of the two taluks choosen for the study Two taluks viz., Hassan and Alur are selected for the study based on the highest and lowest fertilizer consumption in the district.the grographical area of Hassan and Alur taluks is 91,818 hectare and 40,265 hectare respectively. The total population of these taluks is 3,61,147 and 86,071 of which 1.81 lakhs in Hassan and 0.42 lakhs in Alur were male and 1.80 lakhs and 0.43 lakhs female respectively. The rural population in Hassan and Alur taluks was 2.27 lakhs and 0.79 lakhs. The literacy per cent in Hassan taluk was per cent and per cent in Alur taluk (Fig.3.1).
23 Table 3.3 Irrigation status in Hassan district and selected taluks ( ) (Area in ha) Sl. No. Source of irrigation Hassan district Hassan taluk Alur taluk 1 Canals (34.39) (34.25) (18.89) 2 Tanks (23.81) (32.33) 5075 (74.20) 3 Open wells 1188 (1.28) (0.40) (0.77) 4 Bore wells (39.36) (33.02) (1.14) 5 Lift irrigation 19 (0.02) Others 1062 (1.14) (5.00) Total irrigation (100) 8064 (100) 6840 (100) Figures in parentheses indicate percentages Source: District at a glance In Hassan taluk, majority (34.80%) of the population belonged to non-working group, followed by main working group (26.92%) and cultivators (17.42%). About 2.93 per cent of the population are agricultural labours. The other workers, marginal workers and household activities comprises of per cent, 5.68 per cent and 0.47 per cent respectively. About per cent of the population belonged to the non-working group in Alur taluk, followed by main working group (27.56%) and cultivator (14.46%). About per cent, 5.64 per cent and 0.46 per cent are other worker, marginal workers and household activities. The agricultural labour in the taluk accounted for 5.16 per cent. Majority (75.24%) of Hassan taluk farmers belonged to marginal land holding category followed by small land holding (17.74%), while, 5.87 per cent and 1.07 per cent of the farmers belonged to semi medium and medium land holding. About 0.08 per cent of the farmers belonged to large holdings. Majority (61.65%) of the Alur taluk farmers belonged to marginal land holding followed by small, semi medium, medium and large holding. The average annual rainfall of Hassan and Alur taluks respectively was 856 mm and 1,060 mm. The actual rainfall during was mm in Hassan and 1, mm in Alur taluk. The total net irrigated area is 8,064 hectares and 6,840 hectares in Hassan and Alur taluks. The share of canals is per cent in Hassan and per cent in Alur. The respective share of tanks is per cent and per cent, open wells is 0.40 per cent and 0.77 per cent and bore wells is per cent and 1.14 per cent. The net area sown in Hassan and Alur taluks was 53,245 hectares and 22,268 hectares. The total cropped area in the respective taluks was 70,832 hectares and 25,494
24 Table 3.4 Area under different crops in Hassan district and selected Taluks ( ) (Area in ha) Sl. No. I Cereals Crops Hassan district Hassan taluk Alur taluk Area % Area % Area % 1 Paddy Ragi Jowar Maize Wheat Other cereals Total cereals II Total pulses III Commercial crop 1 Potato Sugarcane IV Total oilseeds V Total fruits VI Total vegetables VII Total food crops VIII Gross cropped area Source: Hassan district at a glance District Statistical Office Hassan hectares accounting for per cent and per cent of geographical area. The forest area is 3,677 hectare and 487 hectares in Hassan and Alur taluks account for 4.00 per cent and 1.21 per cent of geographic area. The land not available for cultivation accounted 1.80 per cent and 8.24 per cent to the total geographical area of the taluks respectively. The main crops of Hassan taluk are ragi (21,821 ha) accounting for per cent. The share of paddy was 5.41 per cent, jowar 0.58 per cent, maize per cent. The potato and sugarcane accounted for per cent and 0.56 per cent. The other crops grown in the taluk are oilseeds (3.58%), fruits (1.62%), vegetable (28.93%) and food crops (58.92%) respectively. Similarly important crops grown in Alur taluk are paddy (25.67%), ragi (9.10%), maize (25.42%), pulses (1.89%), potato (60.19%) and sugarcane (0.02%). The other crops like oilseeds (0.78%), fruits (2.13%), vegetable (8.10%) and food crops (62.10%) are also grown in the taluk.
25 There are totally 33 commercial banks and 6 Grameena banks in Hassan taluk, whereas Alur taluk is having 8 commercial banks and one Grameena bank. In Hassan taluk there are 2 urban cooperative banks, 6 other cooperative banks and one PLDB while in Alur taluk one cooperative and one PLDB banks are working. Hassan taluk is having 2 regulated markets of which one is main market and another one is submarket where as in Alur taluk there is no market facility. 3.2 NATURE AND SOURCES OF DATA In the present study both primary and secondary data were used for evaluating the specific objectives of the study. The secondary data on production of chemical fertilizer, consumption of chemical fertilizer (NPK), season wise consumption, consumption per gross cropped area. Consumption of fertilizer materials and sales points of fertilizer were collected from the Agricultural Input Division of the Directorate of Agriculture, Bangalore. The secondary data covered the period of seventeen years from 1985 to The data on demographic information, pattern of land utilization, crops grown and other relevant data about the district and taluks was obtained from the Hassan District Statistical Office. The primary data for the present study were elicited for the agricultural year from the selected farmers by using well structured and pre-tested schedules. The data relating to general information about the respondents, land holding, irrigation source, cropping pattern, fertilizer use were obtained from the sample respondents. Data pertaining to the pattern of fertilizer consumption, name of fertilizer, quantity of fertilizer applied, prices of fertilizer, quantity of FYM applied, time of application, method of application, cost of transportation, area under crops were also elicited from sample farmers. The method of personal interview was adopted to elicit the data from respondents and ensured that the data made available by the respondents were relevant, comprehensive and reasonably correct and precise. 3.3 SAMPLING PROCEDURE Keeping in view the objectives of the study, a multi-stage sampling procedure was adopted for the selection of the district, taluks, villages and farmers for getting primary data. In the first stage, Hassan district was purposively selected for the study as the researcher hails from the district and is familiar with the area. In the second stage, out of eight taluks in the district, two taluks were selected. It was proposed to select the highest and lowest fertilizer consumption taluks to have different dimensions of fertilizer consumption. The talukwise fertilizer consumption is presented in Table 3.5. The fertilizer consumption was the highest (29570 tonnes) in Hassan taluk and the lowest in Alur taluk (3380 tonnes). Hence these two taluks were selected. In the third stage, from each selected taluk, five villages were selected randomly. The villages selected were Dasara Koppalu, Salgame, Kalkere hosur, Chikkagaduvalli and Tavaradevara koppalu from Hassan taluk and Himtipura, Kamthi, Nakalgod, Kanthur and Kumbaralli from Alur taluk. Thus ten villages were selected (Table 3.6). In the final stage, from each sample village, ten farmers were selected randomly for eliciting the required information for the study. Thus in all, a sample of 100 farmers were selected from ten villages in two taluks of Hassan district. 3.4 ANALYTICAL TOOLS EMPLOYED Keeping in view the specific objectives of the study, the data collected were subjected to following statistical analysis Tabular analysis Growth rate analysis Regression analysis Tabular analysis Triennium averages for various aspect of fertilizer consumption were worked out to even out annual fluctuations. The technique of tabular presentation was followed for presenting the land holding, cropping pattern, crop wise and season wise consumption of
26 Table 3.5 Taluk wise consumption of chemical fertilizer in Hassan district ( ) (tonnes) Sl. No. Taluk N P K Total 1 Alur (4.07) 2 Arakalagudu (7.52) 3 Arasikere (5.57) 4 Belur (6.24) 5 Channarayapatna (9.42) 6 Hassan (35.64) 7 Holenarasipura (8.89) 8 Sakleshapura (22.65) Total (100) Source: Hassan district at a glance Figures in parentheses indicate percentages chemical fertilizer, to draw meaningful inferences. Various dimensions were compared and contrasted with the help of frequency, average and percentage Growth rate analysis In order to analyze the growth in production and various aspects of consumption of fertilizer, the compound growth rate analysis was carried. The compound growth function was specified as follows. Y = ab t e u Y = Production/consumption a = Intercept t = Year b = 1 + r r = Growth rate
27 Table 3.6 List of sample villages in Hassan district Sl. No. Taluks Sl. No. Villages Number of respondents 1 Hassan 1 Salgame 10 2 Dasara koppalu 10 3 Kalkere hosur 10 4 Chikkagadurali 10 5 Tavavadevara koppalu 10 Subtotal 50 2 Alur 1 Himtipura 10 2 Kamtti 10 3 Nakalgod 10 4 Kanthur 10 5 Kumbarali 10 Subtotal 50 Total 100 To understand the influence of WTO on fertilizer consumption, the study period was divided into two sub-periods as pre WTO period ( ) and post WTO period ( ). Using the growth function, district-wise projections were made for 2007, 2008, 2009 and Regression analysis Multiple regression model was employed to study the factors influencing demand for chemical fertilizer. Linear regression model applied was Y = a 0 + a 1 X 1 + a 2 X a 8 X 8 + u
28 Where, Y = Total quantity of fertilizer purchased (kg) X 1 = Fertilizer price per unit including transport change (Rs./kg) X 2 = Area under crops in hectare X 3 = Proportion of area under irrigation X 4 = Proportion of area under paddy X 5 = Proportion of area under potato X 6 = Proportion of area under maize X 7 = Quantity of FYM applied (tonne/ha) X 8 = Dummy variable ( 1 for Hassan taluk, 0 for Alur taluk) u = Random error. The above function was also specified in non linear form as Y = a 1 X 1 a1 X 2 a2 X 3 a3.... X 8 a8 e u The price elasticity coefficients for fertilizer demand functions were computed.
29 4. RESULTS The results of the investigation and analysis are presented under the following heads. 4.1 Production of fertilizers in Karnataka 4.2 District wise consumption of fertilizers in Karnataka 4.3 General characteristics of the sample respondents 4.4 Pattern of consumption of chemical fertilizer by sample respondents 4.5 Chemical fertilizer demand function and demand projections 4.1 PRODUCTION OF FERTILIZERS IN KARNATAKA The average fertilizer production over the study period in the state is presented in Table 4.1. The average production of straight fertilizer during triennium period ( ) was tonnes and tonnes during the triennium period ( ). Thus it showed per cent decline in production of straight fertilizers. Whereas in the case of complex fertilizer, there was an increase of per cent in production. The average production was tonnes in and tonnes in The growth in production of chemical fertilizers is presented in Table 4.2. There was a positive and significant growth of 2.62 per cent per annum in the production of straight fertilizer during the pre WTO, while in the post WTO period the growth was 1.33 per cent but it was statistically non-significant. For the over all period, the production of straight fertilizer recorded a positive growth rate of 1.35 per cent per annum. While in the case of complex fertilizer, a negative but non-significant growth rate of 1.25 per cent during the pre WTO period was noticed. Growth rate turned to be positive (8.15%) and significant during the post WTO period. In the overall period, the growth in the production of complex fertilizer was positive (3.10%) and statistically significant at one per cent level Chemical fertilizer sale points in Karnataka Table 4.3 indicated the districtwise fertilizer sale points in Karnataka. At the state level, fertilizer sale points showed an increase of per cent between the two triennium periods. Most of the districts recorded an increase in the fertilizer sale points. Among the districts, the highest increase in the sale points was noticed in Gulbarga (105.93%) followed by Chitradurag (95.61%), Bijapur (76.47%) and Hassan (76.56%) districts. A decrease in the fertilizer sale points was recorded in Dharwad (-30.14%), Chikmagular (-17.39%), Dakshina Kannada (-15.80%), Shimoga (-10.50%) and Bidar (-2.07) districts. The district wise growth in fertilizer sales points is presented in Table 4.4. The state recorded a positive and significant growth of 1.42 per cent per annum during the over all period. Chitradurga recorded the highest positive growth rate of 4.73 per cent followed by Gulbarga (4.63%) and Hassan (4.55%) districts and these growth rates were statistically significant at one per cent probability level. A negative but non-significant growth rate was noticed in Chickmagalur (-0.34%), Dakshina Kannda (-1.21%), Dharwad (-3.52%) and Shimoga (-0.29%) districts. During the pre WTO period, most of the districts showed a positive significant growth rate. The state recorded a remarkable positive significant growth of 2.75 per cent per annum. Among the districts, Gulbarga recorded the highest growth rate of per cent per annum followed by Bijapur (9.20%) and Mandya (7.66%) districts. A negative but non-significant growth rate was noticed in Chickmagular (-4.72%), Dharwad (-5.86%), Kolar (-5.86%), Kodagu (-1.13%) and Raichur (-0.2%) districts. For the state as a whole a positive significant growth of 1.02 per cent per annum during the post WTO period was noticed. Most of the districts recorded a negative growth rate. The positive growth rate was noticed in Mysore (5.34%) and Dharwad (3.90%) districts. A negative but non-significant growth rate was observed in Bangalore (-4.7%), Bellary
30 Table 4.1. Average fertilizer production in Karnataka (tonnes) Sl. No. Type TE ( ) TE ( ) % change 1 Straight Complex Table 4.2. Growth in the production of chemical fertilizer in Karnataka Sl. No. Type CGR in % pa Pre WTO Post WTO Overall 1 Straight 2.62* 1.33 NS 1.35 NS 2 Complex NS 8.15* 3.10** ** Significant at 1 per cent level * Significant at 5 per cent level NS Non-significant (-2.05%), Bidar (-8.37%), Bijapur (-1.57%), Dakshina Kannda (-2.45%), Gulbarga (-0.42%), Mandya (-5.85%) and Shimoga (-1.86%) districts. Hence, it is clear that during the pre WTO period districts like Banglaore, Bellary, Bidar, Bijapur Dakshina Kannada, Gulbarga, Mandya and Shimoga recorded a positive growth which turned out to be negative growth during the post WTO period. Chickmagular, Dharwad, Kodagu and Raichur districts recorded a negative growth rate during the pre WTO while a positive growth performance was observed during the post WTO period in these districts. 4.2 DISTRICT WISE CONSUMPTION OF FERTILIZER IN KARNATAKA District wise consumption of NPK The district wise average consumption of NPK and that for the state as a whole is furnished in Table 4.5. It is evident from the table that between the two triennium periods all the districts witnessed an increase in the consumption of NPK. The highest increase in the average consumption of NPK was noticed in Gulbarga (290.04%) followed by Bijapur, Bidar and Kolar with the value of per cent, per cent and per cent state recorded an increase in the average consumption of NPK of per cent.
31 Table 4.3. District wise Average fertilizer sale points in Karnataka (in numbers) Sl. No. District TE ( ) TE ( ) % change 1 Bangalore Belgaum Bellary Bidar Bijapur Chikmagalur Chitradurga Dakshina Kannada Dharwad Gulbarga Hassan Kodagu Kolar Mandya Mysore Raichur Shimoga Tumkur Uttara Kannada State
32 Table 4.4 District wise growth in fertilizer sales points in Karnataka Sl. No. District CGR in % pa Pre WTO Post WTO Overall 1 Bangalore 5.43** NS 1.17 NS 2 Belgaum 3.56** 5.24 NS 1.41 NS 3 Bellary 3.61 NS NS 2.78** 4 Bidar 3.55** NS 1.29 NS 5 Bijapur 9.20** NS 3.71** 6 Chikmagalur NS 3.24 NS NS 7 Chitradurga 0.36 NS 5.59 NS 4.73** 8 Dakshina Kannada 0.22** NS NS 9 Dharwad NS 3.90* NS 10 Gulbarga 11.30** NS 4.63** 11 Hassan 4.67** 4.44 NS 4.55** 12 Kodagu NS 0.42 NS 0.19 NS 13 Kolar 3.18* 6.24 NS 1.50 NS 14 Mandya 7.66** NS 3.28** 15 Mysore 7.51** 5.34* 1.17 NS 16 Raichur NS 6.04 NS 0.99 NS 17 Shimoga 2.28** NS NS 18 Tumkur 3.99 NS 1.44 NS 3.36** 19 Uttara Kannada 0.91 NS 0.47 NS 0.58* 20 State 2.75** 1.02* 1.42** ** Significant at 1 per cent level * Significant at 5 per cent level NS Non-significant
33 Table 4.5. District wise average consumption of NPK in Karnataka (tonnes) Sl. No. District TE ( ) TE ( ) % Change 1 Bangalore Belgaum Bellary Bidar Bijapur Chikmagalur Chitradurga Dakshina Kannada Dharwad Gulbarga Hassan Kodagu Kolar Mandya Mysore Raichur Shimoga Tumkur Uttara Kannada State
34 Table 4.6. District wise growth in the consumption of NPK in Karnataka Sl. No. District CGR in % pa Pre WTO Post WTO Overall 1 Bangalore 7.34** 6.98** 5.66** 2 Belgaum 1.66 NS 15.22** 4.49** 3 Bellary 3.89 NS NS 4.85 NS 4 Bidar 4.01 NS 19.02** 5.74** 5 Bijapur 6.44* 16.63** 6.91** 6 Chikmagalur 5.55* 4.86 NS 5.48** 7 Chitradurga 7.74** 15.03** 6.71** 8 Dakshina Kannada 5.48* NS 0.59 NS 9 Dharwad 5.94** 7.09* 5.21** 10 Gulbarga 10.47* 14.32* 7.98** 11 Hassan 7.89** 5.68 NS 5.51** 12 Kodagu 3.44 NS 3.26 NS 4.65** 13 Kolar 9.52** 7.17** 6.92** 14 Mandya 1.98 NS 10.61** 2.11* 15 Mysore 4.03* 3.59 NS 4.68** 16 Raichur 6.98** 6.88** 5.78** 17 Shimoga 5.62** 1.51 NS 2.47** 18 Tumkur 8.76** 6.54** 6.28** 19 Uttara Kannada 6.81 NS 8.95 NS 4.34** 20 State 5.58** 8.16** 5.03** ** Significant at 1 per cent level * Significant at 5 per cent level NS Non-significant
35 Table 4.6 shows the district wise growth in the consumption of NPK in Karnataka. It could be noticed from the table that during over all period, the consumption of NPK fertilizer in the state showed a significant positive growth rate of 5.03 per cent per annum. A positive and significant growth rate at one per cent level was observed in almost all the districts except in Mandya district which is positive but significant at five per cent probability level. On the other hand, a non-significant but mild growth in consumption of NPK fertilizer was noticed in Bellary (4.85%) and Dakshina Kannada (0.59%) districts. Gulbarga recorded the highest growth rate of 7.89 per cent in consumption of NPK followed by Kolar (6.92%) and Bijapur (6.91%) districts during the study period. In the pre WTO period, the consumption of NPK in the state showed a significant positive growth of 5.58 per cent per annum and was statically significant at one per cent probability level. The highest positive and significant growth rate was recorded in Gulbarga (10.47%) followed by Kolar (9.52%), Tumkur (8.76%) and Hassan (7.89%) districts. The lowest growth rate was recorded in Belgaum (1.66%). In the post WTO period, positive growth performance was noticed for Bidar (19.02%), Belgaum (15.22%), Chitradurga (15.03%) and Gulbarga (14.32%) districts. At the state level, the consumption of NPK fertilizer accelerated with a growth rate of 8.16 per cent per annum and was statistically significant at one per cent probability level. On the other hand negative but non-significant growth rate of NPK consumption was noticed in Bellary (-1.06%) and Dakshina Kannda (-0.51%) districts. Thus, it can be observed that during the post WTO period Banglore, Bellary, Chickmagalur and Dakshina Kannada experienced a negative growth in the consumption while a positive but non-significant growth was noticed in Hassan, Kolar, Kodagu, Mysore and Shimoga districts District wise consumption of nitrogen fertilizer in Karnataka Table 4.7 furnish the district wise average consumption of nitrogen fertilizer. At the state level, the average consumption of nitrogen fertilizer increased by per cent between the two triennium periods. The highest increase in the consumption of nitrogen fertilizer was observed in Gulbarga (331.97%) followed by Kolar (212.46%), Chitradurga (193.73%) and Tumkur (191.50%) whereas Kodagu district witnessed a decline (-31.18%) in the consumption of nitrogen fertilizer. The district wise growth in consumption of nitrogen fertilizer in Karnataka is presented in Table 4.8. The table revealed that during the period under study, the consumption of nitrogen fertilizer in the state recorded a significant positive growth rate of 5.61 per cent per annum. Among the districts, the highest growth rate was recorded in Gulbarga (8.98%) followed by Kolar, Chitradurga and Tumkur districts with a respective growth rates of 8.11 per cent, 7.42 per cent and 7.26 per cent per annum. The lowest growth rate was noticed in Dakshina Kannada (0.52%). The table further revealed that during the pre WTO period all the districts recorded a positive growth rate in the consumption of nitrogen fertilizer. The state registered a significant positive growth rate of 5.86 per cent per annum. The highest positive growth rate was noticed in Gulbarga (11.14%) followed by Hassan, Kolar and Chitradurga, whereas Belgaum (2.23%) district recorded the lowest growth rate. The consumption of nitrogen fertilizer accelerated at 5.89 per cent per annum in the state during the post WTO period. Almost all the districts witnessed a positive growth rate. The highest growth rate was registered in Chitradurga (13.40%) district followed by Gulbarga (14.55%), Bidar (13.40%) and Bijapur (13.40%). A negative and non-significant growth was noticed in Dakshina Kannda (-2.50%) and Shimoga (-1.43%) districts. Hence it is clear from the table that Bangalore, Chickmagalur, Dakshina Kannada, Dharwad, Hassan, Kodagu, Kolar, Mysore, Shimoga, Tumkur and Uttar Kannada districts
36 Table 4.7 District wise average consumption of nitrogen in Karnataka (tonnes) Sl. No. District TE ( ) TE ( ) % Change 1 Bangalore Belgaum Bellary Bidar Bijapur Chikmagalur Chitradurga Dakshina Kannada Dharwad Gulbarga Hassan Kodagu Kolar Mandya Mysore Raichur Shimoga Tumkur Uttara Kannada State
37 Table 4.8. District wise growth in the consumption of nitrogen in Karnataka Sl. No. District CGR in % pa Pre WTO Post WTO Overall 1 Bangalore 6.35* 4.13* 5.71** 2 Belgaum 2.23* 11.98** 4.90** 3 Bellary 3.73 NS 5.79** 3.73** 4 Bidar 4.55 NS 13.40** 5.58** 5 Bijapur 4.55 NS 13.40** 5.58** 6 Chikmagalur 8.02** 2.85 NS 6.62** 7 Chitradurga 8.37** 18.66* 7.42** 8 Dakshina Kannada 2.45 NS NS 0.52 NS 9 Dharwad 6.35* 5.46* 6.46** 10 Gulbarga 11.14** 14.55** 8.98** 11 Hassan 10.86** 3.13 NS 6.88** 12 Kodagu 5.31* 2.16 NS 5.18** 13 Kolar 10.37** 5.59** 8.11** 14 Mandya 2.64 NS 8.25* 2.37** 15 Mysore 4.00 NS 2.25 NS 5.08** 16 Raichur 7.40** 5.05** 5.86** 17 Shimoga 5.62** NS 2.82** 18 Tumkur 8.42** 5.12* 7.26** 19 Uttara Kannada 7.83* 3.77 NS 5.32** 20 State 5.86** 5.89** 5.61** ** Significant at 1 per cent level * Significant at 5 per cent level NS Non-significant
38 recorded low growth rates during the post WTO period compared to those during the pre WTO period District wise consumption of phosphorus fertilizer in Karnataka The district wise consumption of phosphate fertilizer is illustrated in Table 4.9. The table revealed that most of the districts showed an increase in the consumption of phosphate fertilizer between the two periods. The average consumption of phosphorus fertilizer at the state level increased by per cent. Among the districts the highest increase in the phosphorus consumption was noticed in Gulbarga (260.53%) followed by Bijapur (259.42%), Dharwad (230.17%) and Bidar (211.59%) districts. A decrease in the average consumption of phosphate fertilizer was observed in Belgaum (-21.86%) and Chitradurga (-11.34%) districts. The district wise growth rate in the consumption of phosphorus fertilizer is presented in Table A positive and significant growth rate of 4.51 per cent per annum in the consumption of phosphorus fertilizer in the state was noticed during the study period. Almost all the districts, showed a positive growth except Dakshina Kannada district where the growth rate was negative. The highest positive growth rate was noticed in Bijapur followed by Gulbarga and Bidar districts. The lowest growth rate was observed in Mandya (0.49%) district. The growth rate in the consumption of phosphorus fertilizer was positive and significant (6.04%) in the state during the pre WTO period. The highest positive growth rate was noticed in Tumkur district (10.60%), followed by Bangalore (10.47%), Gulbarga (10.17%) and Kolar (9.79%) districts. Dakshina Kannda district showed the lowest growth rate of 1.00 per cent per annum. Further the table revealed that during the post WTO period, the state witnessed a remarkable positive and significant growth rate of per cent per annum. All the districts in Karnataka recorded positive growth rates except Bellary for which growth rate was per cent per annum. The highest growth in the consumption of phosphorus was observed in Bidar followed by Belgaum, Uttar Kannada and Bijapur districts District wise consumption of potash fertilizer in Karnataka The state recorded an increase in the average consumption of potash fertilizer by per cent between the two triennium periods (Table 4.11). Almost all the districts recorded increase in the consumption of potash fertilizer over the years. The highest increase in the average consumption of potash fertilizer was noticed in Bijapur (292.94%) followed by Gulbarga (237.34%), Bangalore (201.47%) and Bidar (178.12%) districts. The district wise growth in the consumption of potash fertilizer is furnished in Table It could be noted that during the study period almost all the districts recorded a positive growth rate. State recorded a positive and significant growth rate of 3.40 per cent per annum. Bijapur recorded the highest positive growth rate of 8.12 per cent per annum followed by Gulbarga (7.08%), Bangalore (6.16%) and Raichur (5.49%) districts. Table further illustrated that there was a non-significant but positive growth in most of the districts and also for the state during the pre WTO period. The positive significant growth rate was noticed in Dakshina Kannada (12.28%), Gulbarga (7.92%), Bangalore (7.16%), Chitradurga (6.93%) and Shimoga (5.72%) districts where as negative non-significant growth rate was noticed in Bidar (-7.75%), Belgaum (-3.38%) and Mandya (-0.63%) districts during the pre WTO period. The state during the post WTO period recorded a positive growth rate of which was statistically significant at five per cent level. All the districts except Dakshina Kannada registered a positive growth rate during the post WTO period. While for a Dakshina Kannada a negative but non-significant growth rate of 2.85 per cent per annum in consumption of potash fertilizer was recorded. A high positive significant growth rate was noticed in Bidar (27.54%), Mandya (25.94%), and Belgaum (22.25%) districts.
39 Table 4.9. District wise average consumption of phosphorus in Karnataka (tonnes) Sl. No. District TE ( ) TE ( ) % Change 1 Bangalore Belgaum Bellary Bidar Bijapur Chikmagalur Chitradurga Dakshina Kannada Dharwad Gulbarga Hassan Kodagu Kolar Mandya Mysore Raichur Shimoga Tumkur Uttara Kannada State
40 Table 4.10 District wise growth in the consumption of phosphorus in Karnataka Sl. No. District CGR in % pa Pre WTO Post WTO Overall 1 Bangalore 10.47** 12.41* 4.38** 2 Belgaum 3.16 NS 20.54* 4.15* 3 Bellary 3.70 NS NS 5.01 NS 4 Bidar 5.24 NS 26.23** 6.12** 5 Bijapur 9.40** 17.43** 7.94** 6 Chikmagalur 6.81* 6.56 NS 4.68 NS 7 Chitradurga 9.04** 12.22* 6.28** 8 Dakshina Kannada 1.00 NS 8.37* NS 9 Dharwad 5.58* 10.45* 5.23** 10 Gulbarga 10.17* 15.57* 7.14** 11 Hassan 7.15** 7.23 NS 3.99** 12 Kodagu 2.65 NS 4.77 NS 4.86** 13 Kolar 9.79** 11.38** 5.38** 14 Mandya 1.69 NS 6.54 NS 0.49 NS 15 Mysore 3.16 NS 8.11* 3.46** 16 Raichur 8.33** 7.60* 5.73** 17 Shimoga 5.19 NS 3.09 NS 1.99 NS 18 Tumkur 10.60** 7.52** 5.13** 19 Uttara Kannada 6.00 NS NS 4.97* 20 State 6.04** 11.87* 4.51** ** Significant at 1 per cent level * Significant at 5 per cent level NS Non-significant
41 Table District wise average consumption of potash in Karnataka (tonnes) Sl. No. District TE ( ) TE ( ) % Change 1 Bangalore Belgaum Bellary Bidar Bijapur Chikmagalur Chitradurga Dakshina Kannada Dharwad Gulbarga Hassan Kodagu Kolar Mandya Mysore Raichur Shimoga Tumkur Uttara Kannada State
42 Table 4.12 District wise growth in the consumption of potash in Karnataka Sl. No. District CGR in % pa Pre WTO Post WTO Overall 1 Bangalore 7.16** 20.65** 6.16** 2 Belgaum NS 22.25** 3.30 NS 3 Bellary 4.31 NS 5.23 NS 0.86 NS 4 Bidar NS 27.54** 4.07 NS 5 Bijapur 4.28 NS 25.19** 8.12** 6 Chikmagalur 0.11 NS 4.59 NS 3.59 NS 7 Chitradurga 6.93* 11.28* 4.10** 8 Dakshina Kannada 12.28** NS 2.30 NS 9 Dharwad 5.58 NS 4.34 NS 1.83 NS 10 Gulbarga 7.92* 6.50 NS 7.08** 11 Hassan 1.36 NS NS 4.46** 12 Kodagu 1.97 NS 2.96 NS 3.83** 13 Kolar 4.91 NS 9.19 NS 4.54** 14 Mandya NS 25.84** 2.30 NS 15 Mysore 5.43 NS 3.04 NS 4.99** 16 Raichur 2.22 NS 13.07* 5.49** 17 Shimoga 5.72** 6.74 NS 2.36** 18 Tumkur 5.73 NS 11.44* 4.87** 19 Uttara Kannada 4.69 NS NS 1.36 NS 20 State 3.65 NS 10.20* 3.40** ** Significant at 1 per cent level * Significant at 5 per cent level NS Non-significant
43 Belgaum, Bidar and Mandya districts which registered a negative growth rate during the pre WTO period recorded a positive growth during the post WTO period. For districts like Dakshina Kannada, Dharwad, Gulbarga and Mysore the rate of growth in potash consumption during post WTO period was less when compared to those during the pre WTO period District wise consumption of NPK during kharif season The district wise average composition of NPK is tabulated in Table All the districts of Karnataka noticed an increase in the consumption of NPK during kharif season. Among the districts, the highest increase in the consumption of NPK during kharif season was recorded in Gulbarga (276.29%), followed by Bijapur (189.79%) and Kolar (149.24%) districts. State recorded per cent increase in the consumption of NPK during kharif season. Table 4.14 shows the district wise annual growth in the consumption of chemical fertilizers (NPK) during kharif season. State withnessed a positive growth rate of 4.66 per cent per annum and it was statistically significant at one per cent probability level. All the districts showed a positive growth rate during the study period. The highest positive and significant growth rate was noticed in Gulbarga (7.97%) followed by Chitradurga (6.50%), Chikmagalur (6.41%) and Bijapur (6.37%). A mild positive growth in NPK consumption during kharif was observed in Dakshina Kannada (0.97%) district. A significant positive growth rate of 5.28 per cent was noticed at the state level during the pre WTO period. Kodagu district recorded a negative non-significant growth rate of 0.31 per cent where as all other districts in the state recorded a positive growth rate. The highest positive significant growth in the consumption of NPK during kharif season was noticed in Gulbarga (12.24%) followed by Chitradurga, Kolar and Tumkur districts. During the post WTO period, state recorded a positive growth rate of 7.04 per cent which was statistically significant at five per cent level. Chitradurga recorded the highest growth rate of per cent in consumption of NPK during kharif followed by Bijapur, Bidar and Belgaum districts. Bellary and Chitradurga districts withnessed a negative non-significant growth rate. The Kodagu district which recorded a negative growth rate during the pre WTO showed a positive growth during the post WTO period, whereas Bellary, Dakshina Kannada, Gulbarga, Kolar, Mysore, Shimoga and Tumkur districts witnessed low growth rates during the post WTO period compared to those during pre WTO period District wise consumption of chemical fertilizer (NPK) during rabi season The consumption of chemical fertilizer (NPK) during rabi season in Karnataka is presented in Table The state recorded per cent increase in the consumption of NPK during rabi. All the districts of Karnataka witnessed an increase in the consumption of NPK during rabi season. The highest increase in the consumption of NPK was noticed in Gulbarga (314.04%) followed by Bidar (276.74%), Bijapur (255.65%) and Tumkur (239.32%) district. Table 4.16 shows the district wise growth in the consumption of chemical fertilizer (NPK) during rabi season. During the study period, all the districts recorded positive growth rate. The state recorded a positive growth rate of 5.58 per cent and statistically significant at one per cent level. Gulbarga recorded the highest positive growth rate of 8.19 per cent per annum in consumption of NPK during rabi followed by Kolar (7.63%), Bijapur (7.63%) and Tumkur (7.49%) districts. During the pre WTO period the growth rate in the consumption of NPK during rabi was positive (6.07%) for the state. Kolar district withnessed the highest growth rate of per cent followed by Uttar Kannada (10.17%), Hassan (10.15%) and Kodagu (9.13%) districts. During the post WTO period but for Dakshina Kannada (-1.09%) and Kodagu districts (-2.81%) all the districts withnessed a positive growth in the consumption of NPK during rabi. The state recorded a remarkable growth of 9.73 per cent per annum and it was statistically significant at one per cent probability level. Bidar recorded the highest growth of per cent in consumption of NPK followed by Gulbarga, Belgaum and Bijpaur districts.
44 Table 4.13 District wise average consumption of chemical fertilizer (NPK) during kharif in Karnataka (tonnes) Sl. No. District TE ( ) TE ( ) % Change 1 Bangalore Belgaum Bellary Bidar Bijapur Chikmagalur Chitradurga Dakshina Kannada Dharwad Gulbarga Hassan Kodagu Kolar Mandya Mysore Raichur Shimoga Tumkur Uttara Kannada State
45 Table 4.14 District wise growth in the consumption of chemical fertilizer (NPK) during kharif in Karnataka Sl. No. District CGR in % pa Pre WTO Post WTO Overall 1 Bangalore 7.69** 9.42** 5.43** 2 Belgaum 0.85 NS 12.60* 3.39** 3 Bellary 3.77 NS NS 4.57 NS 4 Bidar 4.84* 13.38** 5.58** 5 Bijapur 6.28* 14.99** 6.37** 6 Chikmagalur 5.56 NS 6.49 NS 6.41** 7 Chitradurga 9.29** 18.36** 6.50** 8 Dakshina Kannada 4.32 NS NS 0.97 NS 9 Dharwad 5.93* 4.49 NS 4.54** 10 Gulbarga 12.24* 10.65* 7.97** 11 Hassan 6.89** 7.15* 5.60** 12 Kodagu NS 6.30 NS 4.43** 13 Kolar 8.72** 5.09** 6.26** 14 Mandya 1.48 NS 8.26* 2.35* 15 Mysore 4.28 NS 3.01 NS 4.29** 16 Raichur 6.71** 6.17* 5.25** 17 Shimoga 5.60** 1.94 NS 2.89** 18 Tumkur 8.03* 2.68 NS 5.53** 19 Uttara Kannada 5.22 NS 8.42 NS 4.45** 20 State 5.28** 7.04* 4.66** ** Significant at 1 per cent level * Significant at 5 per cent level NS Non-significant
46 Table 4.15 District wise average consumption of chemical fertilizer (NPK) during rabi in Karnataka (tonnes) Sl. No. District TE ( ) TE ( ) % Change 1 Bangalore Belgaum Bellary Bidar Bijapur Chikmagalur Chitradurga Dakshina Kannada Dharwad Gulbarga Hassan Kodagu Kolar Mandya Mysore Raichur Shimoga Tumkur Uttara Kannada State
47 Table 4.16 District wise growth in the consumption chemical fertilizer (NPK) during rabi in Karnataka Sl. No. District CGR in % pa Pre WTO Post WTO Overall 1 Bangalore 6.86** 5.03 NS 5.89** 2 Belgaum 3.12* 19.03** 6.30** 3 Bellary 4.05 NS 8.52** 3.70** 4 Bidar 2.85 NS 35.19* 5.81* 5 Bijapur 6.66* 18.53** 7.56** 6 Chikmagalur 5.58* 1.30 NS 3.55** 7 Chitradurga 6.98* 11.22* 7.01** 8 Dakshina Kannada 6.96** NS 0.02 NS 9 Dharwad 6.04* 13.91* 6.96** 10 Gulbarga 8.27* 21.89* 8.19** 11 Hassan 10.15** 2.44 NS 5.15** 12 Kodagu 9.13** NS 4.74** 13 Kolar 10.36** 9.42* 7.63** 14 Mandya 2.58 NS NS 1.70 NS 15 Mysore 3.68 NS 4.10** 5.11** 16 Raichur 7.32** 7.59** 6.34** 17 Shimoga 5.59* 0.51 NS 1.60 NS 18 Tumkur 9.88** 13.28** 7.49** 19 Uttara Kannada 10.17* NS 3.74 NS 20 State 6.07** 9.73** 5.58** ** Significant at 1 per cent level * Significant at 5 per cent level NS Non-significant
48 Bangalore, Chikmagalur, Dakshina Kannada, Hassan, Kodagu, Kolar and Shimoga districts showed low growth rates during the post WTO period compared to those during the pre WTO period Seasonwise consumption of chemical fertilizer in Karnataka The seasonwise consumption of fertilizer is presented in Table The table indicated change in the consumption of the chemical fertilizer between the two triennium periods. In kharif season, nitrogen fertilizers consumption increased by 116.8% between the two periods. In rabi season also the highest change in consumption was noticed in nitrogen with per cent. Over the seasons the total consumption of nitrogen increased by per cent while for the phosphorus it was per cent and for potash the change was per cent District wise per hectare consumption of NPK in Karnataka The details of per hectare consumption of NPK are presented in Table It is evident from the table that the state registered per cent increase in the per hectare consumption of NPK. Among the districts, Bangalore, Bidar, Bijapur, Chikmagalur, Chitradurga, Dakshina Kannada, Dharwad, Gulbarga, Kodagu, Kolar, Mysore, Raichur and Uttar Kannada showed the above state average, whereas district like Belgaum, Bellary, Hassan, Mandya, Shimoga and Tumkur showed the below state average. The district wise per hectare growth rates in the consumption of NPK in Karnataka are tabulated in Table For the overall period, the per hectare consumption of NPK recorded a significant positive growth rate at the state level and the same was true for all the districts. The state registered a positive growth rate of 4.71 per cent per annum. Among the districts, the highest positive growth in the per hectare consumption of NPK was observed in Bangalore (14.17%) followed by Raichur (10.96%), Bijpuar (10.75%) and Dharwad (10.65%) districts. A significant positive growth rate of 4.75 per cent in the per hectare consumption of NPK was noticed for the state during the pre WTO period. Bangalore district recorded the highest positive growth rate of per cent per annum followed by Gulbarga (10.45%), Kolar (7.83%) and Raichur (7.51%) districts. During the post WTO period all the districts and state recorded a positive growth rate. State withnessed a positive growth rate of 8.84 per cent and statistically significant at one per cent level. The highest positive significant growth rate was noticed for Dharwad (38.17%) followed by Raichur (26.67%), Bijapur (26.45%) and Belgaum (18.85%) districts. Thus, during the post WTO period the low growth rates were observed in Bangalore, Belgaum, Gulbarga, Kolar and Tumkur when compared to those during the pre WTO period Consumption of different fertilizer in Karnataka The changes in the consumption of fertilizer material is present in Table There was an increase in the consumption of fertilizer materials in Karnataka over the period except in the case of CAN. The CAN consumption decreased by per cent. The highest change in the consumption was noticed in ammonium chloride (704.53%) followed by 20:20:00 (234.49%), 10:26:26 (203.5%) and urea (141.57%). The growth rates in the consumption of fertilizer materials in Karnataka are presented in Table During the study period most of the fertilizer materials recorded a positive growth rate except CAN. Among the materials ammonium chloride registered the highest growth rate of per cent per annum followed by 20:20:00, DAP and MOP. Further during the pre WTO period the positive significant growth rate was noticed in the consumption of urea (7.45%), ammonium chloride (12.36%) and 20:20:00 (5.62%). A negative non-significant growth rate was noticed in SSP (-7.20%), MOP (-7.50%) 16:20:20 (- 3.42%), ammonium sulphate (-1.50%), 15:15:15 (-1.19%) and CAN (-0.53%). During the post WTO period, almost all the materials except CAN recorded a positive growth rate. The highest positive growth was noticed in the consumption of urea (35.42%) followed by ammonium chloride (35.02%), SOP (13.27%) and MOP (12.76%).
49 Table 4.17 Seasonwise average consumption of chemical fertilizer in Karnataka (tonnes) Kharif Rabi Total TE ( ) N TE ( ) % change TE ( ) P TE ( ) % change TE ( ) K TE ( ) % change Thus, during the post WTO period 19:19:19 rock phosphate and DAP recorded a slow growth when compared to those during the pre WTO period and all other materials recorded a relatively higher growth during the post WTO period. 4.3 GENERAL CHARACTERISTICS OF THE SAMPLE RESPONDENTS The general characteristics of the sample farmers is presented in Table The study covered 50 respondents each from Hassan and Alur taluks spread over Hassan district. Majority of the sample respondents (54.00%) from Hassan taluk belonged to old age group of above 50 years, while per cent of them belonged to middle age group (35-50 years) and only few farmers (4.00%) belonged to younger age group. In Alur taluk, per cent of the farmers belonged to middle age group while per cent and 8.00 per cent of them belonged to old and younger age groups, respectively. For the district as a whole, per cent of the sample farmers belonged to a middle age group, about 46 per cent of them belonged to a old age group and only 6 per cent of them belonged to younger age groups. About per cent of the farmers in Hassan taluk studied upto high school, while per cent, 8.00 per cent and 6.00 per cent of the respondents respectively studied upto middle school, college and primary school level and per cent of them were found to be illiterates. In the case of Alur taluk, per cent of them had high school education while per cent of them had primary education, per cent of then had middle school education and about per cent of them were illiterates. In the district, per cent of the sample farmers had primary education, per cent of them had high school education, per cent of them had middle school, 5.00 per cent of them had college education and remaining per cent of them were illiterates.
50 Table 4.18 District wise average consumption of NPK per gross cropped area in Karnataka (kg/ha) Sl. No. District TE ( ) TE ( ) % change 1 Bangalore Belgaum Bellary Bidar Bijapur Chikmagalur Chitradurga Dakshina Kannada Dharwad Gulbarga Hassan Kodagu Kolar Mandya Mysore Raichur Shimoga Tumkur Uttara Kannada State
51 Table 4.19 District wise growth in per hectare consumption (NPK) in Karnataka Sl. No. District CGR in % pa Pre WTO Post WTO Overall 1 Bangalore 28.33** 5.04 NS 14.17** 2 Belgaum 0.95 NS 18.85** 4.71** 3 Bellary 2.33 NS 11.63** 3.32** 4 Bidar 2.03 NS 18.05** 4.16** 5 Bijapur 6.20** 26.45** 10.75** 6 Chikmagalur 4.04 NS 8.96** 5.78** 7 Chitradurga 6.35** 18.69** 7.48** 8 Dakshina Kannada 4.99* 15.79** 4.13** 9 Dharwad 4.22 NS 38.17** 10.65** 10 Gulbarga 10.48** 9.61* 6.68** 11 Hassan 6.58** 6.32* 4.78** 12 Kodagu 3.90 NS 8.55 NS 7.03** 13 Kolar 7.83** 6.57* 6.01** 14 Mandya 1.73 NS 6.04 NS 2.76** 15 Mysore 3.93* 19.91** 7.36** 16 Raichur 7.51** 26.67** 10.96** 17 Shimoga 4.41** 9.29** 3.96** 18 Tumkur 6.35 NS 2.27 NS 3.52* 19 Uttara Kannada 6.05 NS NS 4.25** 20 State 4.75** 8.84** 4.71** ** Significant at 1 per cent level * Significant at 5 per cent level NS Non-significant
52 Table 4.20 Average consumption of different fertilizers in Karnataka (tonnes) Sl. No. Fertilizers TE ( ) TE ( ) % change 1 Urea Ammonium sulphate Calcium ammonium nitrate Ammonium chloride Muriate of potash Sulphate of potash :19: :17: :15: Single super phosphate Rock phosphate :20: Diammonium phosphate :20: :26: The average family size in the case of Hassan taluk was 5.8 members while in Alur taluk it was 5.92 members and for the district it was 5.86 members. The family type in both the taluks was nuclear family (90%). The land holding of the sample farmers is presented in Table For the sample farmers of Hassan taluk per cent of land is under rainfed, per cent of land is under irrigated and only 1.42 per cent of the land is under garden. The total area of all the sample farmers Hassan taluk was 77.3 hectare. In the case of the sample farmers of Alur taluk, per cent of land is under rainfed, per cent land is under irrigated and about 0.22 per cent is under garden. The average area of the sample farmers in Alur taluk was 1.57 hectares, while for the sample farmers of the district, per cent of land was under rainfed per cent of area is under irrigated and only 0.83 per cent land is under garden. The average size of holding for sample farmers of the area of district was 1.56 hectares. The cropping pattern of the sample respondents in the study area is presented in Table It is evident from the table that the average gross cropped area of Hassan taluk sample farmers was 1.81 ha. The area under kharif crops was 1.44 ha (63.20%). Rabi crops occupied an area of 0.63 ha (34.59%) and summer crops covered an area of 0.04 ha (2.21%). In Alur taluk, the gross cropped area was 1.83 ha. Kharif crops occupied an area of 1.15 ha (62.73%), rabi crops covered an area of 0.65 ha (35.63%) and summer crops occupied an area of 0.03 ha (1.64%). The average gross cropped area of the district was 1.96 ha. kharif, rabi and summer crops occupied an area of 1.3 ha (63.00%), 0.63 ha (35.06%) and 0.03 ha (1.94%) respectively.
53 Table 4.21 Growth in consumption of different fertilizers in Karnataka Sl. No. Fertilizers CGR in % pa Pre WTO Post WTO Overall 1 Urea 7.45** NS 5.29 NS 2 Ammonium sulphate NS 7.41* 2.46* 3 Calcium ammonium nitrate NS NS NS 4 Ammonium chloride * 15.79** 5 Muriate of potash NS 12.76* 5.36 NS 6 Sulphate of potash 0.45 NS 13.27* 1.14 NS 7 19:19: NS 0.58 NS 1.53 NS 8 17:17: NS 2.73 NS 2.39 NS 9 15:15: NS 8.63* 0.62 NS 10 Single super phosphate NS 6.40 NS 0.26 NS 11 Rock phosphate 5.98 NS 2.97 NS 3.41 NS 12 16:20: ** 4.92** 13 Diammonium phosphate NS 3.18 NS 6.70 NS 14 20:20: * 5.93 NS 9.29** 15 10:26: NS 32.70** 4.60* ** Significant at 1 per cent level * Significant at 5 per cent level NS Non-significant
54 Table 4.22 General characteristics of the sample farmers Sl. No. Particulars Frequency Hassan Alur Overall Per cent Frequency Per cent Frequency Per cent 1. Sample Size Age group <35 years (young age) years (middle age) > 50 years (old age) Average age of the farmers(yrs) Education Illiterate (0) Primary (1-4) Middle (5-7) High (8-10) College (>10) Family type Nuclear Joint Average size of family (No)
55 Table Land holdings of the sample farmers (Area in ha) Sl. No. Particulars Hassan Alur Overall Total area Average Per cent Total area Average Per cent Total area Average Per cent 1 Irrigated area Rainfed area Garden Total
56 Table 4.24 Cropping pattern of the sample farmers (Area in ha) Sl. No. Particulars Hassan taluk Alur taluk Overall Total area Average Per cent Total area Average Per cent Total area Average Per cent 1 Kharif Rabi Summer Gross cropped area Cropping intensity
57 4.4 PATTERN OF CONSUMPTION OF CHEMICAL FERTILIZERS BY SAMPLE RESPONDENTS Crop wise per hectare fertilizer consumption in the study area is given in Table It is evident from the table that in Hassan taluk the per hectare consumption of total nitrogen was kg and average per hectare consumption was kg.the highest quantity of nitrogen was applied to sugarcane ( kg/ha) followed by paddy ( kg/ha), maize (98.28 kg/ha) and potato (92.93 kg/ha). The share of sugarcane, potato, maize and paddy in the total phosphorus consumption was per cent, per cent and per cent and The total and average per hectare phosphorus consumption in Hassan was kg and kg. In the case of potash fertilizer, sugarcane, potato, paddy, maize, sunflower and other crops respectively shared per cent, per cent, per cent, per cent, 8.25 per cent and 7.68 per cent of total consumption. The total NPK consumption per hectare in Hassan taluk was kg while the average consumption was kg. Among the crops, sugarcane accounted for the highest share per cent followed by paddy (17.38%), potato (17.17%), and maize (14.94%). Sugarcane accounted for the highest share of nitrogen (29.91%) followed by paddy (22.12%), maize (13.23%) and potato (12.80%) in Alur taluk. In the case of phosphorus fertilizer, the highest share was accounted by sugarcane (19.83%) followed by maize, potato and paddy with per cent, per cent, per cent of phosphorus consumption. In the case of potash fertilizer, sugarcane (21.97%) followed by potato (21.92%), paddy (18.37%) and maize (16.61%) took the major share. The total (NPK) fertilizer consumption per hectare in Alur taluk was kg the average consumption was kg in which sugarcane took the highest share (25.17%) followed by paddy (19.28%), potato (16.57%) and maize (15.51%). The total (NPK) fertilizer consumption for Hassan district as a whole was kg and average per hectare was kg. Maximum fertilizer was applied to sugarcane (27.33%) followed by paddy (18.19%), potato (16.90%) and maize (15.14%). Thus, the farmers in the study area apply most of the fertilizers to the crops like sugarcane, paddy, potato and maize (Fig. 4.1). The season wise consumption of fertilizer (kg/ha) is presented in Table The per hectare nitrogen consumed during kharif was kg during rabi was kg and during summer it was kg was consumed. In the case of phosphorus kg was consumed during kharif, kg during rabi and kg was consumed in summer making a average per hectare consumption of kg. The average per hectare consumption of potash was kg. It was kg during kharif, kg in rabi and 7.12 kg in summer. The total average per hectare consumption of NPK in Hassan taluk was kg. In Alur taluk average per hectare consumption of total NPK was kg. The average of kg, kg and kg of N was consumed in kharif, rabi and summer. In case of phosphorus kg, kg and 7.63 kg was consumed during kharif, rabi and summer making a average per hectare consumption of kg. Similarly the case of potash kg, kg and 4.82 kg was consumed during kharif, rabi and summer making on average consumption of kg. The average per hectare fertilizer consumption for the district was kg which was made up of kg in kharif, kg in rabi and kg in summer. The average per hectare consumption of N was kg. The N consumption during kharif, rabi and summer and kg, kg was kg respectively. In the case of phosphorus the average consumption was kg of which the consumption during kharif, rabi and summer was kg, kg and kg respectively. Similarly in the case of potash the average per hectare consumption was kg of which consumption of during kharif was kg, rabi (11.14 kg) and summer (5.97 kg).
58 Table Crop wise fertilizer consumption pattern on sample farmers (kg/ha) Crops Potato (13.22) Maize (13.98) Ragi (6.68) Paddy (19.76) Sugarcane (33.71) Sunflower (5.24) Other (7.41) Total (100) Hassan taluk Alur taluk Overall N P K Total N P K Total N P K Total (19.96) (19.76) (6.44) (13.07) (21.66) (7.73) (11.35) (100) (21.59) (10.91) (5.41) (17.87) (28.28) (8.25) (7.68) (100) (17.17) (14.94) (6.81) (17.38) (28.94) (6.67) (8.61) (100) (12.80) (13.23) (6.73) (22.17) (29.91) (5.83) (9.33) (100) (18.29) (18.47) (6.88) (15.09) (19.83) (8.96) (12.48) (100) (21.92) (16.61) (3.89) (18.37) (21.97) (8.63) (8.60) (100) (16.57) (15.51) (6.07) (19.28) (25.17) (7.59) (10.02) (100) (13.04) (13.66) (6.70) (20.79) (32.09) (5.49) (8.23) (100) (19.27) (19.24) (6.62) (13.91) (20.90) (8.24) (11.62) (100) (21.73) (13.41) (4.75) (18.09) (25.51) (8.42) (8.09) (100) (16.90) (15.18) (6.21) (18.19) (27.33) (6.98) (9.21) (100) Average Figures in parentheses indicates percentage

59 Fig Crop wise fertilizer consumption pattern on farms
60 Table Season wise consumption of fertilizers (kg/ha) Hassan taluk Alur taluk Overall Season N P K Total Per cent N P K Total Per cent N P K Total Per cent Kharif Rabi Summer Average

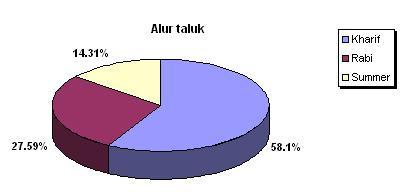
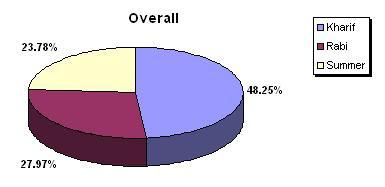
61 Fig.4.2. Season wise consumption of fertilizers on sample farmers