Herd Improvement Roadshow Presented by: Greg Hamill
|
|
|
- Clementine Anderson
- 5 years ago
- Views:
Transcription

1 Herd Improvement Roadshow 2017 Presented by: Greg Hamill
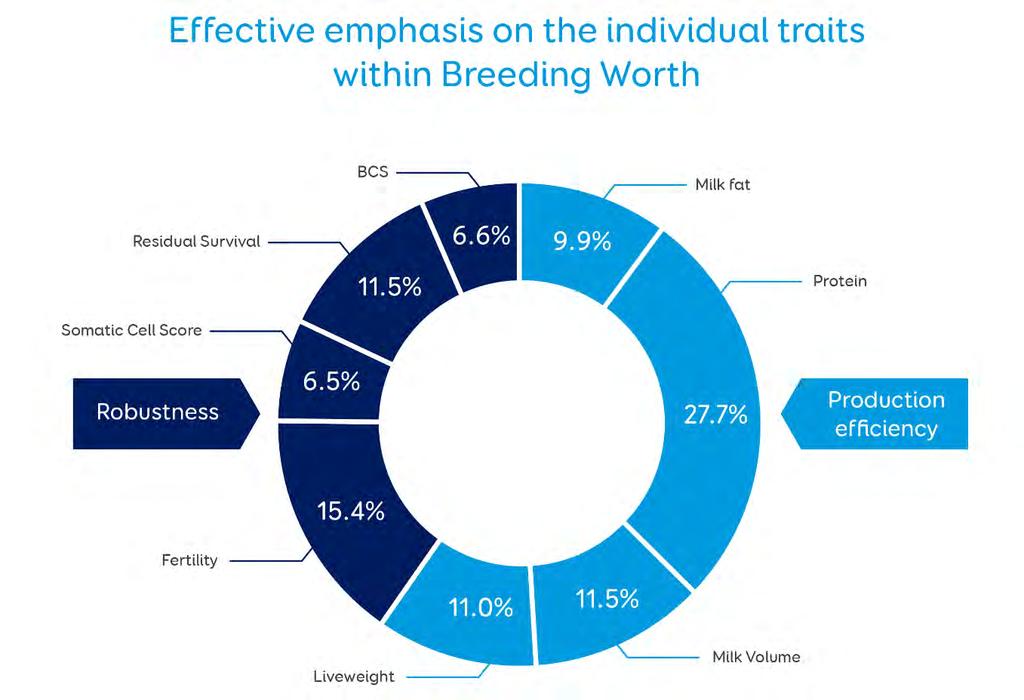
2 Our National Breeding Objective Revenue Cost Protein Fat Fertility Body Condition Survival Volume Somatic cells Liveweight


3 Liveweight 50kg = 1 bale silage for maintenance 500 kg cow requires 10 bales 600 kg cow requires 12 bales Liveweight is a key component of efficiency (kg s out compared to Kg s in)

4 Our Dairy Industry ,997, ,018, ,922, ,784, ,634, ,528, ,396, ,252, ,012,867 The average cow is now producing 100Kg/MS more than what she was 20 years ago ,916, ,832, ,867, ,851, ,740, ,692, ,485, ,269, ,289, ,222, ,064, ,935,759 Historically the national cow population has increased by 100,000 cows per year for the last 20 years ,830,977

5 Spotlight on cow quality 160Kg

6 Bob s herd On average the difference between the top quartile and bottom quartile is 160 kg / milksolids


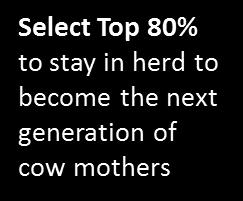
7 The next generation Are we guilty of rearing too many replacements from poorer cows? Breed the best Feed the best Milk the best Hope 4 the best


8 What can you control? 142 Passion. Action. Cadence. Excellence.

9 Identifying your quartiles Breed the best Feed the best Milk the best Hope 4 the best
10 What s a BW unit worth in MS? Protein 1.11 kg/year Fat 1.04 kg/year $11 BW = 2.15 kg/ms/year Breed the best Feed the best Milk the best Hope 4 the best

11 How we describe our cows Functional Fertile Health Efficient Capacious High Components PROFITABLE

12 Lincoln case study Make money out of milk, not milk out of money Highly profitable Industry involvement Information available


13 Lincoln case study Research shows that high BW herds deliver higher outputs with lower costs per Kg milksolids when compared to low BW herds.
14 Lincoln case study Profitability / Hectare Premier Sires F9< Friesian, F10> KiwiCross Bottom 10% of herd to Hereford Yearling matings (10 days earlier) No intervention policy Heifers grown to target liveweight 670 cows /reduced to 560 (lift residuals /grass quality) Kg s MS increased from kg MS/cow 2.53 kg/ms peak Weekly farm walks Condition scoring/weighing Make money out of milk, not milk out of money

15 Lincoln case study Up to Phase 1 Phase 2 Phase 3 Hectares Herd size Cows/Hectare Kg Liveweight / ha Kg MS / cow Kg MS / Ha Total MS 266, , ,200 Kg N applied / ha Purchased supplements fed / cow

16 Lincoln case study Make money out of milk, not milk out of money
17 High Input Herds Make money out of milk, not milk out of money

18 High Input Herds Make money out of milk, not milk out of money
19 High Input Herds Make money out of milk, not milk out of money BW 124/2 PW 234/-19

20 Australia

21 Take home message Your herd your making Identify your robbers Breed from your best cows cull your poor performers Don t ever compromise on your genetics

22 Reproduction- Driving Profitability And Productivity Joyce Voogt Technical Manager, LIC


23 Reproduction Central To Optimising The Conversion of Feed to Profit Initiates lactation Impacts lactation length Provides the next generation
24 Reasons for Culls in NSW: 20% reproductive failure 32% low production Creating An Efficient Herd Herd Improvement Fundamentals
25

26 Genotype Heritability low at 9% Considerable phenotypic variation Impact of correlated traits (high volume)
27 So, by using LIC genetics farmers can expect more fertile cows because: BW includes a 15.4% weighting for fertility BW rates milk volume per se as a negative value In addition our sire selection teams remove much of the phenotypic variation risk in the genetics side of things by choice of sires Dams of sires must get pregnant every year Overseas genetics are filtered through the progeny test scheme to make sure they are fertile. Daughters of these sires must be fertile in our conditions before they can be used as sires of sons Most of the factors affecting fertility are within the farmer s control
28 Heterosis effects NZHF X NZJ Trait Impact of Heterosis Milkfat +4.7% Protein +4.6% Milk volume +4.2% Live weight +2.1% Cow fertility +5.2% Somatic Cell Count -4.1% (favourable) Days of herd life +13.5%
29 Heterosis effects Dam (breed 16ths) Sire (breed 16ths) F16J0 F12J4 F8J8 F2J12 F0J16 F0J F4J F8J F12J F16J
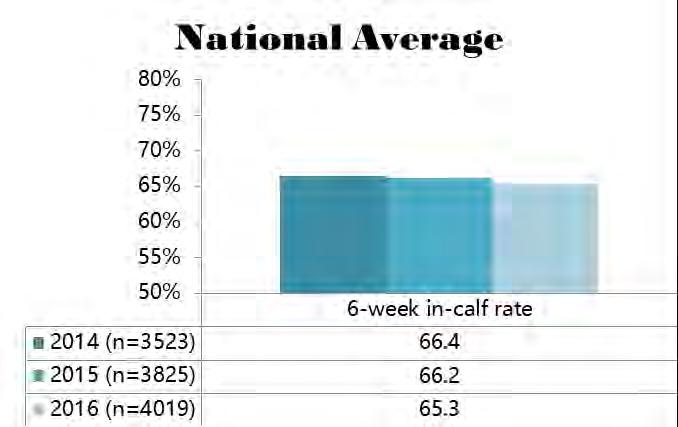
30 6 Week In-Calf Rate Empty Rate

31 Distribution Of Actual 6 Week In-Calf Rate 2014/15 Season

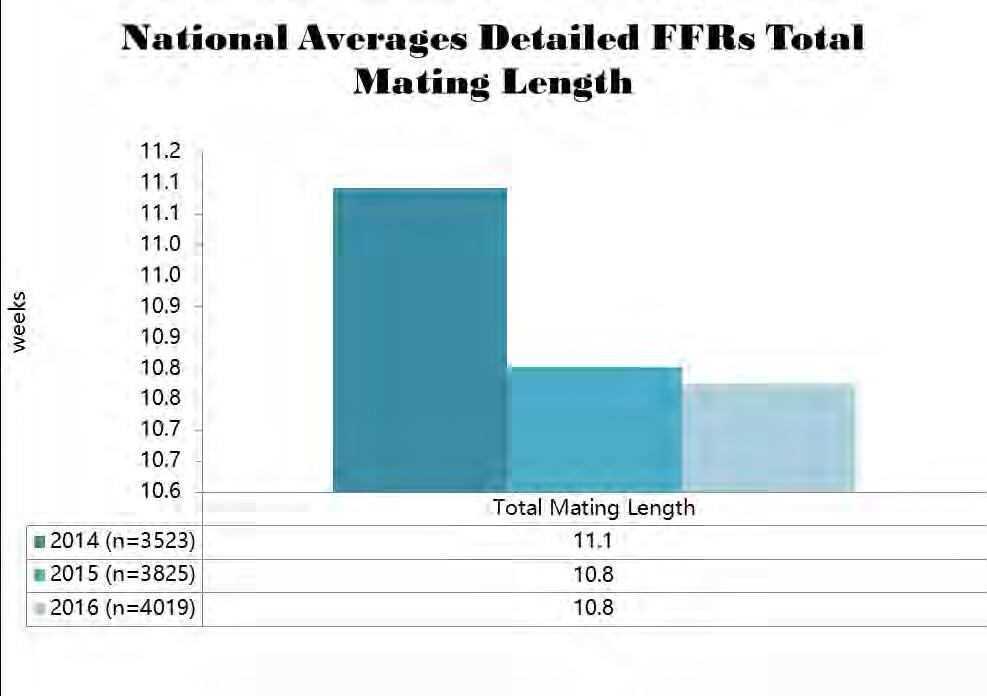
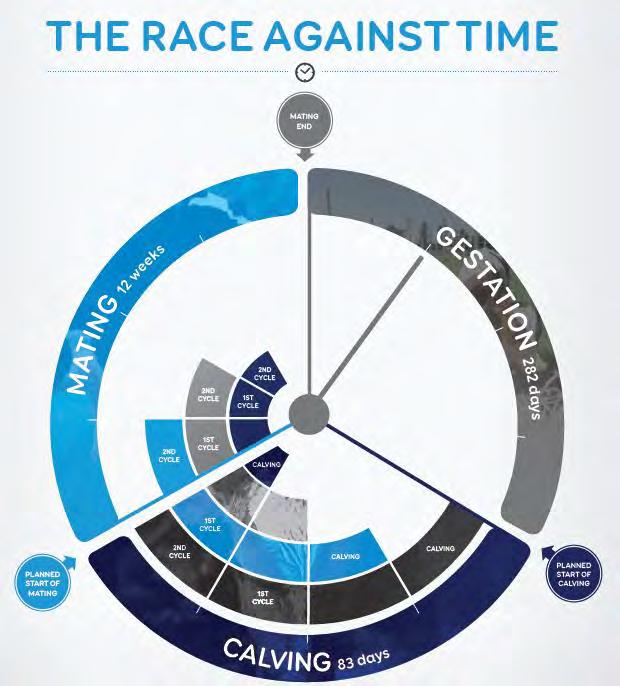
32 Mating Length And Empty Rate Adapted from the expected empty rate (%) given 6-week in-calf rate and length of mating table The InCalf Book (page 127)
33 Why the variation in performance? Phenotype = Genotype + Environment Heritability (h²) of fertility = 9%. i.e Low but strain differences exist for HF Environment is huge! Explains 91% of the variation What do we need to do to optimise the environment for the genetics we breed to maximise fertility?
34 NZ 2016 Fertility Performance herds Seasonal Calving Herds (n=4005) Recording in MINDA 2016 season 6 Week In Calf Rate Not In Calf Rate 3wk Submission Rate Conception Rate Upper Quartile nd Quartile rd Quartile Lower Quartile
35
36 Value of Improved Fertility Seasonal Calving Herds (n=4005) Recording in MINDA 2016 season 6 Week In Calf Rate Not In Calf Rate 3wk Submission Rate Conception Rate Upper Quartile nd Quartile rd Quartile Lower Quartile week ICR difference value = 400x$4x20% =$32,000 Empty rate difference value = 400 x$10x9% =$36,000 $68,000 profit difference Calculations using DairyNZ InCalf gap calculator


37 In-Calf Rate

38 Achieving High Reproductive Performance On Farm
39 Achieving High Reproductive Performance On Farm Aim for
40

41 Breeding The Efficient Herd Calving Pattern Impacts
42 ²)


43 Creating An Efficient Herd Herd Improvement Fundamentals