Corn, Hay, Wheat & Cattle Outlook
|
|
|
- Britney Neal
- 5 years ago
- Views:
Transcription


1 Corn, Hay, Wheat & Cattle Outlook Stephen R. Koontz Associate professor & extension economist Department of Agricultural & Resource Economics Colorado State University October, 1
2 April Cumulative Rainfall May Cumulative Rainfall June Cumulative Rainfall July Cumulative Rainfall 2


3 August Cumulative Rainfall Daily Harvest Corn Contract Outline Weekly S&P 500 Index Contract Economic Outlook Corn & Forage Cattle & Beef Inputs & Land Values Domestic Economy, Trade, & Demand Short term & Long term Price Outlook Management Strategies 3


4 Daily Crude Oil Futures Contract Price Commodity Market Outlook Summary Corn Needs two enormous crops. Hay Impacted by drought and corn. Cattle Current demand & long term supply. Oilseeds Depends on acres, exports to China & South American weather. Wheat Reduced world supplies & drought. Dairy Strong liquidation & coming volatility. Inputs Modest increases except land. 4


5 Corn Outlook Short term & Long term Price Outlook Market peaked & will soften from now to spring. Strong but weakening basis. Very poor moisture conditions for next year. Acreage & other issues for next year. Management Strategies Hand to mouth purchases. Aggressive sales. DEC12 $7.25 MAR13 $7.00 DEC13 $6.00 5
6 6


7 Weekly Corn Contract The trading range for corn was $3.50-$6.00/bu. Except $8.00 $5.00 7
8 8
9 9

10 DEC Corn Contract The $7.90/bu average farm price is at top of my forecasted range based on DEC $7.37/bu. Market peaked? Yes, maybe. 10
11 11


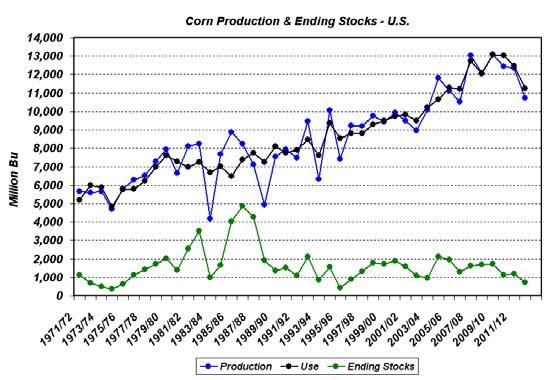
12 DEC 2013 Corn Contract DEC 2014 Corn Contract Forecast $ /bu Forecast $5.00/bu Corn Outlook A three year drought market. Moisture conditions are not good for next crop. Acreage response to this year? Hand to mouth purchases and aggressive sales. Structural change for livestock? Price outlook $5.00 $8.50/bu. until two big crops. $6.00/bu. 12
13 U S ALL HAY SUPPLY & DISAPPEARANCE Crop Year U S ALL HAY STOCKS May 1 (Beginning of Crop Year) Mil. Tons Mil. Tons Hay Supply Disap G-NP-20 G-NP-21 08/10/12 08/10/12 Data Source: USDA-NASS, Compiled & Forecasts by LMIC Data Source: USDA-NASS, Compiled & Forecasts by LMIC 13
14 Mil. Tons U S ALL HAY STOCKS December Data Source: USDA-NASS, Compiled & Forecasts by LMIC G-NP-22 08/10/12 50% -34% -2% 417% Data Source: USDA-NASS PERCENT CHANGE MAY 1 HAY STOCKS (-) 150% 143% -13% 19% 10% -49% 20% U.S. hay stocks down >10%. 36% 30% -20% -62% -35% -58% 11% -18% 20% -14% -18% 32% -21% -6% -27% 50% 124% -23% -3% -4% 46% -11% -27% 83% -10% 44% -36% -7% 52% VT -6% NH 117% MA 50% RI 0% CT 0% NJ -29% DE 33% MD 23% -100% to -18% -18% to 2% 2% to 44% 44% to 517% 5/10/ ALL HAY ACRES (1000 Acres) PERCENT CHANGE ALL HAY ACRES (-2010) 780-7% VT 175 NH 53 MA 74 RI 9 CT 60 NJ 105 DE 15 MD to to to to to % -1% -8% -6% -4% -6% 9% 1% -11% -10% U.S. hay acres down >5%. -3% -1% -8% -29% -6% -22% -4% -4% -3% 0% -5% -3% 1% -10% 0% 3% 3% -2% -9% -4% -10% -5% -4% 3% -17% -9% 3% -19% -4% -100% to -9% -9% to -5% -5% to -3% -3% to 2% 2% to 14% VT -10% NH -5% MA -4% RI 13% CT 2% NJ 0% DE 0% MD 2% Data Source: USDA-NASS 5/10/ Data Source: USDA-NASS 5/10/ 14
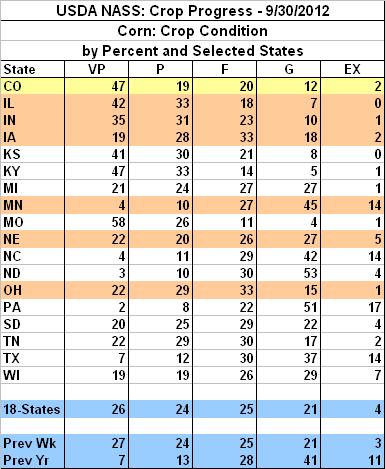
15 Percent US RANGE AND PASTURE CONDITION Percent Poor and Very Poor, Weekly Percent WESTERN REGION RANGE AND PASTURE CONDITION Percent Poor and Very Poor, Weekly May Jul Sep 15 May Jul Sep G-NP-30 G-NP-31 Data Source: USDA-NASS, Compiled & Analysis by LMIC Data Source: USDA-NASS, Compiled & Analysis by LMIC Percent 90 GREAT PLAINS REGION RANGE AND PASTURE CONDITION Percent Poor and Very Poor, Weekly Percent 100 SOUTHERN PLAINS REGION RANGE AND PASTURE CONDITION Percent Poor and Very Poor, Weekly May Jul Sep 10 May Jul Sep G-NP-32 G-NP-33 Data Source: USDA-NASS, Compiled & Analysis by LMIC Data Source: USDA-NASS, Compiled & Analysis by LMIC 15

16 Percent 80 CORNBELT REGION RANGE AND PASTURE CONDITION Percent Poor and Very Poor, Weekly Percent 45 SOUTHEAST REGION RANGE AND PASTURE CONDITION Percent Poor and Very Poor, Weekly May Jul Sep 5 May Jul Sep G-NP-34 G-NP-36 Data Source: USDA-NASS, Compiled & Analysis by LMIC Data Source: USDA-NASS, Compiled & Analysis by LMIC GL_GR310 Forage Outlook Hay price to follow corn. Anticipated weaker hay price through the year but Strong demand from beef price outlook. Little beef herd liquidation. Weak demand from dairy. Winter will bring some very bad stories $175/T bad hay will be a good buy. 16


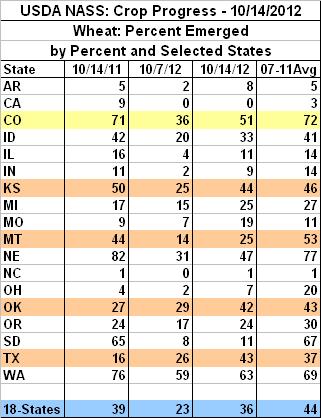
17 Weekly KC Wheat Contract $ Per Bu DODGE CITY WINTER WHEAT PRICES Weekly JAN APR JUL OCT Data Source: USDA-AMS G-P-03 10/04/12 17
18 30-Day Cumulative Rainfall 18


19 JUL 2013 KC Wheat Contract Forecast $ /bu 19

20 JUL 2013 Wheat Contract Wheat Outlook Continued large U.S. stocks. Uncertainty about Asian wheat crop and reduction in world stocks. Strong world demand in the short term. Strong prices and good basis. Forecasts JUL $7.25 with range $6 9/bu. Weekly Live Cattle Contract Monthly Live Cattle Contract The top is not in this market yet trading range of $ /cwt. $130 20
21 Weekly Feeder Cattle Contract Monthly Feeder Cattle Contract The top is not in this market yet trading range of $ /cwt. $160 Cattle Outlook Fed cattle market is strong (than you think): International demand and trade are the reason. Domestic demand is unique. Corn & feeders? Feeder cattle and calf prices will be strong for the foreseeable future: Continued beef cow liquidation. But evidence of herd rebuilding. $ Per Cwt CHOICE STEER PRICE vs BREAKEVEN Cattle Feeding, S. Plains, Monthly Data Source: USDA-AMS & USDA-NASS, Compiled & Analysis by LMIC Latest Data: September C-P-21 10/01/12 Steer Price Breakeven Projected Breakeven 21
22 $ Per Head 210 LIVE TO CUTOUT BEEF PRICE SPREAD Monthly Index Value 120 RETAIL ALL FRESH BEEF DEMAND INDEX Second Quarter, Using CPI 1990= JAN MAR MAY JUL SEP NOV Data Source: USDA-AMS & USDA-ERS, Compiled & Analysis by LMIC C-P-02 10/01/12 Data Source: Bureau of Labor Statistics, USDA-ERS, Compiled & Analysis by LMIC Index Value 120 RETAIL ALL FRESH BEEF DEMAND INDEX Third Quarter, Using CPI 1990=100 $ Per Cwt. 850 WHOLESALE BEEF LOIN STRIP PRICES Boneless 0x1, Weekly JAN APR JUL OCT Data Source: Bureau of Labor Statistics, USDA-ERS, Compiled & Analysis by LMIC Data Source: USDA-AMS 22
23 $ Per Cwt JAN WHOLESALE BEEF RIBEYE PRICES Boneless, Light, Weekly APR JUL OCT $ Per Cwt JAN WHOLESALE BEEF FULL TENDER PRICES Musl-On, 5 Pounds and Up, Weekly APR JUL OCT M-P-21 M-P-23 Data Source: USDA-AMS Data Source: USDA-AMS WHOLESALE BEEF CHUCK PRICES Boneless 2 Piece, Weekly WHOLESALE BEEF BOTTOM ROUND PRICES Pounds, Weekly $ Per Cwt JAN APR JUL OCT $ Per Cwt JAN APR JUL OCT M-P-22 Data Source: USDA-AMS Data Source: USDA-AMS 23
24 $ Per Cwt WHOLESALE BONELESS BEEF PRICES Fresh, 90% Lean, Weekly $ Per Cwt WHOLESALE BONELESS BEEF PRICES Fresh, 50% Lean, Weekly JAN APR JUL OCT 40 JAN APR JUL OCT M-P-24 M-P-25 Data Source: USDA-AMS Data Source: USDA-AMS Why the focus on demand? Strength of domestic & international demand is the cause of strong cattle prices. Two years of drought impacting supplies & market dynamics. It s not all demand but it s pretty close MT U.S. EXPORTS OF BEEF MUSCLE CUTS Weekly Canada Japan Mexico Korean Rep. What happens with herd expansion & when corn returns to below $5/bu.? 1 0 Jan-07 Jul-07 Jan-08 Jul-08 Jan-09 Jul-09 Jan-10 Jul-10 Jan-11 Jul-11 Jan-12 Jul-12 10/01/12 Data Source: USDA-FAS 24
25 1000 MT TOTAL U.S. EXPORTS OF BEEF MUSCLE CUTS Weekly 4 Jan-09 Jul-09 Jan-10 Jul-10 Jan-11 Jul-11 Jan-12 Jul-12 Bil. $ U S BEEF INDUSTRY EXPORT VALUES Annual Extent of the world-wide recession & financial crisis Who wants to forecast this growth? Tallow & Greases Variety Meats Hides & Skins Beef & Veal Live Cattle 10/12/12 I-N-70 08/09/12 Data Source: USDA-FAS Data Source: USDA-FAS, Compiled & Analysis by LMIC U S BEEF INDUSTRY IMPORT VALUES Annual U S BEEF INDUSTRY NET EXPORT VALUES Annual Bil. $ Tallow & Greases Variety Meats Hides & Skins Beef & Veal Live Cattle Bil. $ Live Cattle Beef & Veal Hides & Skins Tallow, Grease & Var Meat Total I-N-71 05/02/12 I-N-72 08/10/12 Data Source: USDA-FAS, Compiled & Analysis by LMIC Data Source: USDA-FAS, Compiled & Analysis by LMIC 25
26 BOXED BEEF CUTOUT VALUE Choice Lbs. Carcass, Weekly CHOICE MINUS SELECT BEEF PRICES Carcass Cutout Value Lbs., Weekly $ Per Cwt. $ Per Cwt JAN APR JUL OCT 0 JAN APR JUL OCT C-P-62 C-P-68 Data Source: USDA-AMS Data Source: USDA-AMS, Compiled & Analysis by LMIC STEER HIDE AND OFFAL VALUE Live Animal Basis, Weekly SLAUGHTER STEER PRICES 5 Market Weighted Average, Weekly $ Per Cwt JAN APR JUL OCT $ Per Cwt JAN APR JUL OCT Data Source: USDA-AMS C-P-39 Data Source: USDA-AMS 26
27 MED. & LRG. #1 FEEDER STEER PRICES Pounds, Southern Plains, Weekly MED. & LRG. #1 STEER CALF PRICES Pounds, Southern Plains, Weekly $ Per Cwt. $ Per Cwt JAN APR JUL OCT 100 JAN APR JUL OCT C-P-49 C-P-54 Data Source: USDA-AMS, Compiled & Analysis by LMIC Data Source: USDA-AMS, Compiled & Analysis by LMIC MED. & LRG. #1 STEER CALF PRICES Pounds, Southern Plains, Weekly SLAUGHTER COW PRICES Southern Plains, 85-90% Lean, Weekly $ Per Cwt. $ Per Cwt JAN APR JUL OCT 40 JAN APR JUL OCT C-P-49A C-P-35 Data Source: USDA-AMS, Compiled & Analysis by LMIC Data Source: USDA-AMS 27
28 Thou. Head JAN APR BEEF COW SLAUGHTER Federally Inspected, Weekly JUL OCT Thou. Head JAN APR DAIRY COW SLAUGHTER Federally Inspected, Weekly JUL OCT C-S-34 10/12/12 C-S-35 10/12/12 Data Source: USDA-AMS & USDA-NASS Data Source: USDA-AMS & USDA-NASS 7 Mil. Head HEIFERS HELD AS BEEF COW REPLACEMENTS July 1, U.S. Mil. Head 7.0 HEIFERS HELD AS BEEF COW REPLACEMENTS January 1, U.S % % C-N-37 07/20/12 C-N-38 07/20/12 Data Source: USDA-NASS Data Source: USDA-NASS 28
29 $ Per Cow 200 ESTIMATED AVERAGE COW CALF RETURNS Returns Over Cash Cost (Includes Pasture Rent), Annual Mil. Head 12.5 CATTLE ON FEED US Total, Monthly / JAN FEB MAR APR MAY JUN JUL AUG SEP OCT NOV DEC C-P-66 C-N-10 09/20/12 09/21/12 Data Source: USDA-AMS & USDA-NASS, Compiled & Analysis by LMIC Data Source: USDA-NASS Mil. Head 2.7 FEEDLOT PLACEMENTS US Total, Monthly Mil. Head 1.6 CATTLE PLACED WEIGHING LESS THAN 700 POUNDS 1,000 Plus Capacity Feedlots, U.S., Monthly / / JAN FEB MAR APR MAY JUN JUL AUG SEP OCT NOV DEC JAN FEB MAR APR MAY JUN JUL AUG SEP OCT NOV DEC C-N-08 C-N-08A 09/21/12 09/21/12 Data Source: USDA-NASS Data Source: USDA-NASS, Compiled & Analysis by LMIC 29
30 Mil. Head 2.2 FED CATTLE MARKETINGS US Total, Monthly Percent 20 FED CATTLE MARKETINGS As a Percent of Cattle on Feed, Monthly / / JAN FEB MAR APR MAY JUN JUL AUG SEP OCT NOV DEC 13 JAN FEB MAR APR MAY JUN JUL AUG SEP OCT NOV DEC C-M-11 09/21/12 C-M-23 09/21/12 Data Source: USDA-NASS Data Source: USDA-NASS, Compiled & Analysis by LMIC LIVE WEIGHT -- STEER AND HEIFER Texas/Oklahoma Panhandle Area, Weekly U S BEEF AND VEAL IMPORTS Carcass Weight, Monthly Pounds JAN APR JUL OCT Mil. Pounds JAN FEB MAR APR MAY JUN JUL AUG SEP OCT NOV DEC C-S-26 09/28/12 I-N-15 09/12/12 Data Source: USDA-AMS Data Source: USDA-ERS & USDA-FAS 30


31 U S BEEF AND VEAL EXPORTS Carcass Weight, Monthly U S NET BEEF IMPORTS Carcass Weight, Monthly Mil. Pounds JAN FEB MAR APR MAY JUN JUL AUG SEP OCT NOV DEC Mil. Pounds JAN FEB MAR APR MAY JUN JUL AUG SEP OCT NOV DEC I-N-16 09/12/12 I-N-31 09/12/12 Data Source: USDA-ERS & USDA-FAS Data Source: USDA-ERS & USDA-FAS, Compiled & Analysis by LMIC DEC Live Cattle Contract APR 2013 Live Cattle Contract Example of poor market possible for next year heavy numbers & slow marketings 31


32 NOV Feeder Cattle Contract MAR 2013 Feeder Cattle Contract Example of worst case scenario for the next few years soft fed cattle & high corn Input Market Outlook Summary Uncertainty & risk. High fuel costs but not increasing Fertilizer has to follow. Chemical inputs will likely also. Seed availability or lack of Supply industries operating under capacity & unwilling to take risk. Credit risk & broker risk Inflation unique to food & energy sectors. 32
33 Short Term Outlook Drought markets drive prices up to where use is rationed and production encouraged. Happened in feedgrains happened in wheat. Corn then hay, soybeans, & wheat. Volatility through harvest is in and then some more volatility. Weather is creating a strong early delivery market. Need two good corn (& oilseed) crops. But it all depends on next year s weather 33

34 Short Term Outlook Fed cattle excellent domestic and international demand persist & grow? Feeder cattle & calves dry weather feed prices persistent supplies. Beef herd expansion Dairy herd liquidation Contact and Link Information 34