ITALIAN AGRICULTURAL PRODUCTION AND THE HEAT WAVE DURING SUMMER Luigi Perini 1 and M. Carmen Beltrano Ministry of Agriculture, Rome, Italy
|
|
|
- Rosanna Ryan
- 5 years ago
- Views:
Transcription
1 P1.41 ITALIAN AGRICULTURAL PRODUCTION AND THE HEAT WAVE DURING SUMMER 23 Luigi Perini 1 and M. Carmen Beltrano Ministry of Agriculture, Rome, Italy 1. INTRODUCTION Mediterranean climate is usually defined temperate. It is characterized by a rainfall distribution mainly concentrated in Winter, Spring and then in Autumn. Summer is the period of scarce or null rainfall. Summer temperatures are not usually higher than 35 C, winter temperatures are not usually lower than -5 C. Definitely, seasons are clearly drawn: Winter is generally moderate cold, Spring is rainy with sunny days, Summer is warm and dry, Autumn is almost cloudless, quite rainy, but never severe. Productive activities, as agriculture, are structured upon the environmental features and have acquired specific attributes expressed through the adopted techniques and, above all, through the type of agricultural production. During the last decades, there have been a wide diffusion of intensive crops, so the Italian agricultural scenario has widely changed and the traditional local productions, more adapted to the environment, have been replaced by more rewarding cultivars and productive techniques which require higher resources to support the production (more fertilization, increase of chemical pest control, more irrigation,...). However the annual yields are linked to several uncontrollable variables, as weather conditions, which represent an important uncertain factor of the agricultural production. The climatic vulnerability of crops can be increased by the wide diffusion of more productive cultivars which are not actually suitable to local weather conditions. The heat-wave which interested Europe from May to September 23 has represented an extreme event for the high temperature values, their long persistence and the long duration of drought. The weather anomalous conditions involved all Italian regions and brought negative effects to agricultural production. The agrarian soils have shown a debit water balance mostly due to an insufficient 1 Corresponding author address: Luigi Perini, Ufficio Centrale di Ecologia Agraria Via del Caravita, 7a Rome (Italy) lperini@ucea.it water soil storage and a strong evapotranspiration demand. For example, the weather station Collegio Romano in Rome recorded in 23 an annual precipitation amount lower of about 4% then climate amount (Fig.1). Drought and high temperatures of the summer 23 brought low quantitative and qualitative yields and an increase of the main agricultural products prices (Fig. 2). 2. MATERIALS AND METHODS The mostly climatic and soils data have been acquired from the Agroclimatic Atlas agroclimatology, pedology and phenology of Italy realized in the framework of the National Research Programme of the Ministry of Agriculture on Agriculture and Climate change, called CLIMAGRI. Meteorological values refer to data series estimated with Kriging s techniques. The dataset is composed of complete daily values series of temperature (minimum and maximum), rainfall, sunshine, relative humidity and wind speed of 544 points homogeneously disseminated in a regular grid (3 x 3 Km) all over the Italian country. Climatic features of Italy were calculated using data of a standard period ( ) according to WMO recommendations. The pedological dataset has been assembled using information of the National Chart of Agrarian Soils Water Capacity. The definition of each soil unit has been realized through the integration of lithologic information and physiographic features obtained through satellite images. Further soil information have been obtained through several local and regional studies. In order to represent Italian soils, the main pedological variables have been processed to realize a complete spatial representation through about 5 square cells with a surface of 64 km 2 (8 x 8 Km). For each soil cell we have estimated several features as mean soil depth, mean Available Water Capacity (AWC) and mean Texture (% of sand, loam and clay). Reference crop evapotranspiration (ET ) has been calculated through Penman-Monteith formula as suggested by FAO. To determine the soils water availability it has been implemented a soil water balance scheme considering daily precipitation
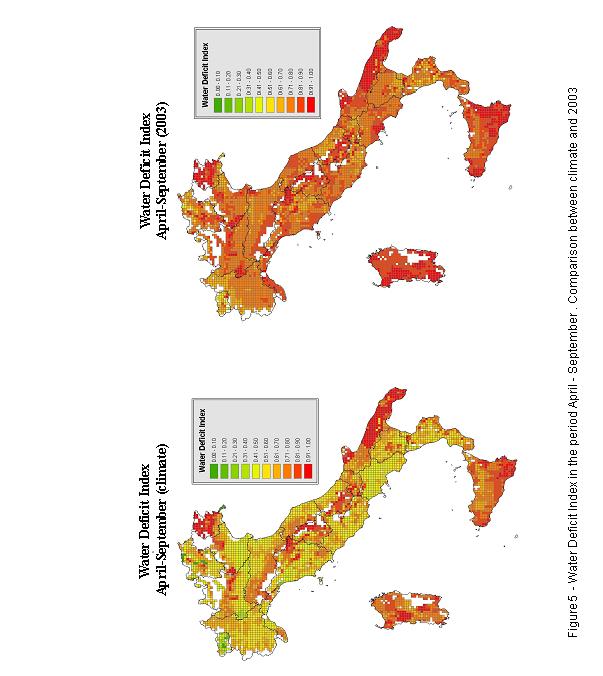
2 data as main water input, daily ET data as main water output and some soils features related to the Available Water Capacity (AWC), soil depth, soil texture and hydraulic conductivity. Water balance has been set with a daily cadence and elaborated for all soil cells. Due to the general matter, we did not consider any specific crop, therefore we compared the daily available water amount (i.e. daily rainfall and the available water stored in the soil) with the ET in order to obtain the following daily Water Deficit Index (DI): ET DI = 1 ET where: DI = water deficit index ET R = Real Evapotranspiration (mm) ET = Referring Evapotranspiration (mm) Water Deficit Index may change from (no water stress) to 1 (maximum water stress) referring to all constrain conditions that limit a full evapotranspiration (ET ). Elaboration results have been processed through GIS tools (ArcView 8.2) to obtain a spatial distribution of the analysed quantities, to allow a comparison among the different areas and to test differences between 23 and climate trends ( ). 3. RESULTS AND DISCUSSION Water deficit index (DI) can represent the eventual suffering status of crops in relation to the available water required for physiologic plant growing process. During the first 9 months of 23, Italy was involved in an almost total lack of precipitation. Moreover, from April to September 23 an unexpected heat-wave has brought a strong increase of the evapotranspiration (Fig.3). During the last months of 22 and the first months of 23 (from January to March) an anomalous dry autumn - winter season has prevented a normal soil water storage and it has made the situation worse in the following Spring Summer season. During the period April- September 23 there have been an increase of the Italian areas with a DI higher than.6 (the start of heavy injuries for crops), from 18, Km 2 to 28, Km 2, with an increase of 36%, which underlines the anomalous trend of 23 (Fig. 4). Referring to the maximum water stress index (DI =1), the Italian surface involved in such situation has shift from 29, Km 2 (climatic conditions) to almost 55, Km 2 (23) with an increase of 5% (Fig.5). This situation has involved important agricultural areas and has brought serious economic damages even for the impossibility to alleviate drought conditions through appropriate irrigation (Fig.6). Water resources, in fact, were not available for the lack of the main water storage and for infiltration of R salty sea water in the ground water tables of several coast areas. Market researches allow to assess the effects of the meteorological anomaly of 23 on several crops. For example, concerning tomato production, the 95% of farms has considered extreme temperature and the dry climate without rainfall as the main cause of crop damages. Referring to maize production, despite the regular sowing and the first growing phases, the sudden increase of temperature and the almost total lack of rainfall during the following period, have injured the flowering and the yield formation. Moreover, high temperatures and drought have brought a sensitive reduction of crop growing period and have consequently anticipated the harvest. In all Italian production areas there have been a drastic crop decrease with a mean value of nearly 6,5 tons per hectare. The meteorological course of Spring-Summer 23 has seriously compromised sunflower crops and has brought a yield drop also for this production. In particular in the Central Italy there have been a yield decrease of 2-5%. However the low humidity percentage and the absence of parasitic attacks have supported and satisfied the qualitative aspects. The anomalous meteorological conditions of Spring-Summer 23, have brought a decrease of 3-4% even in soja production, mostly in the Northern-Eastern Italy. 4. REFERENCES Allen, R.G. et al., 1998 : Crop evapotranspiration. Guidelines for computing crop water requirements. FAO Irrigation ad drainage paper n. 56 A. Gerakis and B. Baer, 1999: A program for soil textural classification. Soil Science Society of America Journal, 63:87-88 ISMEA Servizi per il Mercato Agricolo Alimentare (Agricultural Trade Services) ( Van Keulen H., Wolf J., 1986: Modelling of agricultural production: weather, soils and crops. Pudoc Wageningen. L. Perini et al., 24: Agroclimatic Atlas agroclimatology, pedology and phenology of Italy. (in press) L. Perini, M. Ranuzzi, 22: Temperature and precipitation analysis of the last decades in Italy (in Italian). Atti del Convegno Clima, Precipitazioni, Agricoltura Roma 22 novembre 22.
3 8 mm 6 CUMULATIVE AMOUNT OF PRECIPITATION Rome (Italy) - Collegio Romano 8 mm 6 4 CLIMATE (1862-2) Jan Feb Mar Apr Ma Jun Jul Aug Sep Oct No Dec Figure 1 Comparison between climate and 23 annual precipitation 18 Price Index (1995=1) (from ISMEA - www. ismea.it) Cereals Legumes May '3 June '3 Jul '3 Aug '3 Sep '3 Oct '3 Nov '3 Dic '3 Figure 2 Comparison between climate and 23 annual precipitation

4
5 12, 1, climate 23 Water Deficit Index per Surface (Km 2 ) Period: April - September 8, Km 2 6, 4, 2, Water Deficit Index (DI) Figure 4 Italian surface (Km 2 ) involved in water deficit. Comparison between climate and 23.
6

7 Figure 6 Water Deficit Index variation (%) in the period April September. Comparison between 23 and climate