DAIRY HEIFER REARING STRATEGIES 1) Six months to pre-fresh
|
|
|
- Cornelia Burke
- 5 years ago
- Views:
Transcription
1 DAIRY HEIFER REARING STRATEGIES 1) Six months to pre-fresh New England Dairy Conferences March 10 Waterville, ME; March 11 Whitefield, NH; March 12 West Lebanon, NH Hugh Chester-Jones University of Minnesota SROC, Waseca 2014 Regents of the University of Minnesota. All rights reserved.
2 Outline of today s discussion Sources of variation and variance control factors Growth and Target profiles 6 months to pre-fresh Systems and management highlights and variance control
3 Example of raw means profile of heifers by farm showing relationships of initial serum protein to growth by 6 months of age at SROC and by complete lactations on their home dairies Initial SP, g/dl 4 or < or > Farm A (1,322) % of heifers Final BW, lb Final Hip Height, in ADG, lb First calving age Final Std ME, lb 27,076 28,997 29,387 29,186 29,270
4 Production (System) Goals Quality Control Systems (Hoffman, 2004) - Breeding Age/Weight - Calf Weaning Criteria - Feed efficiency - Calving Age/Weight - Feed Cost Controls --Precision feeding - Body condition - Reproductive Efficiency - Vaccination Goals - Colostrum Feeding Goals - Morbidity/Mortality - Passive Transfer - Bunk Score Guidelines - Variance Control -
5 More recent variables Genomics Sexed Semen
6 Growth and target profiles Biological variation Heifer monitoring
7
8 Targets for large breed heifer rearing in Intensive management conditions (Van de Haar, 2009) Variable Age at first breeding Body weight at first breeding Age at first calving Target 13 to 15 months 800 to 820 lb 22 to 24 months Body weight after calving 1250 Withers height at calving (small 56 in breeds in) Body condition score at calving 3.0 to 3.5 Growth rate from 3 to 10 months of age 1.8 to 2.0 lb/day
9 Body Weight. lbs Jersey Guernsey Aryshire Swiss S-Holstein L-Holstein Shorthorn Age, months Breed Based Heifer Growth Hoffman, 2010

10 WCROC at 10
11 Cross breeding U of MN Established in 2002 with Jersey AI bulls and Holsteins at the seasonal grazing dairy in Morris and Confinement herd in St. Paul. Now also using Montbeliardes, and Swedish Red s. Have used Normande breed Advantages for reproduction efficiency and longevity Current work with 10 dairy herds cross-breeding (Montebeliardes, Swedish Red, Jersey) vs. Holstein

12 Age vs BW or MBW as breeding target? Hoffman, 2008
13 Theoretical genetic deviation of body weight (BW) in Holstein replacement heifers Age, months BW, lb BW Genetic Std Deviation, lb BW low range, lb BW high range, lb
14 How fast can heifers gain? 1.8 lb-2 lb/day? Fat pad Birth Birth B B = mammary parenchyma C C = mammary ducts Van Amburgh and Meyer, 2006; Elevated energy intake prior to puberty consistently reduces prepubertal mammary development.. Heifers on a high plane of nutrition have less parenchyma DNA at puberty simply because they reach puberty at a younger age
15 A Puberty A = mammary ducts A Late Gestation B B = milk secreting alveoli Van Amburgh and Meyer, 2006 parenchyma DNA to puberty only 2% of total by late gestation
16 Strategies 6 months to pre-fresh *Use most economical quality feeds forages,byproducts; *Consider culling poorer heifers early; reduce within pen variance
17
18 Table 1. Dietary energy and protein guidelines 1 for large breed dairy heifers gaining 1.8 lbs/day in a thermal neutral environment. Heifer Body Weight, lbs Item Unit Abbreviation Dry Matter Intake lbs/d DMI Crude Protein % of DM CP Rumen-Undegraded Protein % of CP RUP Rumen-Degraded Protein % of CP RDP Total Digestible Nutrients % of DM TDN Metabolizable Energy ME Mcals/lb Determined from the Nutrient Requirements of Dairy Cattle, 2001
19 Guidelines for feeding Holstein heifers ad libitum to calve at 23 months (Van de Haar, 2009) Age mths BW lb Gain lb/day WH in ME Mcal /lb NE m Mcal lb % CP CP: ME g/mcal precalf postcalf
20
21 Characteristics of Pasture 18-34% Protein High soluble protein Net Energy 30 55% NDF Low non-fiber carbohydrates 12-24% Heifer intake 1.1 to 1.2% of BW as cell wall (NDF). (Rickard U of MO Extension)
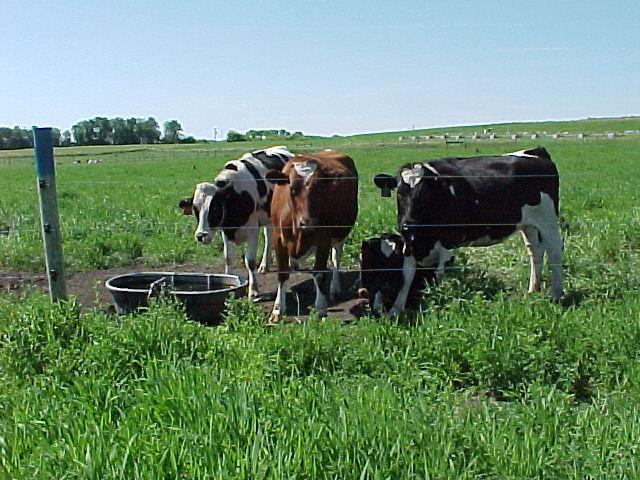
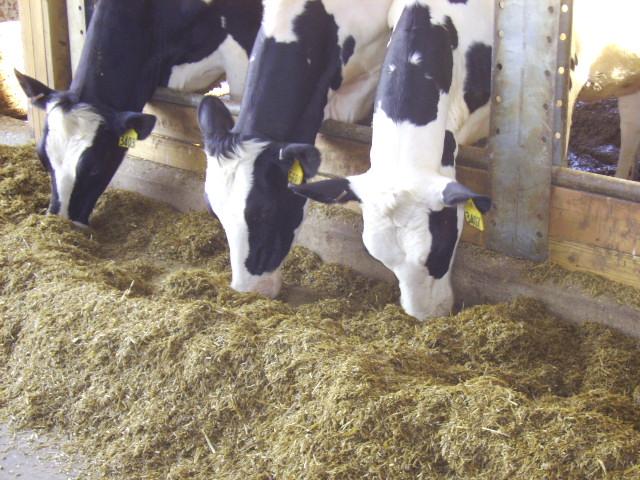
22 Heifer management confinement vs. pasture

23 Confinement 58 to 72 heifers for the; Pasture 58 to 72 heifers

24 Fenceline feeding TMR 15.8% CP, 64% TDN, 28.9% ADF; 1% CA, 0.38% P

25 Grazing vs. confinement Pre-breeding - Pasture 23% CP
26 Transition from TMR to pasture and Fed 1-2 lbs of supplement/heifer daily- Bloat guard block in the paddocks; hay also fed
27 Animal performance Feedlot Average Daily Gain 2.00 in in in 2002 Pasture Average Daily Gain 2.04 in in in 2002
28 Feedlot Costs Feed Labor Machiner y Facilities Bedding Health costs Total
29 Pasture Costs Feed Labor Machinery Fencing Health costs Seed & Fert Pasture Death Loss 0.15 Total


30 Heifer Raising Regime months May 9, 2000 September 15, 2000
31 Nutrient Composition of Diets C Pasture R Pasture TMR Alfalfa Pellets DM, % DM Basis CP, % NDF, % ADF, %
32 Heifer Growth C R F P-value N Initial BW, lb Final BW, lb b b a 0.03 ADG, lb b 1.69 b 2.34 a 0.01 Initial BCS Final BCS 3.5 b 3.6 b 3.7 a 0.01 Initial HH 1, in Final HH, in HH= hip height
33 Dry Matter Intake Pre-Partum DMI (lb/d) Days Pre-partum P=0.14 C R F
34 Heifer Nutrition Basics Provide quality feeds Understand nutritional requirements Adjust ration to changing environment Avoid over conditioning Feed protein wisely Feed precise amount of minerals and vitamins Use efficient feeding systems Consider ionophores
35 Envrionmental factors that need energy adjustments Cold weather Wet/muddyconditions Wind exposure (winter) Cold, hard resting areas Well-managed freestalls Ionophore feeding Solar radiation Heat stress Crowding Parasites Increase dietary energy Increase dietary energy Increase dietary energy Increase dietary energy Do not overfeed energy Closely evaluate dietary energy Closely evaluate dietary energy Increase water access& energy Closely evaluate dietary energy Increase dietary energy or treat Adapted from Hoffman U of WI
36 Adjust ration to changing environment to meet 1.8 lbs/day gain More energy for low temperatures, wet conditions, dirty hair coats, wind chill, cold/drafty resting areas Additional energy by extra grain, utilizing corn silage etc.
37 600 lbs large breed heifer, 1.8 lbs/day adjusted for haircoat (Hoffman and Plourd, 2003) Diet Summer Winter Winter Haircoat Clean Clean Dirty Corn silage, % DM Legume silage, bud Shelled corn SBM Expeller SBM TM salt/mineral mix DMI, lbs/day CP, % DM ME, Mcals/lb ADF, % DM NDF, % DM 45.3 (1.1%) 38.8 (1.0%) 34.5 (0.9%)
38 1200 lbs large breed heifer, 1.8 lbs/day adjusted for haircoat (Hoffman and Plourd, 2003) Diet Summer Winter Winter Haircoat Clean Clean Dirty Corn silage, % DM Legume silage, bud Shelled corn SBM Expeller SBM TM salt/mineral mix DMI, lbs/day CP, % DM ME, Mcals/lb ADF, % DM NDF, % DM 48.0 (1.1%) 47.5 (1.1%) 45.1 (1.1%)
39 Effect of temperature on Dry Matter Intake (DMI) Temperature F DMI change > to 35% decrease 77 to 95 3 to 10% decrease 59 to 77 normal intake expected 41 to 59 2 to 5% increase 23 to 41 3 to 8% increase 5 to 23 5 to 10% increase < 5 8 to 25% increase
40 Forage options and NDF digestibilities examples % NDF digestibilities invitro 48 h (U of WI) Alfalfa hay Alfalfa silage Grass hay Grass silage Corn silage BMR silage TMR heifers (Hoffman and Combs, Focus on Forage -2004) NDF intake for 9,000 WI heifers av 1% BW; Hoffman and Kester, 2012, Estimating DMI of dairy heifers. Low NDF or high NDFD diets > DMI than high NDF diets or low NDFD diets (Hoffman and Kester, 2012, Estimating DMIof dairy heifers)
41 Forage options and NDF digestibilities - % NDF digestibilities invitro 30h (U of WI) Soyhulls 91.6 Beet pulp 83.6 DDG 76.2 Corn 85.0 Use to combine with low NDFD forages Level of dietary NDF contributes to gut fill and DMI changes;
42 Feed bunk management to control feed loss and help save on feed costs U of WI Scoring modified from SDSU and ISU 0 = Slick concrete 1 = Few feed particles remaining (daily objective) 2 = Many feed particles but concrete still visible 3 = Large amounts of feed covers the bottom of the bunk If 0 score = increase feed 2% 1 = No change 2 = decrease feed 2% 3 = decrease feed 5%

43

44 Gustafson Dairy Heifers, Willmar

45 Gustafson Dairy Heifers, Willmar MN Ration Example
46
47 Limit-feeding overview Feed a more nutrient dense diet, and feed less of it - target ADG with balanced protein/energy for limit vs. ad lib heifers Similar lactation milk yields to ad lib Decreases manure excretion and > N utilization Need adequate bunk space so all heifers can eat at the same time. Changes heifer behavior more bawling and boredom (Hoffman, 2010)
48 Ingredient and nutrient composition of treatment diets of limit fed growing Holstein heifers Treatment Item C100 L85 L80 + I Corn silage % of DM Oatlage Haylage Shelled corn SBOM Base mix Lasalocid, mg/d 325 Nutrient composition 1 DM, % as fed CP, % NDF IV NDFD, % NDF NFC Energy Calculations 3 TDN, % NE g, Mcal/kg NE m, Mcal/kg


49 University of Wisconsin Selected Diet examples 100% ad lib 85% of intake 80% of intake
50 Heifer transition to first calving Adjust to change in housing type (pasture to free stalls or bedded pack) Moderate energy diet prepartum to prevent overconditioning House heifers and cows separately Provide exercise opportunities Adapted from Litherland, 2009
51 Conclusions An overview of dairy heifer rearing strategies have been discussed in reference to examples of source of variation control The key is to maintain consistency of nutritional management and provide the most beneficial balance between calf and heifer performance and economic efficiencies that best fits the needs of the individual operation.