The Human Right to Adequate Food
|
|
|
- Nicholas Barton
- 5 years ago
- Views:
Transcription
1 Tropentag, Berlin The Human Right to Adequate Food Thomas Pogge Leitner Professor of Philosophy and International Affairs, Yale University 1
2 The 1996 World Food Summit in Rome Promised to halve the number of chronically undernourished people between 1996 and This implies an annual decline by 3.58% (50% over 19 years). We pledge our political will and our common and national commitment to achieving food security for all and to an on-going effort to eradicate hunger in all countries, with an immediate [!] view to reducing the number of undernourished people to half their present level no later than
3 2010 3
4 % 4
5 2010 5
6
7 7
8 UNGA s Millennium Declaration, 2000 Pledges to halve the proportion of hungry people between 2000 and This implies an annual decline by 3.35% (40% over 15 years). to halve, by the year 2015, the proportion of the world s people whose income is less than one dollar a day and the proportion of people who suffer from hunger. 8
9 Millennium Declaration Number of World Population Proportion Chronically Progress against Chronic
10 Millennium Declaration Number of World Population Proportion Chronically Progress against Chronic
11 Millennium Declaration Number of World Population Proportion Chronically Progress against Chronic
12 Millennium Declaration Number of World Population Proportion Chronically Progress against Chronic %
13 Millennium Declaration Number of World Population Proportion Chronically Progress against Chronic %
14 Millennium Declaration Number of World Population Proportion Chronically Progress against Chronic %
15 Millennium Declaration Number of World Population Proportion Chronically Progress against Chronic %
16 Millennium Declaration Number of World Population Proportion Chronically Progress against Chronic %
17 Millennium Declaration Number of World Population Proportion Chronically Progress against Chronic %
18 Millennium Declaration Number of World Population Proportion Chronically Progress against Chronic %
19 Millennium Declaration Number of World Population Proportion Chronically Progress against Chronic % %
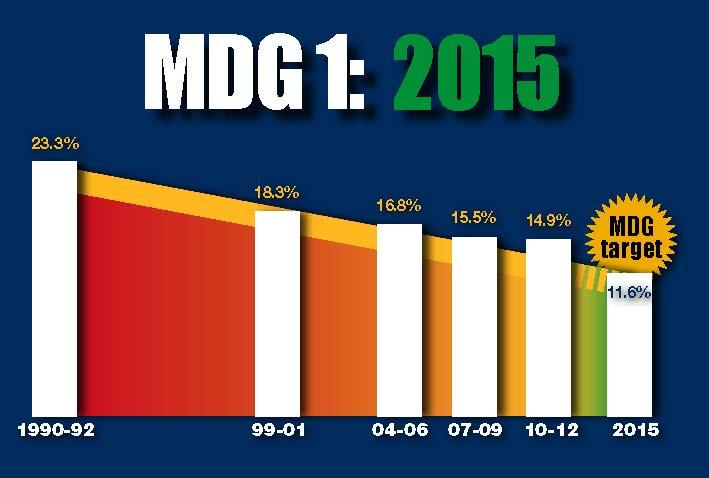
20 The First Millennium Development Goal Pledges to halve the proportion of chronically undernourished people in the population of the developing countries between 1990 and This implies an annual decline in their number by 1.37% (29% over 25 years). MDG-1: Target. Halve, between 1990 and 2015, the proportion of people [in the developing regions] who suffer from hunger. UN: The Millennium Development Goals Report 2012, p. 11; 20
21 MDG1 Number of DC DC Population Proportion Chronically Progress against DC Chronic
22 MDG1 Number of DC DC Population Proportion Chronically Progress against DC Chronic
23 MDG1 Number of DC DC Population Proportion Chronically Progress against DC Chronic
24 MDG1 Number of DC DC Population Proportion Chronically Progress against DC Chronic %
25 MDG1 Number of DC DC Population Proportion Chronically Progress against DC Chronic %
26 MDG1 Number of DC DC Population Proportion Chronically Progress against DC Chronic %
27 MDG1 Number of DC DC Population Proportion Chronically Progress against DC Chronic %
28 MDG1 Number of DC DC Population Proportion Chronically Progress against DC Chronic %
29 MDG1 Number of DC DC Population Proportion Chronically Progress against DC Chronic %
30 MDG1 Number of DC DC Population Proportion Chronically Progress against DC Chronic %
31 MDG1 Number of DC DC Population Proportion Chronically Progress against DC Chronic % %
32 Year (2011) with improved methodology (2012) 32 UN Food and Agriculture Organization (
33 Year (2011) with improved methodology (2012) UN Food and Agriculture Organization (
34 Year (2011) with improved methodology (2012) UN Food and Agriculture Organization (
35 Year (2011) with improved methodology (2012) UN Food and Agriculture Organization (
36 FAO World Food Price Index Nominal Real (deflated)
37 Allowable Millions of 2015 Rome Declaration UNGA Millennium Declaration MDG 1 Progress Achieved by 2010 (target: -50%) 394m 480m 611m Old Methodology Rome Declaration +17% UNGA Millennium Declaration +2% 37 MDG 1-21%
38 Allowable Number of 2015 Rome Declaration UNGA Millennium Declaration 394m 480m MDG 1 611m 724m Progress Achieved by 2010 (target: -50%) Old Methodology Improved Methodology Rome Declaration +17% UNGA Millennium Declaration +2% 38 MDG 1-21%
39 Allowable Number of 2015 Rome Declaration UNGA Millennium Declaration 394m 480m MDG 1 611m 724m Progress Achieved by 2010 (target: -50%) Old Methodology Improved Methodology Rome Declaration +17% UNGA Millennium Declaration +2% MDG 1-21% -36% 39
40
41 Conclusion (for SDGs) The definitions and measurement methods involved in development targets must not be allowed to be revised midway; and the tracking of progress must not be entrusted to politically exposed agencies like the FAO and the World Bank, but should be left to an independent international group of top-level academic experts. Example: the MDG hunger target. 41
42 The FAO s Improved Methodology (2012) A person counts as undernourished/hungry only if her/his (a) food energy availability [no other nutrient deficiencies count] (b) is inadequate to cover even minimum needs for a sedentary lifestyle (c) for over a year. FAO: SOFI 2012, Annex 2, p
43 Die neue Definition der FAO (2012) UN Food and Agriculture Organization: the reference period should be long enough for the consequences of low food intake to be detrimental to health. Although there is no doubt that temporary food shortage may be stressful, the FAO indicator is based on a full year. FAO: SOFI 2012, Annex 2, p
44 First Argument for New Methodology At the moment, few surveys accurately capture habitual food consumption at the individual level and collect sufficient information on the anthropometric characteristics and activity levels of each surveyed individual; in other words, very few surveys would allow for an estimation of the relevant energy requirement threshold at the individual level. 44
45 Second Argument for New Methodology Within the population, there is a range of values for energy requirements that are compatible with healthy status, given that body weight, metabolic efficiency and physical activity levels vary. It follows that only values below the minimum of such a range can be associated with undernourishment, in a probabilistic sense. Hence, for the PoU [prevalence of undernourishment] to indicate that a randomly selected individual in a population is undernourished, the appropriate threshold is the lower end of the range of energy requirements. 45