Marketing Corn and Soybeans during the Growing Season: 2018 Outlook and Pricing Opportunities
|
|
|
- Leonard McCoy
- 5 years ago
- Views:
Transcription


1 Marketing Corn and Soybeans during the Growing Season: 2018 Outlook and Pricing Opportunities Dr. S. Aaron Smith Assistant Professor, Crop Marketing Specialist, and Extension Economist Department of Agricultural and Resource Economics University of Tennessee Institute of Agriculture Crop Economics:
2 Overview Market Factors Corn and Soybean Supply and Demand Prices Market Opportunities
3 Market Factors Bullish Global demand Domestic demand Argentina's smaller soybean crop Global economic expansion Bearish USD strength Weather year-to-date Brazils record soybean crop Global trend towards isolationism Unknown Trade Agreements (China, NAFTA, CPTPP, and other) Weather moving forward South American politics/brazils trucker strike Argentina s tariff policy

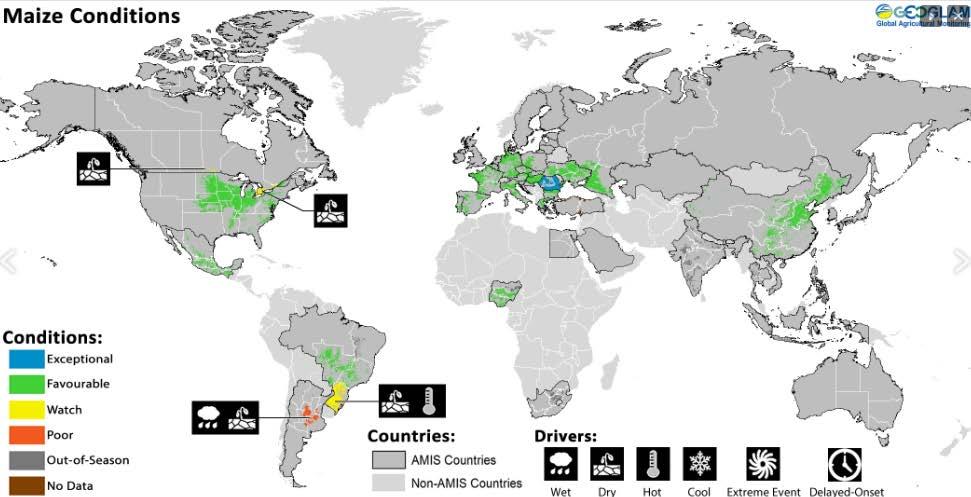
4 Favorable conditions in most corn and soybean production regions.
5 Corn Crop Conditions Planting got off to a slow start but recovered with near record crop conditions for corn to start the year. We have a remarkable ability to plant acreage in a small window. Soybeans Crop conditions close to record condition to start the year.
6 U.S. Trade War with China Within the last 4 weeks Joint Statement of the U.S. and China Regarding Trade Consultations Hold on Tariffs. Deal to lift sanctions on Chinese telecom giant ZTE. China announced previously promised cut in tariffs on imported cars and auto parts. China scrapped an ongoing antidumping investigation on U.S. sorghum. President - Tweeted massive amounts of agricultural product will be flowing to China one of the best things to happen to our farmers in many years. The White House walked back the on hold declarations on the $50 billion in tariffs on Chinese goods; announced tariffs will be imposed June 30 th, final list announced June 15. End of last week/early this week - Tariffs for both coming. game on? Source: Muhammad
7 "When my information changes, I alter my conclusions. What do you do, sir?" John Maynard Keynes Global and Domestic CORN SUPPLY AND DEMAND
8 U.S. Supply and Demand 2016/ /18 Est. 2018/19 Projected Change Year/Year Planted and Harvested Acres & Yield Acres Planted (million) Acres Harvested (million) U.S. Yield (bu/acre) Supply (Million Bushels) Beg. Stocks 1,737 2,293 2, Production 15,148 14,604 14, Total Supply 16,942 16,942 16, Use & Ending Stocks (Million Bushels) Feed and Residual 5,472 5,500 5, Ethanol 5,432 5,575 5, Food, Seed & Industrial 1,451 1,465 1, Exports 2,293 2,300 2, Total Use 14,649 14,840 14, U.S. Ending Stocks 2,293 2,102 1, Foreign Stocks 6,664 5,484 4, Price and Stocks-to-Use Ratio U.S. Price ($/bu) $3.36 $3.25-$3.55 $3.40-$4.40 $0.40 U.S. Stocks/Use 15.65% 14.78% 10.79% -3.99% June 29 acreage report could increase acres. Too early to put too much stock in yield estimates. Exports and feed down (will depend on supply and trade). Domestic and global stocks are reducing. Stocks-to-use down. Price Response Positive Negative Neutral/Unknown
9 Global Corn Production Country 2016/ / /2019* Acres Harvested (million) China United States Brazil ROW Average Yield (bu/acre) China United States Brazil ROW Production (billion bushels) China United States Brazil ROW *projected We typically think of China as a large importer of agricultural products, however they have substantial acreage. U.S. holds a massive yield advantage over the rest of the world. U.S. represents approximately 35% of global production.
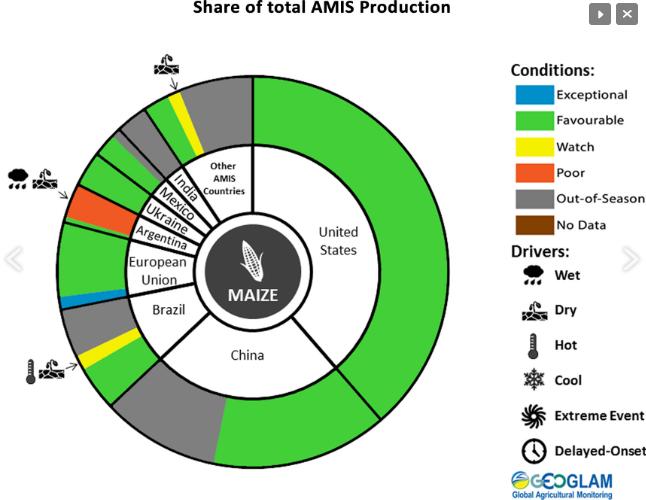
10 Source: Global corn production regions

11 Why is this important?
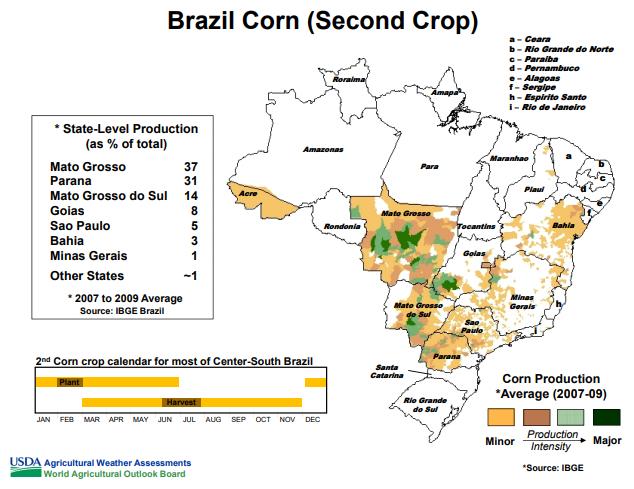
12 Planted (million acres) /01 Brazilian Corn Acres Planted, 2000/01 to 2017/ nd Crop Corn Source: CONAB 2001/ / / /05 1 st Crop 2005/ / / / / / / / / / / / /18 Why is this important? As production moved from 1 st to 2 nd crop the timing the Brazilian crop makes it to the global market changes.
13 Billions Global Corn Consumption, Estimated per Capita Year Consumption Global demand is increasing Global per capita consumption of corn is rising due to: Shifting dietary demands A larger middle class
 ROW,")


14 Corn Major Importers and Exporters 2018/2019 GLOBAL CORN IMPORTS (5,970 MILLION BU TOTAL) ROW, 3315 Mexico, 657 European Union, 630 Japan, 591 Vietnam, 394 Egypt, /2019 GLOBAL CORN EXPORTS (5,630 MILLION BU TOTAL) Ukraine, 945 Argentina, 1063 Russia, 217 ROW, 87 Brazil, 1220 United States, 2100

15 Corn "The China Gap", 2006/ / Billion Bushels Production Imports Ending Stocks Domestic Consumption When China uses more corn than it produces the Gap must be made up through using stocks or imports.
16 Billions of Bushels Global Corn Ending Stocks, 2012/13 to 2018/19 Marketing Years / / / / / / /2019 China ROW United States Brazil Global stocks projected to decrease in back-toback years. Projected at 6.09 billion to end the 2018/19 marketing year.
 2018*: World = 14.2% US = 12.6% $3.70 to $5.")
17 8 Corn Stocks-to-Use Ratio: US Farm Price, * US Price ($/bu) % 9.50% 11.50% 13.50% 15.50% 17.50% 19.50% 21.50% 23.50% US Average Price ($/bu) 2018*: World = 14.2% US = 12.6% $3.70 to $5.20 A 1% change in stocks-to-use results in a predicted change of cents per bushel. World US Linear (World) Linear (US)
18 Corn Supply and Demand Summary Supply and demand fundamentals have improved. Stocks are down (+) Consumption is up (+) Production is still unknown (but looking strong) (-) Politics and trade negotiations are creating uncertainty and volatility in markets. Short term (-); Long term (-/+).
19 Trade has been disregarded, it s been misunderstood and often it has been villainized, Devry Boughner Vorwerk, Cargill Inc. Domestic and Global SOYBEAN SUPPLY AND DEMAND
20 U.S. Supply and Demand 2016/ / /19 Projected Change Year/Year Planted and Harvested Acres & Yield Acres Planted (Million) Acres Harvested (Million) U.S. Yield bu/acre) Supply (Million Bushels) Beg. Stocks Production 4,296 4,392 4, Total Supply 4,515 4,718 4, Use & Ending Stocks (Million Bushels) Crushing 1,901 2,015 2, Exports 2,174 2,065 2, Seed and Residual Total Use 4,213 4,213 4, U.S. Ending Stocks Foreign Stocks 3,240 2,893 2, Price and Stocks to Use Ratio U.S. Average Price ($/bu) $9.47 $9.40 $8.75-$11.25 $0.60 U.S. Stocks/Use 7.17% 12.66% 8.70% -3.95% June 29 acreage report could increase acres. Too early to put too much stock in yield estimates. Exports are key. Domestic and global stocks are projected to reduce. Price Response Positive Negative Neutral/Unknown
21 Global Soybean Production *projected Country 2016/ / /2019* Acres Harvested (million) Brazil United States Argentina India China ROW Average Yield (bu/acre) Brazil United States Argentina India China ROW Production (billion bushels) Brazil United States Argentina India China ROW % of production from three countries No yield advantage over Brazil/Argentina. Brazil long term growth prospects could be substantial.
22 Global soybean production regions
23 14 Global Soybean Consumption, Billion Bushels Consumption per Year Capita (bu/person) Global demand is increasing Global per capita consumption of soybean is rising due to: Shifting dietary demands A larger middle class that can pay for food
 European Union 9% ROW 26% China 65% 2018/2019 Global Soybean Exports (5.")
24 Soybean Major Importers and Exporters 2018/2019 Global Soybean Imports (5.86 bullion bushels total) European Union 9% ROW 26% China 65% 2018/2019 Global Soybean Exports (5.97 bullion bushels total) Canada Argentina 4% 5% Paraguay ROW 4% 4% United States 38% Brazil 45%
25 Billion Bushels Soybeans "The China Gap", 2006/ / Imports Production Domestic Consumption Ending Stocks China uses substantially more soybeans than it produces the Gap must be made up through during down stocks or imports.
26 Billions of Bushels Global Soybean Ending Stocks, 20012/13 to 2018/19 Marketing Years Argentina Brazil China United States ROW Global stocks projected to decrease in back-toback years. Projected at 6.09 billion to end the 2018/19 marketing year.
27 Soybean Supply and Demand Summary Global demand remains strong. (+) Trade has tremendous uncertainty in the short run. (-) US is dependent on exports to China China is dependent on imports form the US. Trade has tremendous opportunity long run. (+) In 2018, China is estimated to use about 12 million bushels (60 day supply on hand) of soybeans per day (4.35 billion bushels for the year).
28 Futures and Cash PRICES
29 November 2018 Soybeans In 16 Trading days: a range of $10.60 to $8.64 ($1.96 or -18.5%). ~ an $8.3 billion shift in the value of the US soybean crop.
30 0.80 Memphis Soybean Basis, Basis ($/bu) (0.20) (0.40) (0.60) (0.80) January 13 March 13 May 13 July 13 September 13 November 13 January 14 March 14 May 14 July 14 September 14 November 14 January 15 March 15 May 15 July 15 September 15 November 2015 January 2016 March 2016 May 2016 July 2016 September 2016 November 2016 January 2017 March 2017 May 2017 July 2017 September 2017 November 2017 January 18 March 2018 May 2018 (1.00)
31 December 2018 Corn A combination of weather and trade = $0.7 drop in futures. Investment money liquidated long positions.
32 0.25 Monthly Average Corn Basis, Memphis, TN, Basis ($/bu) Jan Feb Mar Apr May Jun Jul Aug Sep Oct Nov Dec
33 Money Flows CFTC COT Report 600,000 Money Flows, CBOT Corn 400,000 Money Flows, CBOT Soybeans Net Contracts (Short-Long) 500, , , , , , , ,000 Prices Up Producer/Merchandiser (Short-Long) Manged Money (Short-Long) Prices Down Net Contracts (Short-Long) 300, , , , , ,000 Prices Up Producer/Merchandiser (Short-Long) Manged Money (Short-Long) Prices Down
34 Price Outlook The long term price outlook for corn and soybeans is fundamentally more bullish than recent years. Currently, markets are not being driven by fundamentals. In the short term until trade negotiations are resolved or find direction volatility will continue. Weather still has the capacity to cause a rally. A rally can likely be expected off of this weeks lows (whether we can maintain the rally or fall back will be determined by political influences and weather. 2018/19 price outlook: Expect big price ranges due to the massive uncertainty: Corn $3.25-$5.00 futures adjust for basis Soybeans $8.00-$11.50 futures adjust for basis
35 Stay the course avoid an emotional response MARKETING OPPORTUNITIES
36 So Now What? Stay the course Do not make a hasty decision (avoid emotional decisions) Now is not the time to rush into the market Stick with your marketing plan Crop insurance/forward pricing/harvest sales/storage Incremental pricing Know your cost of production and how it changes through the season (simple matrix) Know your local basis and harvest basis Evaluate production potential as the season progresses. Evaluate opportunities should they present themselves.
 (221) (183) (144) (105) (66) (28) 11 50 89 128 8.00 (255) (215) (175) (135) (95) (55) (15) 25 65 105 145 8.25 (250) (209) (168) (126) (85) (44) (3) 39 80 121 163 8.")
37 Soybean - Net Return Table ($/acre) $415 Cost of Production Yield (bu/acre) (265) (228) (190) (153) (115) (78) (40) (3) (260) (221) (183) (144) (105) (66) (28) (255) (215) (175) (135) (95) (55) (15) (250) (209) (168) (126) (85) (44) (3) (245) (203) (160) (118) (75) (33) (240) (196) (153) (109) (65) (21) (235) (190) (145) (100) (55) (10) Price 9.25 (230) (184) (138) (91) (45) ($/bu) 9.50 (225) (178) (130) (83) (35) (220) (171) (123) (74) (25) (215) (165) (115) (65) (15) (210) (159) (108) (56) (5) (205) (153) (100) (48) (200) (146) (93) (39) (195) (140) (85) (30) (190) (134) (78) (21)
38 December Corn Futures and Tennessee Production Stages Pre-planting Planting & Emergence Pollination & Silking Dough & Dent Harvest Post-Harvest Price (cents/bu) Jan 1-Feb 1-Mar 1-Apr 1-May 1-Jun 1-Jul 1-Aug 1-Sep 1-Oct 1-Nov 1-Dec
39 Price (cents/bu) November Soybeans Futures and Tennessee Production Stages Pre-Planting Planting & Emergence Blooming & Setting Pods Dropping Leaves & Mature Harvest & Post- Harvest Jan 1-Feb 1-Mar 1-Apr 1-May 1-Jun 1-Jul 1-Aug 1-Sep 1-Oct 1-Nov
40 Take Home High levels of volatility in corn and soybean markets. Don t make emotional decisions. Evaluate all marketing alternatives. Know why you are entering a position. Is this a decision to manage risk? Is this a speculative position? Use the tools available to you Forward contracts / futures / options / storage.. or a combination. Opportunities will present themselves be ready to take advantage.
41 Crop Economics: Questions? THANK YOU!